
At BeInCrypto, we offer regular price analyses and predictions of the most popular and relevant cryptoassets. In our Mar 27 analysis of Zcash (ZEC), we predicted price increases toward the resistance area near $60. Our prediction was validated on Apr 1 during a market-wide spike.
On Mar 26, 2019, Zcash reached a low of $53. A gradual increase accelerated in early April. Zcash reached nearly a high of nearly$80 on Apr 3.
Learn more About Privacy Coins Here!
Zcash (ZEC): Trends and Highlights for Apr 8, 2019
- The price of Zcash has been on a gradual uptrend since Mar 26.
- ZEC is following an ascending support line.
- It has made a double top pattern.
- Bearish divergence developing in the RSI.
- There is resistance near $77 and support near $59.
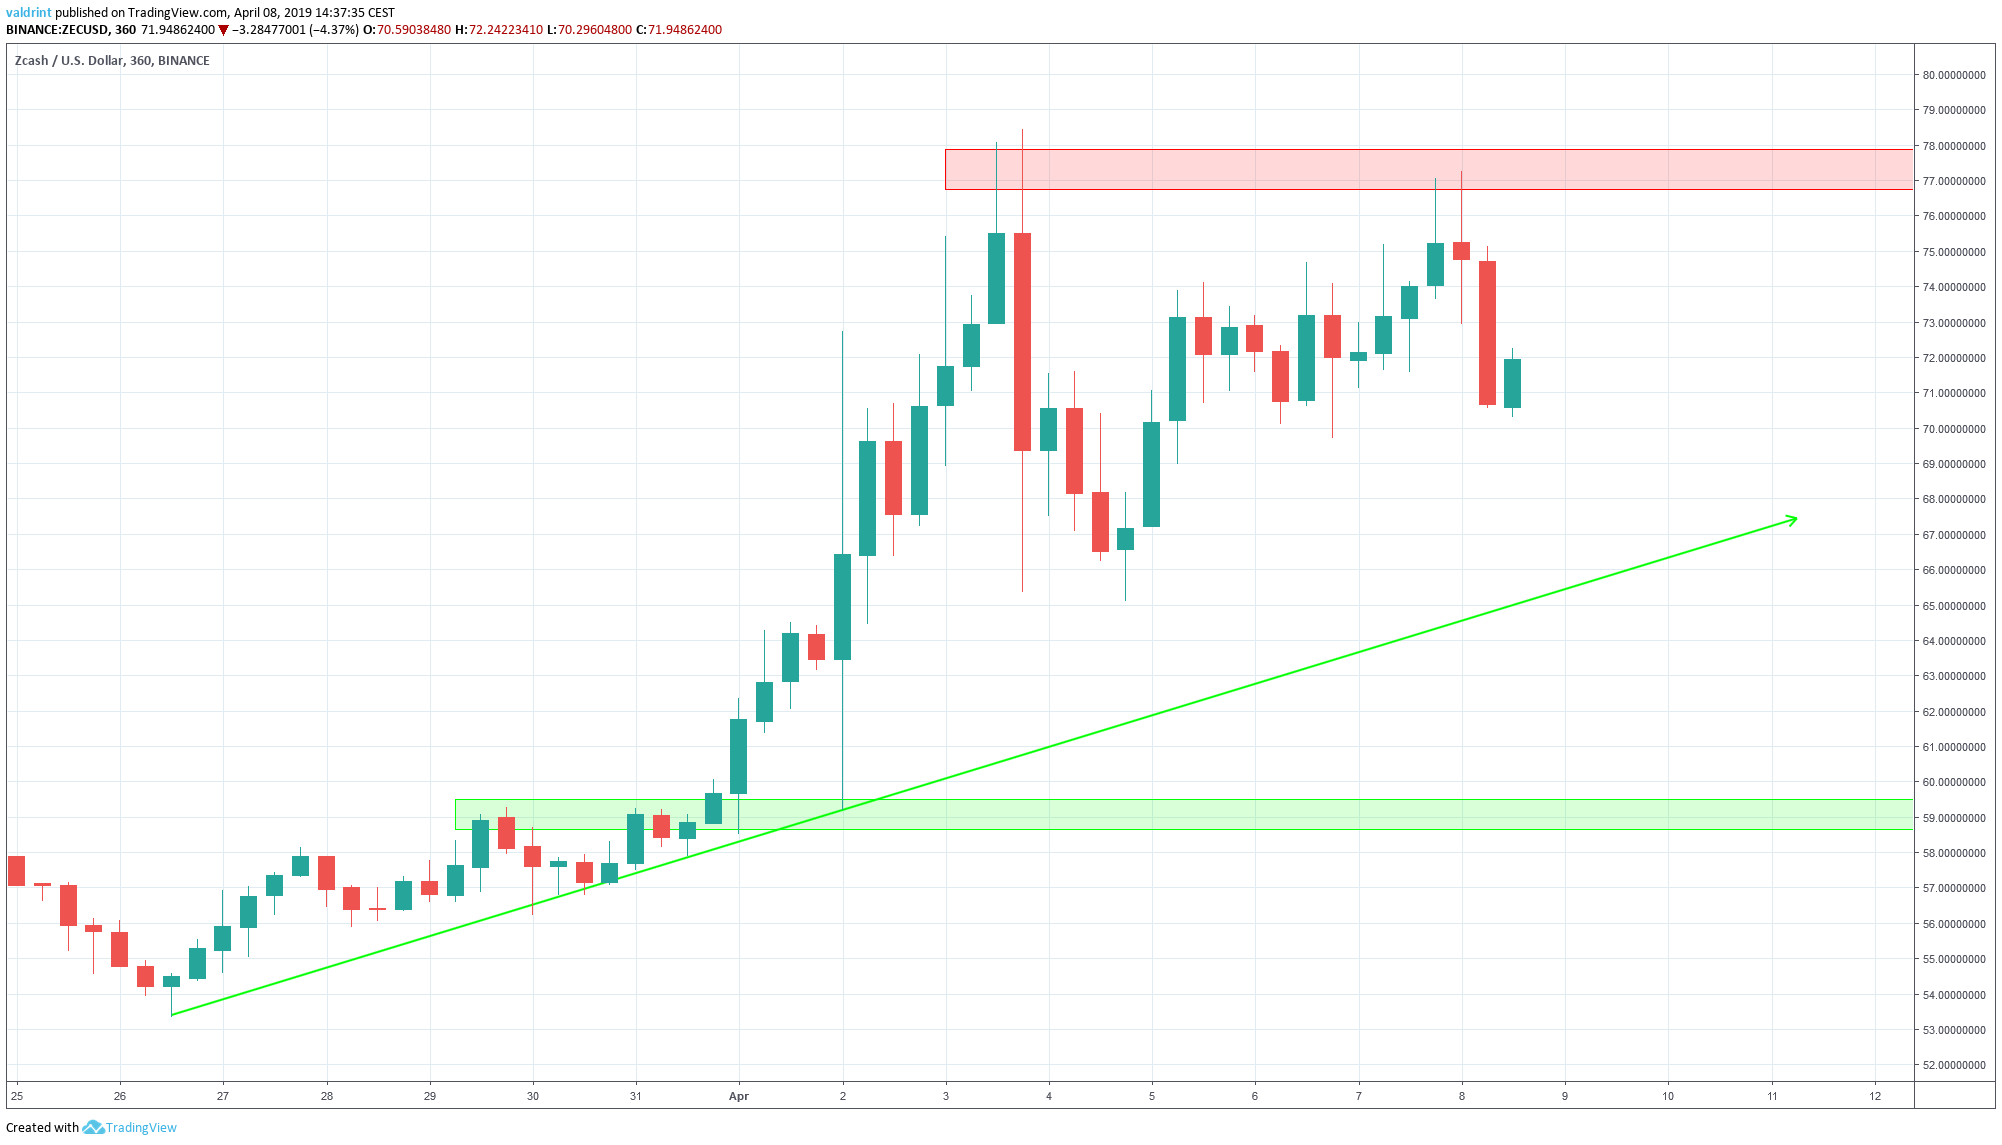
Ascending Support Line
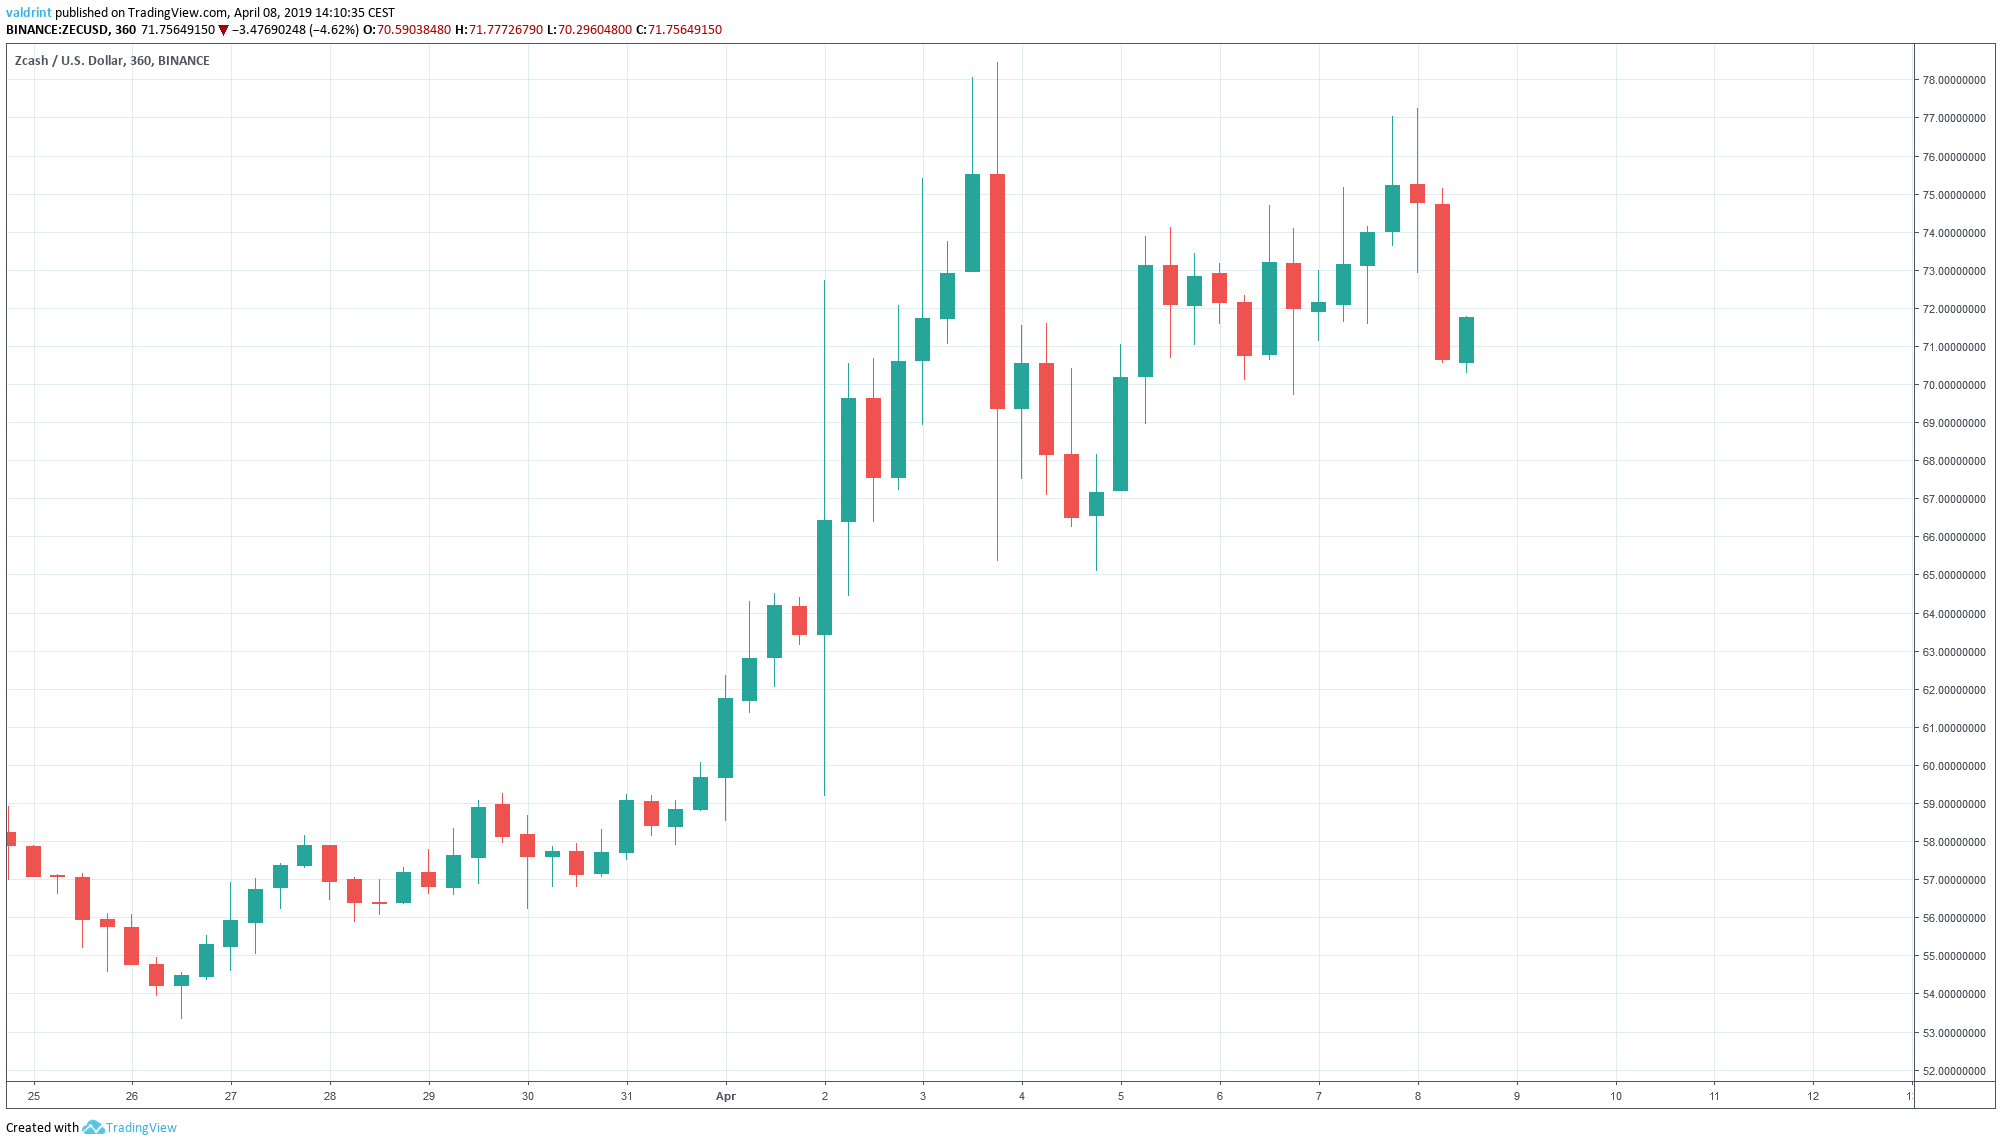
We analyze the price of ZEC on Binance at six-hour intervals from Mar 26 to Apr 8 in order to trace the current pattern.
The price made a low of $53.60 on Mar 26. A gradual upward move followed. Several market cycles have been completed since and after each one the lows have been higher than the preceding ones.
Tracing these lows gives us an ascending support line: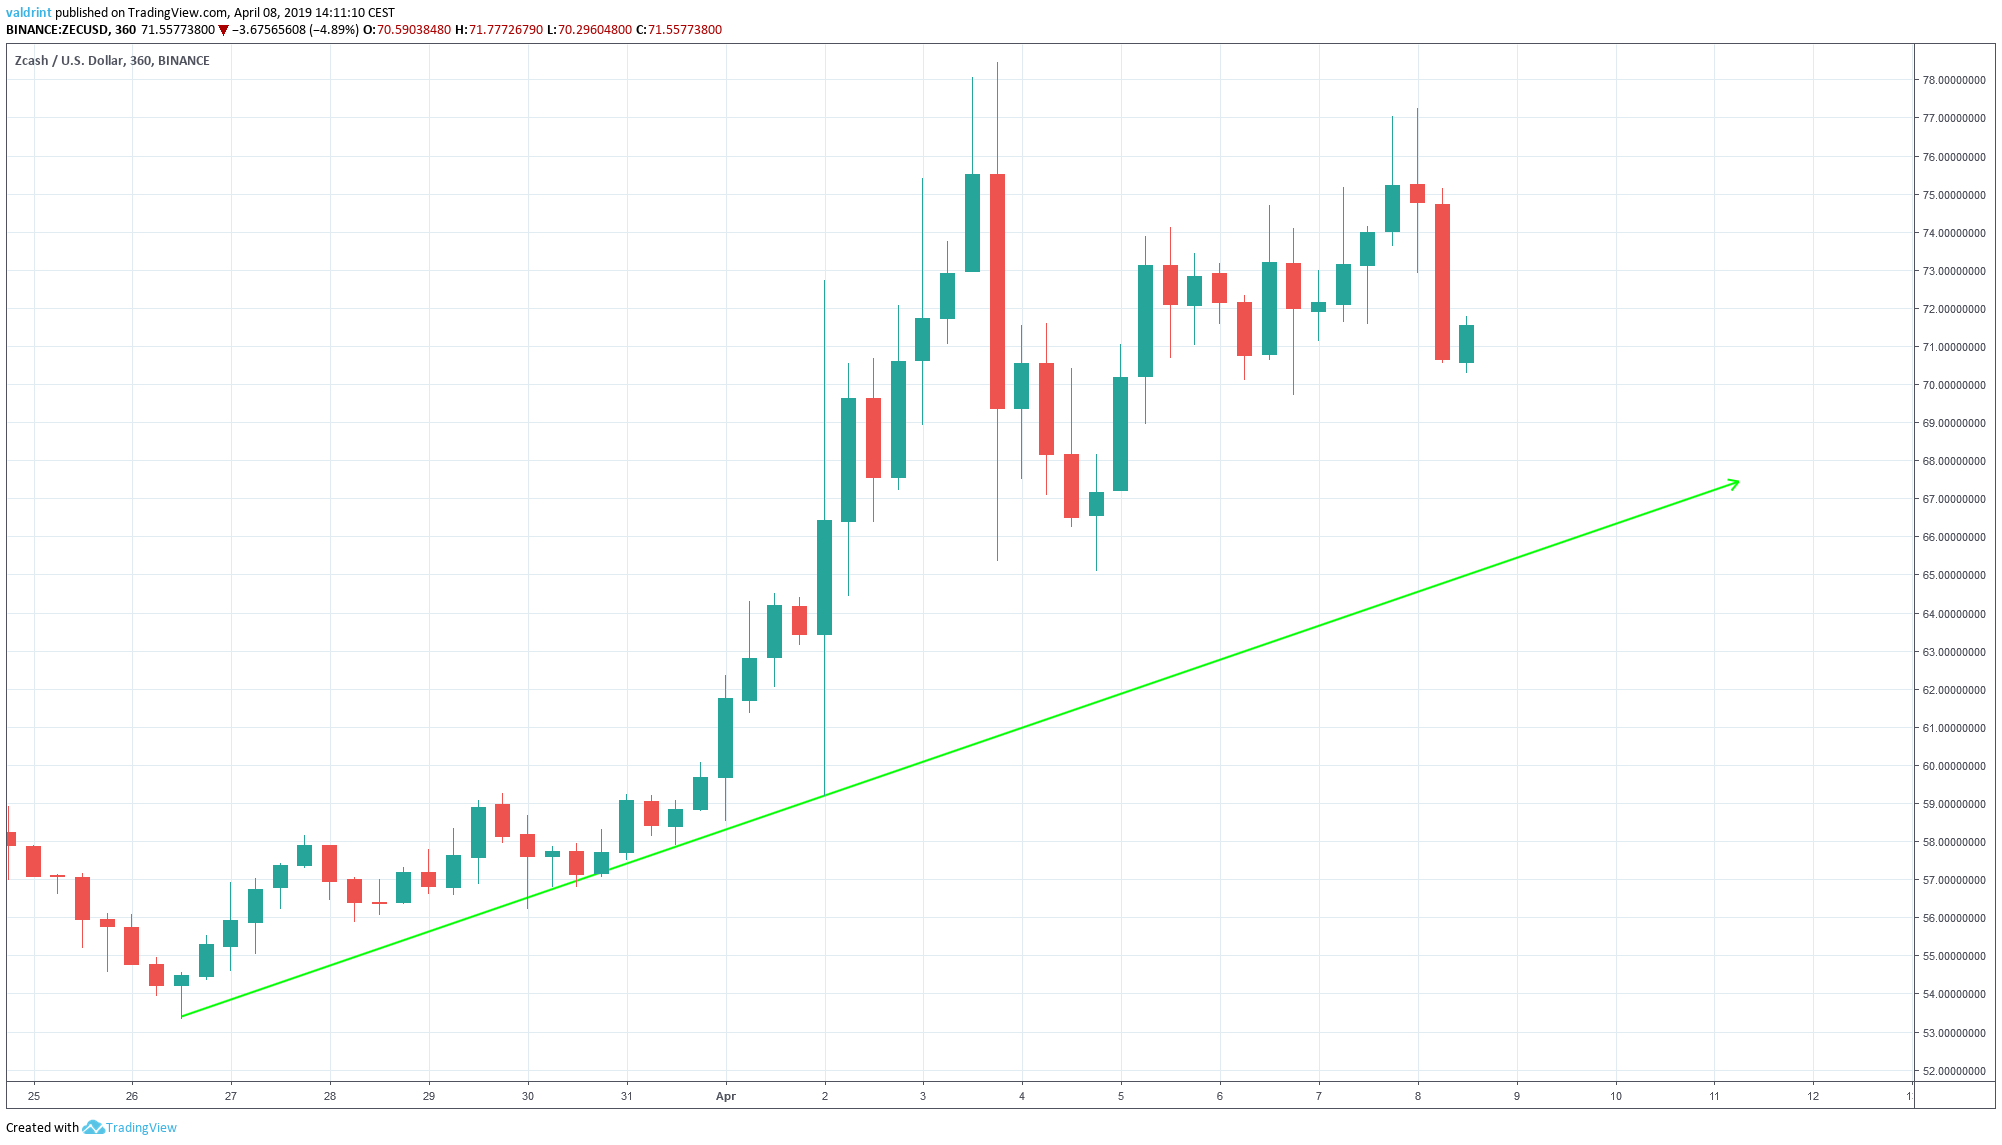 There is no visible resistance line. However, there is a possible bearish pattern forming. Let’s learn more.
Bearish Pattern
The bearish pattern that appears to be developing is referred to as a “double top.”A double top is a bearish technical reversal pattern that forms after an asset reaches a high price two consecutive times with a moderate decline between the two highs.
On Apr 3, the price reached a high of $78.45. It reached a similar high of $77.25 on Apr 8.
The arrows in that chart below locate these two points:
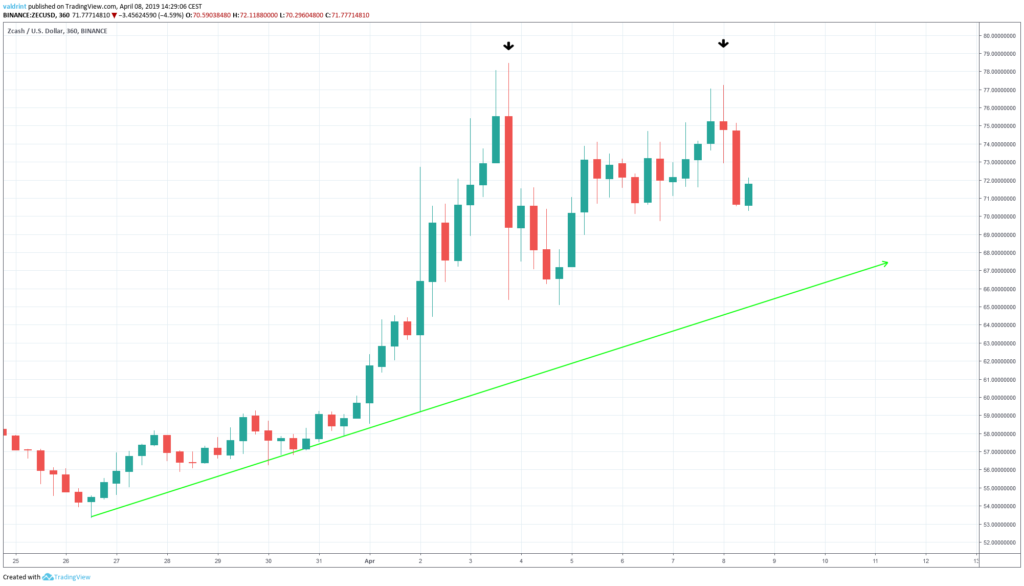 In addition, there was a moderate decline between the two highs. Thus, the price of Zcash appears to exhibit the characteristics of a double top pattern.
Because this is a bearish pattern, A drop towards the support line appears likely.
In order to assess whether price drops are indeed likely, we need to take a look at some technical indicators.
In addition, there was a moderate decline between the two highs. Thus, the price of Zcash appears to exhibit the characteristics of a double top pattern.
Because this is a bearish pattern, A drop towards the support line appears likely.
In order to assess whether price drops are indeed likely, we need to take a look at some technical indicators.
RSI Divergence
We begin by incorporating RSI into our analysis.About RSI: The relative strength index (RSI) is an indicator which calculates the size of the changes in price in order to determine oversold or overbought conditions in the market.
RSI is shown alongside price below. The double top pattern and support line are also traced:
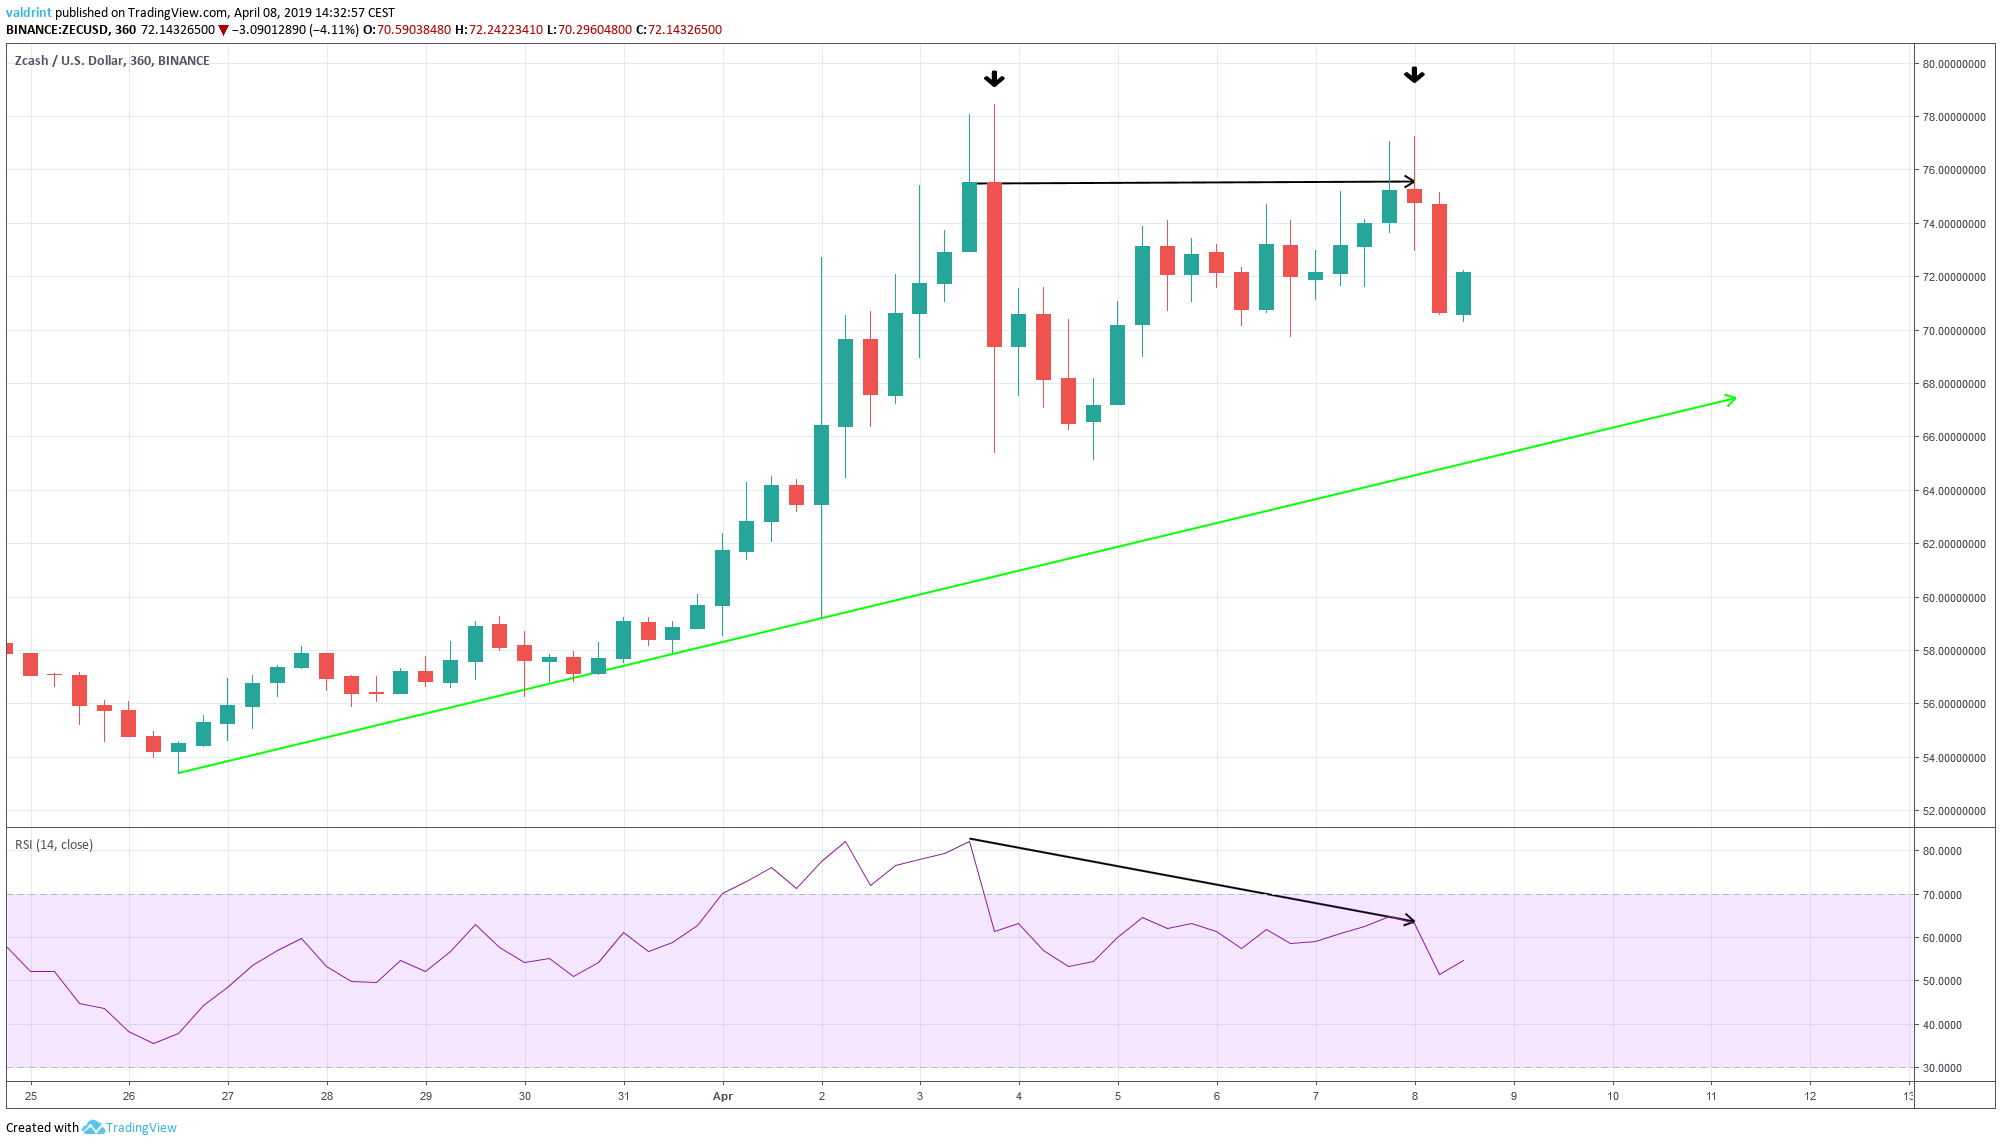 On Apr 3 the price made a high of $78.45. It reached a similar level on Apr 8.
Similarly, the RSI made its first high during the same interval. However, it has proceeded to generate lower values.
This is known as bearish divergence and often precedes price decreases.
Using this indicator combined with the double top pattern, we believe that price drops are likely in the near future.
On Apr 3 the price made a high of $78.45. It reached a similar level on Apr 8.
Similarly, the RSI made its first high during the same interval. However, it has proceeded to generate lower values.
This is known as bearish divergence and often precedes price decreases.
Using this indicator combined with the double top pattern, we believe that price drops are likely in the near future.
Reversal Areas
To determine possible future price levels, we incorporate resistance and support areas into the analysis.
Resistance and support areas are created when the price reaches the same level several times. They can provide likely reversal areas in case a breakout/breakdown occurs.
These areas are traced in the graph below:
Summary of Analysis
Based on this analysis, the price will likely drop towards the ascending support line. This means a likely short-term decrease in price. Do you think the price of ZEC will drop towards the support line? Let us know in the comments below. Disclaimer: This article is not trading advice and should not be construed as such. Always consult a trained financial professional before investing in cryptocurrencies, as the market is particularly volatile.Disclaimer
In line with the Trust Project guidelines, this price analysis article is for informational purposes only and should not be considered financial or investment advice. BeInCrypto is committed to accurate, unbiased reporting, but market conditions are subject to change without notice. Always conduct your own research and consult with a professional before making any financial decisions. Please note that our Terms and Conditions, Privacy Policy, and Disclaimers have been updated.

Valdrin Tahiri
Valdrin discovered cryptocurrencies while he was getting his MSc in Financial Markets from the Barcelona School of Economics. Shortly after graduating, he began writing for several different cryptocurrency related websites as a freelancer before eventually taking on the role of BeInCrypto's Senior Analyst.
(I do not have a discord and will not contact you first there. Beware of scammers)
READ FULL BIO
Sponsored
Sponsored