


Ripple’s XRP price has closed below a crucial horizontal area, sparking fears that the trend is bearish.
The downward movement is expected to continue unless the price reclaims this area and begins a significant upward movement.
XRP Price Falls Below Long-Term Support
The weekly time frame technical analysis for XRP provides a bearish outlook. This is because of both the price action and the RSI readings.
Firstly, the XRP price has fallen since its yearly high of $0.93 in July. At the time, it was rejected by the 0.382 Fib retracement resistance level (red icon). This created a long upper wick, indicating that sellers had taken over and the trend is bearish.
Shortly afterwards, the price fell below the $0.55 long-term horizontal area. After XRP initially broke out, the area was expected to provide support. However, this was not the case as the price fell and closed below it last week.
If the downward movement continues, the closest support at $0.30 will be 40% below the current price. On the other hand, reclaiming the $0.55 area can lead to a 85% price increase to the yearly high at $0.93.
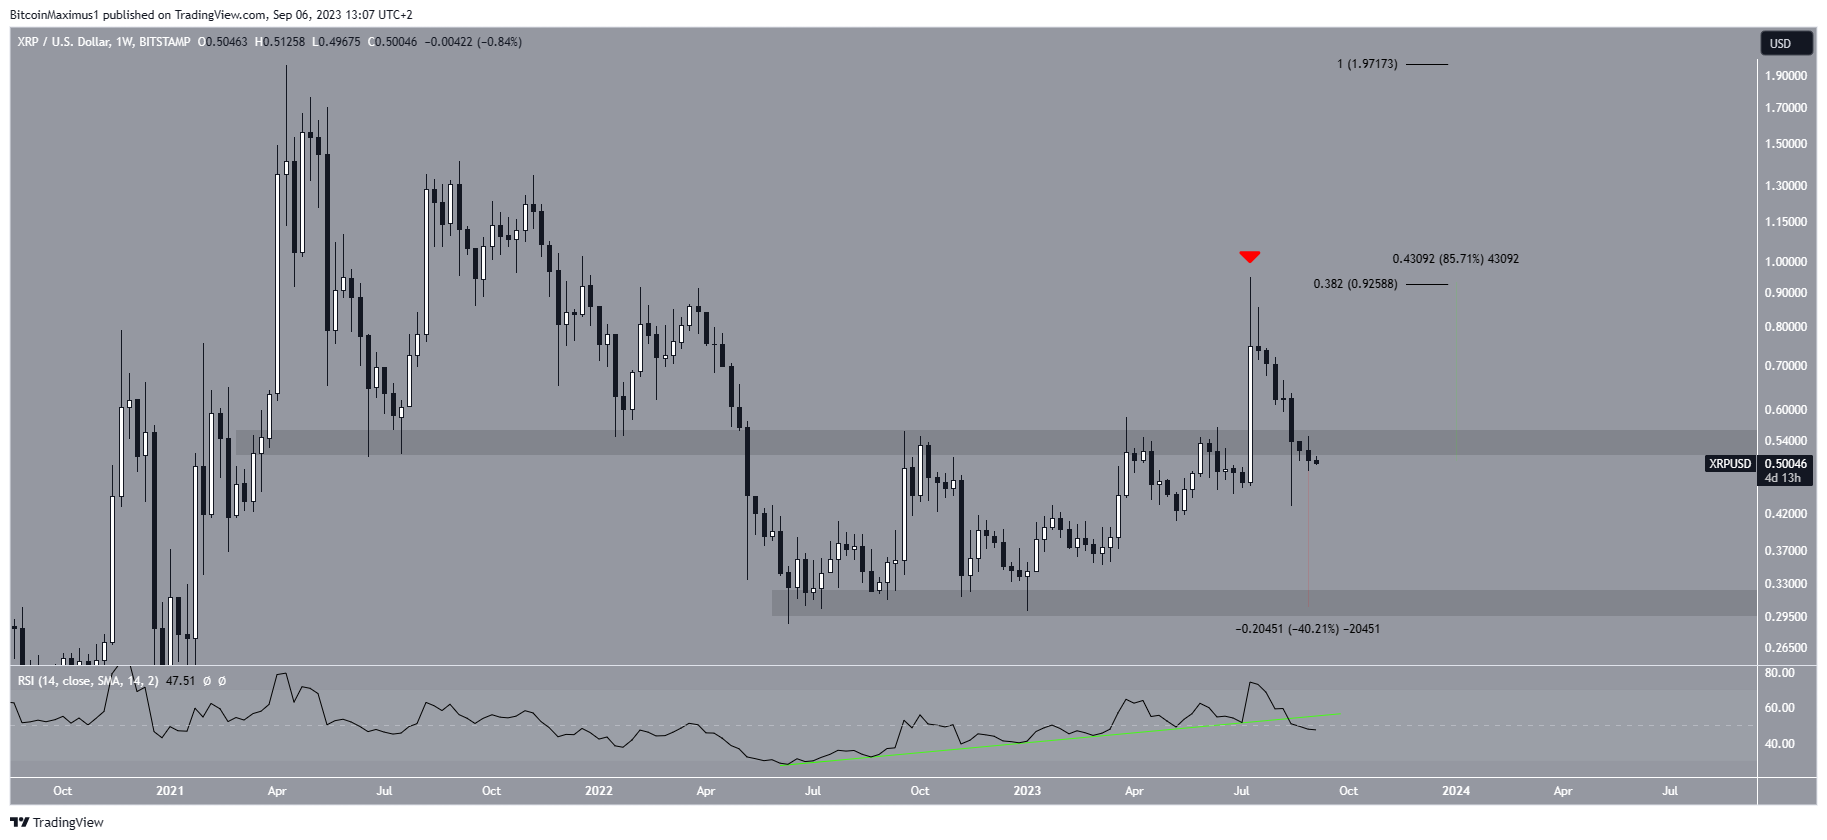
Finally, the weekly RSI has turned bearish. When evaluating market conditions, traders use the RSI as a momentum indicator to determine if a market is overbought or oversold, and to decide whether to accumulate or sell an asset.
If the RSI reading is above 50 and the trend is upward, bulls still have an advantage, but if the reading is below 50, the opposite is true.
The indicator has fallen below 50 and has broken down from its ascending support line (green). These are both signs of a bearish trend, supporting the continuing of the downward movement.
Will Bullish Divergence Initiate Trend Reversal?
The daily timeframe readings align with those from the weekly one. The main reason for this is the deviation above the $0.54 area and subsequent decrease below it. These deviations are considerd signs of a bearish trend.
After falling below the area, XRP validated it as resitsance twice (red icons) before resuming its descent.
If the price continues to fall, the closest support will be at $0.40, 22% below the current price. The support is created by an ascending support line that has been in place since June 2022. Since the line has been in place for such a long period of time, it is expected to provide a bounce once the price gets there.
Additionally, the daily RSI is below 50 and falling. These are both considered signs of a bearish trend.
The RSI provides mixed signs. While the indicator is below 50, it has also generated a significant amount of bullish divergence. This divergence often precedes bullish trend reversals. However, it remains to be seen if it is sufficient to negate all the other bearish signs.
It is also worth mentioning that the Ripple has objected the U.S. Securities and Exchange Commission’s appeal, arguing that the latter has failed to establish the three conditions required to certify an appeal. Moreover, Panos Mekras, the founder of two crypto firms has stated that XRP can disrupt the banking industry.
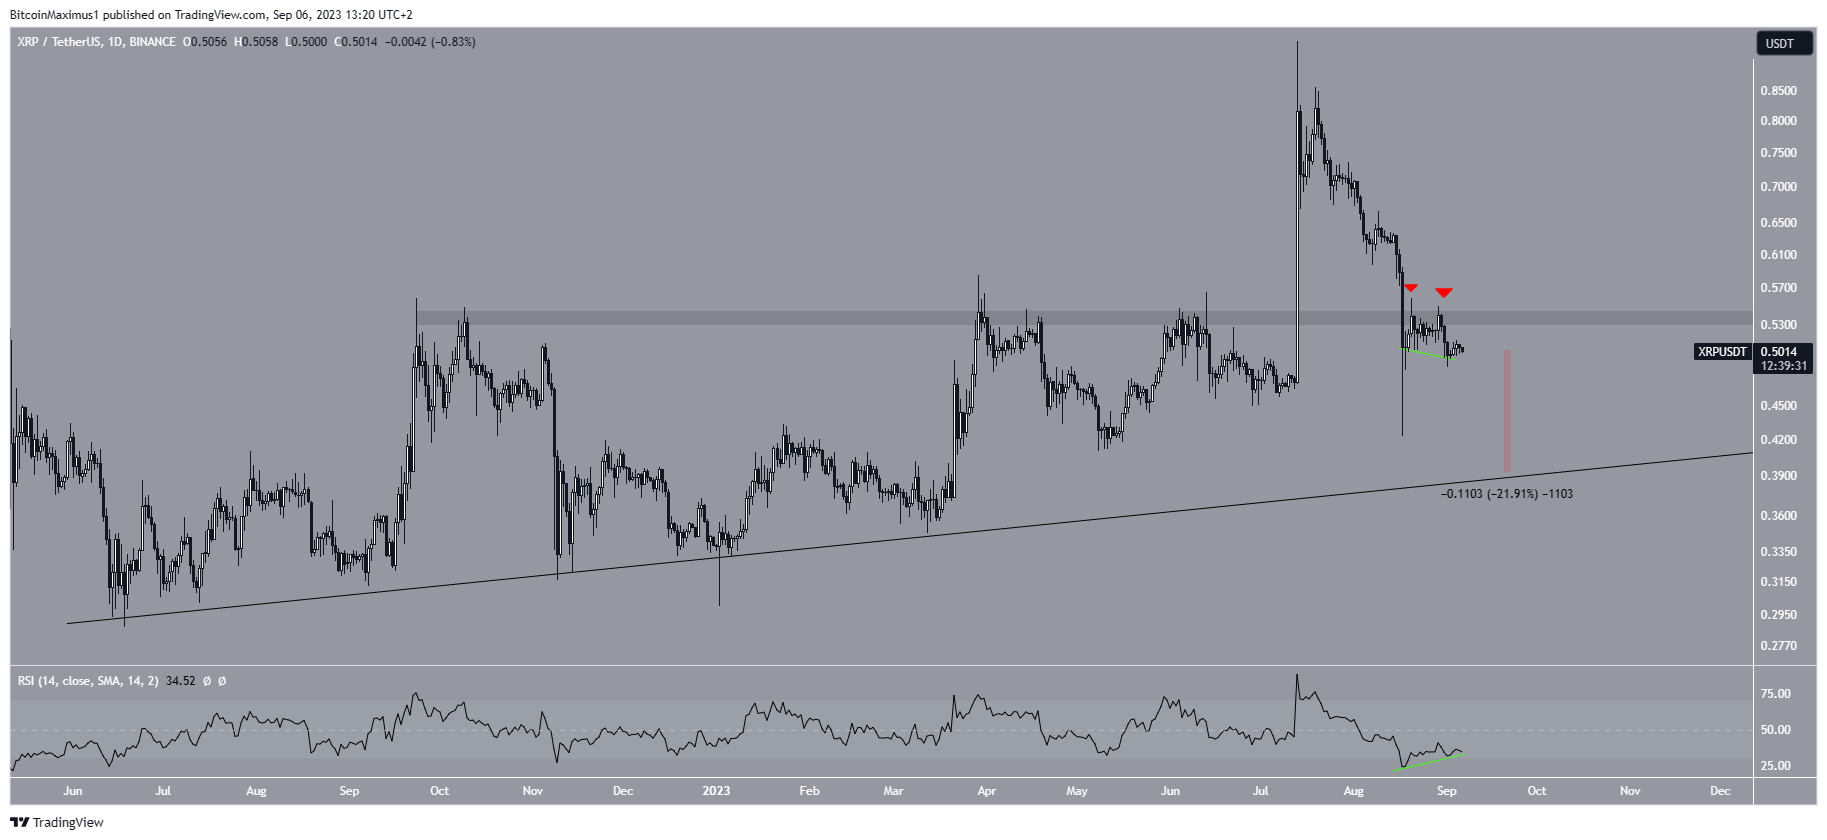
Therefore, the most likely XRP price prediction is a drop to the closest support at $0.40.
However, reclaiming the $0.55 area will mean that the trend is still bullish. In that case, the price can increase by 85% and move towards a new yearly high.
For BeInCrypto’s latest crypto market analysis, click here.


