
At BeInCrypto, we publish regular price analyses and predictions for XRP. In our Mar 29 analysis, we predicted that XRP—still known widely as Ripple—would experience slight decreases and drop to the support area of the channel we have defined below. It did so later that day. However, a rapid upward move began on Apr 2, which brought prices near $0.40 before a drop the following day. What will happen next? Read on to find out!
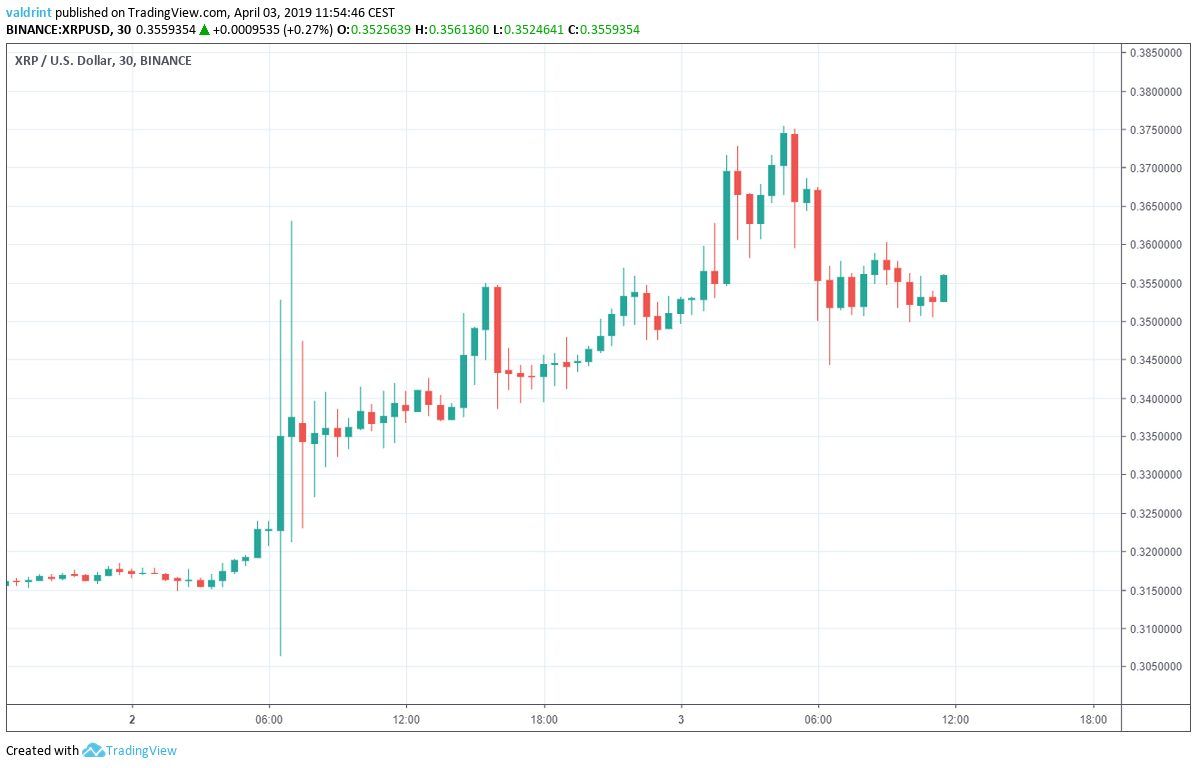
On Apr 2, 2019, the price of XRP (XRP) reached a low of $0.315. Then a market-wide spike brought XRP to highs over $0.35—a level XRP struggled to reach throughout March.
Prices continued rising until they reached a height of $0.375 on Apr 3. XRP has since suffered gradual losses as price move back toward $0.35.
Have the bears returned to XRP?
XRP (XRP): Trends and Highlights for Apr 3, 2019
- The price of XRP/USD has been on an uptrend since Apr 2.
- XRP broke down from an ascending channel.
- The breakdown was preceded by bearish divergence in the RSI.
- There is resistance near $$0.375 and support near $0.34.
Ascending Channel
The price of XRP/USD is analyzed at thirty-minute intervals from Apr 1 to Apr 3 to help determine current trading patterns.
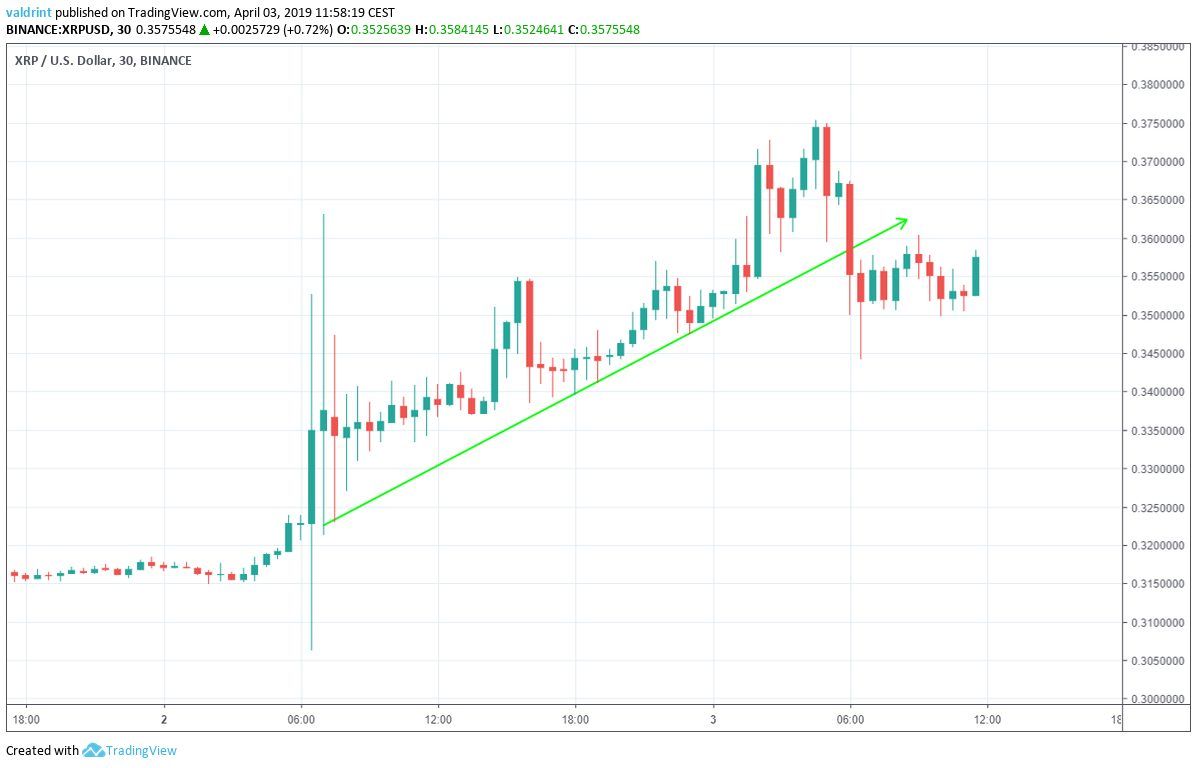
On Apr 2, the price reached an hourly low of $0.321. It has been gradually increasing since, creating several higher lows.
Tracing these lows gives us an ascending support line. XRP broke down from this support on Apr 3:
 On Apr 2, the price also made an hourly high of $0.347. Since then, it has continued to increase, creating several higher highs.
Tracing these highs gives us an ascending resistance line.
The resistance and support lines combine to create an ascending channel:
On Apr 2, the price also made an hourly high of $0.347. Since then, it has continued to increase, creating several higher highs.
Tracing these highs gives us an ascending resistance line.
The resistance and support lines combine to create an ascending channel:
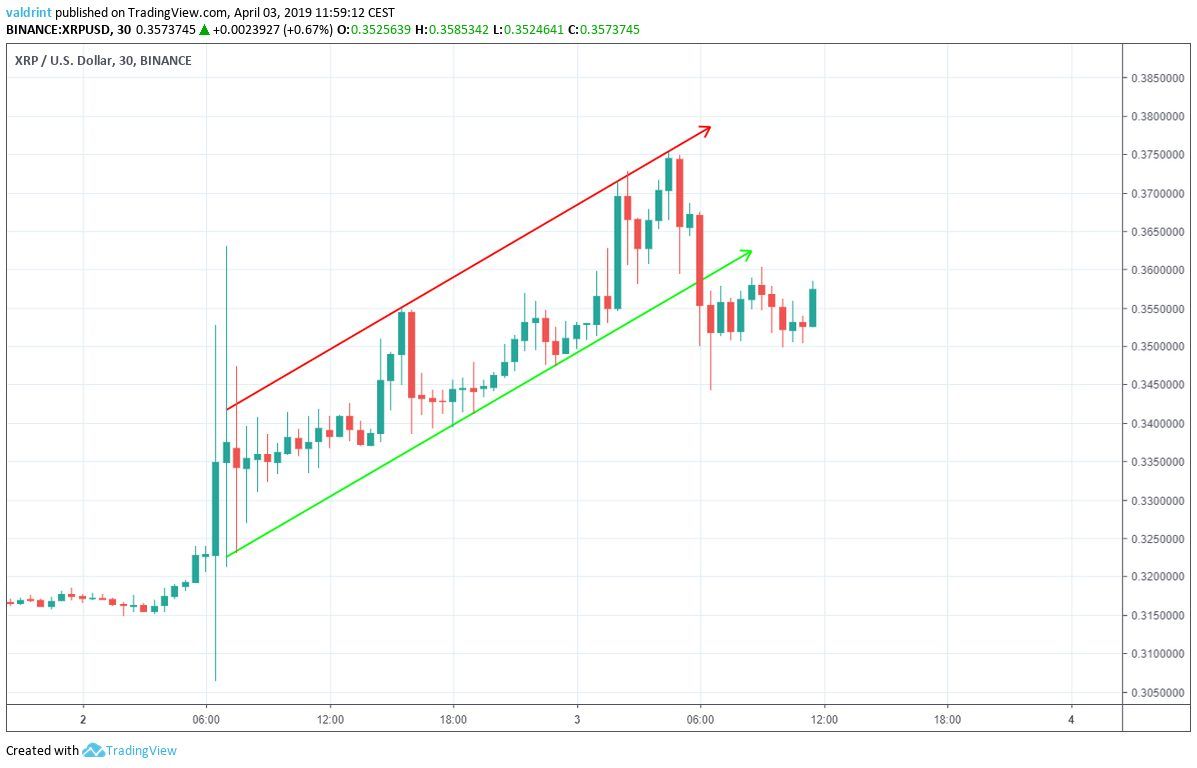 The price broke down from the channel on Apr 3 when it dropped below support.
Bearish Divergence
To better determine future possible price fluctuations for XRP, we integrate technical indicators into our analysis.About the Indicators: The relative strength index (RSI) is an indicator which calculates the size of the changes in price in order to determine oversold or overbought conditions in the market.
RSI is shown with price in the graph below:
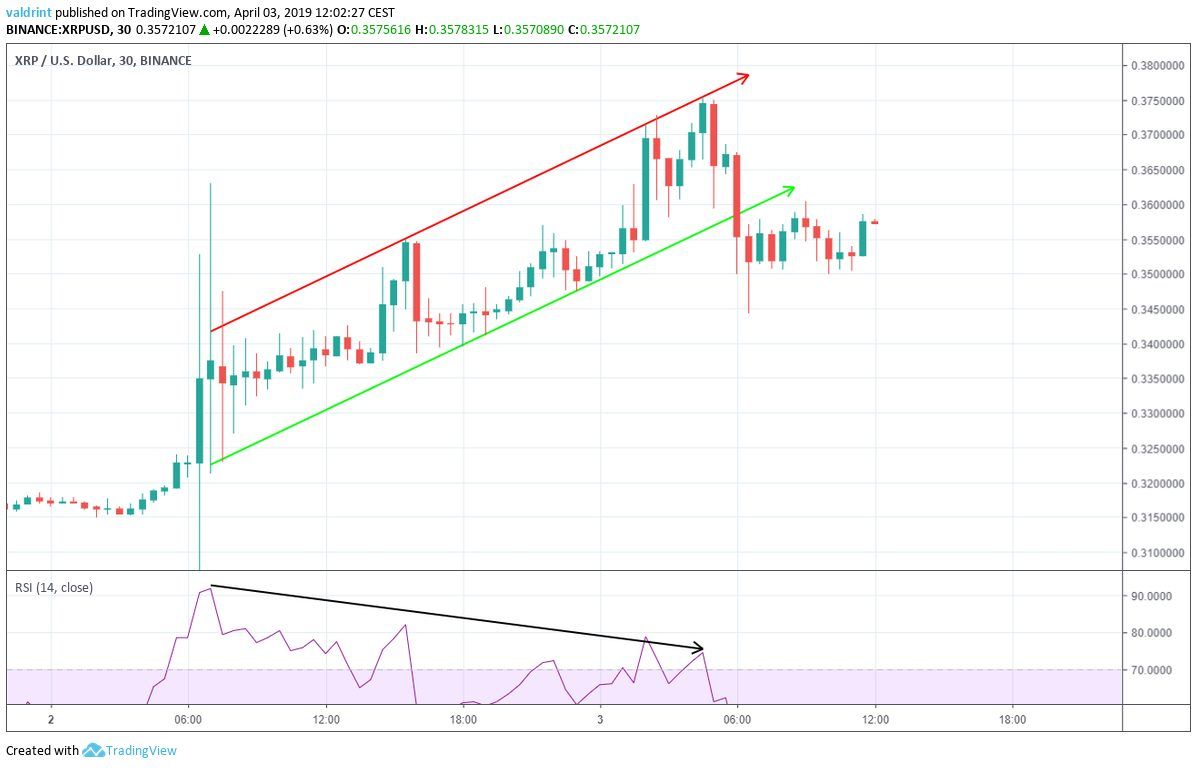 On Apr 2, the price reached an hourly high of $0.347. It has continued to increase since.
Similarly, the RSI made the first high on Apr 2. However, it has proceeded to generate lower values.
This is known as bearish divergence and often precedes price decreases. It emerged prior to the breakdown from support. Thus, the price drops we have seen so far are not surprising.
Furthermore, continued price drops appear likely based on the current RSI. The breakdown from support is another indicator that XRP/USD is going to continue losing value.
On Apr 2, the price reached an hourly high of $0.347. It has continued to increase since.
Similarly, the RSI made the first high on Apr 2. However, it has proceeded to generate lower values.
This is known as bearish divergence and often precedes price decreases. It emerged prior to the breakdown from support. Thus, the price drops we have seen so far are not surprising.
Furthermore, continued price drops appear likely based on the current RSI. The breakdown from support is another indicator that XRP/USD is going to continue losing value.
 It should be noted that while Bitcoin (BTC), Litecoin (LTC), Ethereum (ETH), Stellar lumens (XLM), Cardano (ADA), Dogecoin (DOGE), and EOS (EOS) saw gains in March, XRP saw losses.
The losses that are now occurring might be an indication that XRP’s March bears are following the cryptocurrency into April.
It should be noted that while Bitcoin (BTC), Litecoin (LTC), Ethereum (ETH), Stellar lumens (XLM), Cardano (ADA), Dogecoin (DOGE), and EOS (EOS) saw gains in March, XRP saw losses.
The losses that are now occurring might be an indication that XRP’s March bears are following the cryptocurrency into April.
Resistance and Support
To best determine, possible price levels in the future, we incorporate resistance and support areas into the analysis.
Resistance and support areas are created when the price revisits the same level several times. They help to determine possible future price values given increases, decreases, breakouts, and breakdowns.
Possible price levels for the future are shown below:
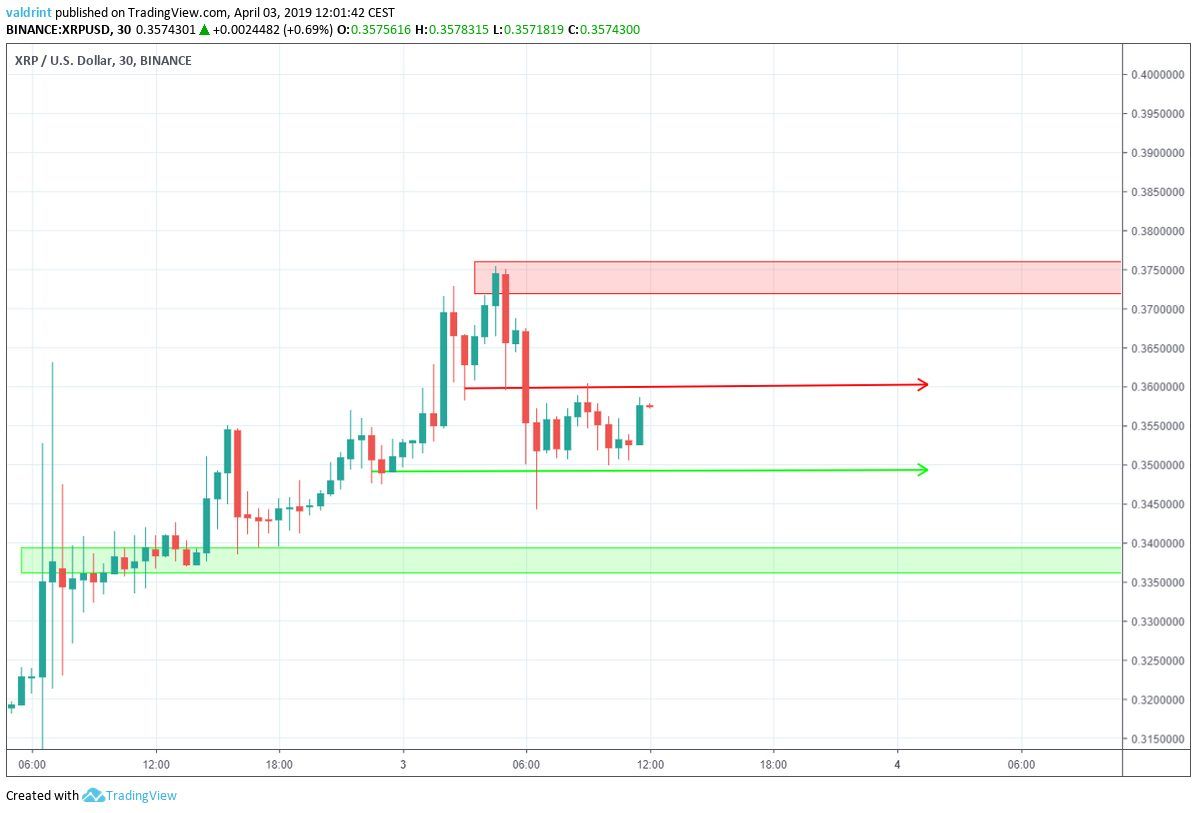 Since the breakdown, the price has not created a clear trading structure.
However, it is possibly trading inside a horizontal channel with resistance and support at $0.36 and $0.35 respectively. We believe that this is possible but unlikely.
On the contrary, the indicators, breakdown, and March losses all suggest that XRP will continue along a downtrend. It may break down below support soon.
In such an event, prices may stabilize between $0.335 and $0.34.
Since the breakdown, the price has not created a clear trading structure.
However, it is possibly trading inside a horizontal channel with resistance and support at $0.36 and $0.35 respectively. We believe that this is possible but unlikely.
On the contrary, the indicators, breakdown, and March losses all suggest that XRP will continue along a downtrend. It may break down below support soon.
In such an event, prices may stabilize between $0.335 and $0.34.
Summary of Analysis
Based on this analysis, the price of XRP is likely to a breakdown below the support of the short-term channel defined above. Price drops below $0.35 could lead to consolidation between $0.335 and $0.34. Do you think the price of XRP will keep trading inside the channel? Let us know in the comments below Disclaimer: This article is not trading advice and should not be construed as such. Always consult a trained financial professional before investing in cryptocurrencies, as the market is particularly volatile.Disclaimer
In line with the Trust Project guidelines, this price analysis article is for informational purposes only and should not be considered financial or investment advice. BeInCrypto is committed to accurate, unbiased reporting, but market conditions are subject to change without notice. Always conduct your own research and consult with a professional before making any financial decisions. Please note that our Terms and Conditions, Privacy Policy, and Disclaimers have been updated.

Valdrin Tahiri
Valdrin discovered cryptocurrencies while he was getting his MSc in Financial Markets from the Barcelona School of Economics. Shortly after graduating, he began writing for several different cryptocurrency related websites as a freelancer before eventually taking on the role of BeInCrypto's Senior Analyst.
(I do not have a discord and will not contact you first there. Beware of scammers)
READ FULL BIO
Sponsored
Sponsored