


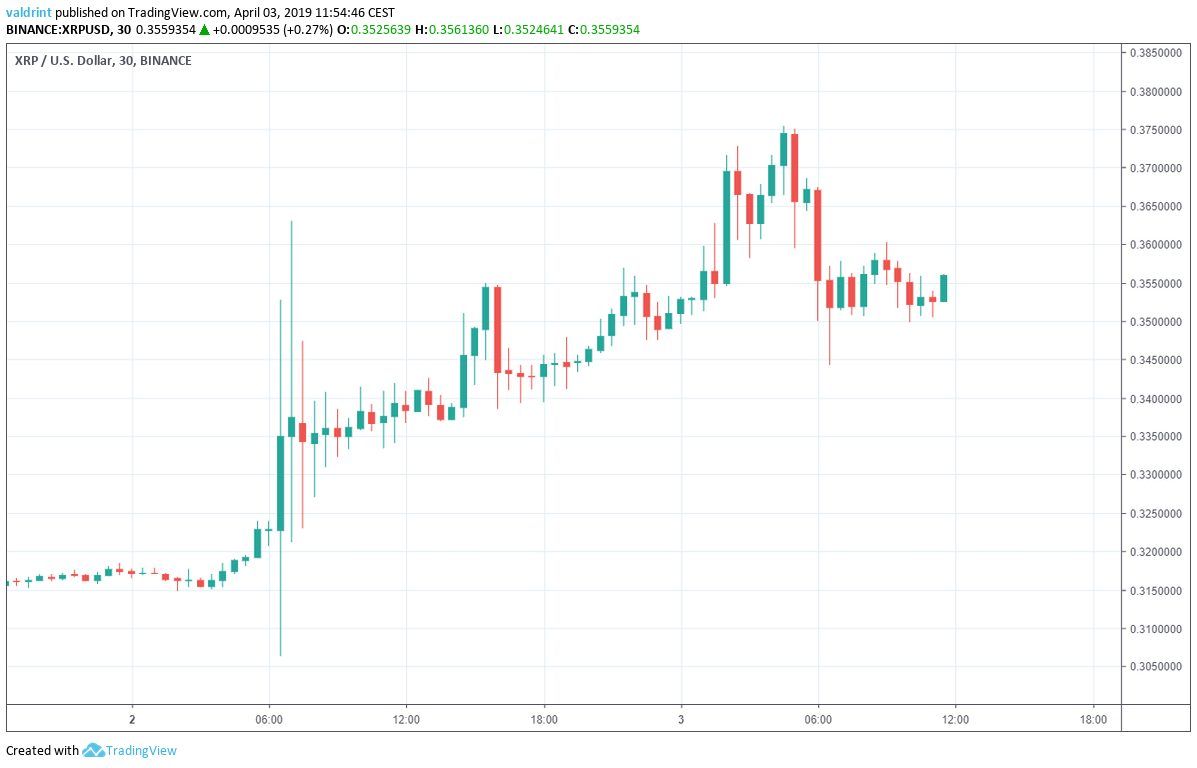
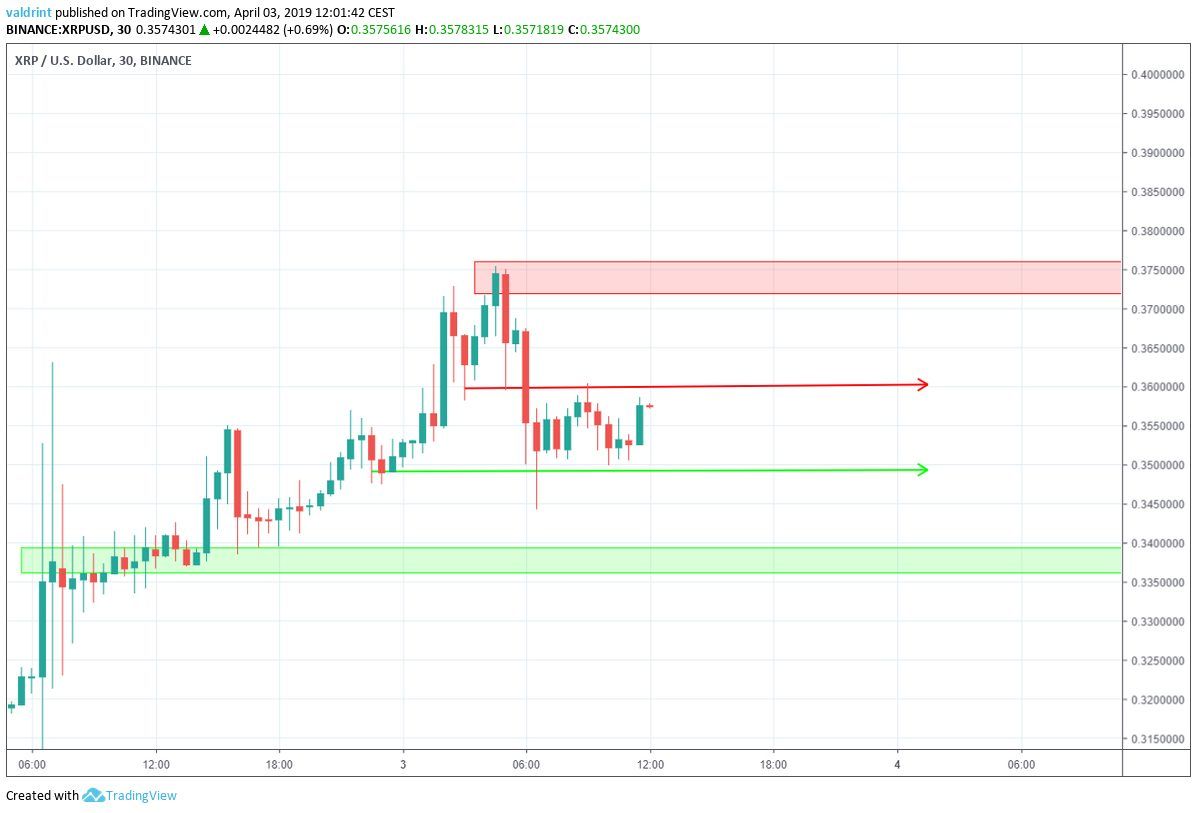
On Apr 2, 2019, the price of XRP (XRP) reached a low of $0.315. Then a market-wide spike brought XRP to highs over $0.35—a level XRP struggled to reach throughout March.
Prices continued rising until they reached a height of $0.375 on Apr 3. XRP has since suffered gradual losses as price move back toward $0.35.
Have the bears returned to XRP?
XRP (XRP): Trends and Highlights for Apr 3, 2019
- The price of XRP/USD has been on an uptrend since Apr 2.
- XRP broke down from an ascending channel.
- The breakdown was preceded by bearish divergence in the RSI.
- There is resistance near $$0.375 and support near $0.34.
Ascending Channel
On Apr 2, the price reached an hourly low of $0.321. It has been gradually increasing since, creating several higher lows.
Tracing these lows gives us an ascending support line. XRP broke down from this support on Apr 3:
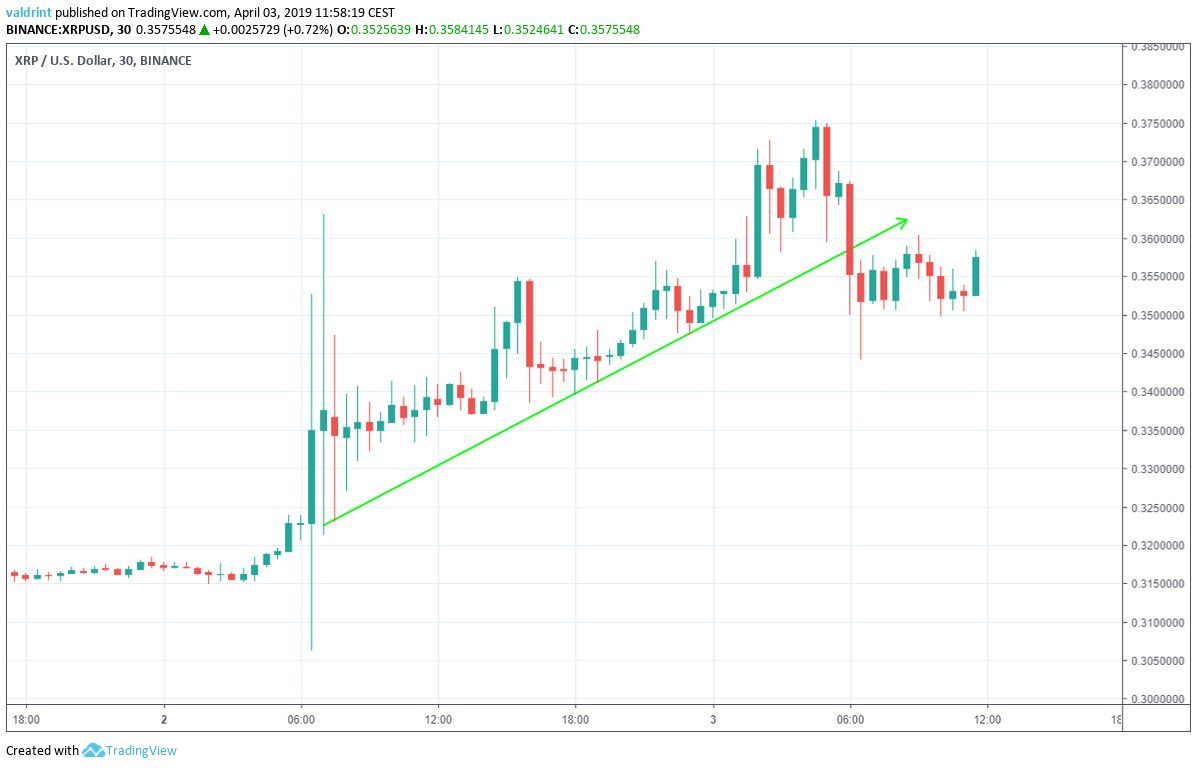
On Apr 2, the price also made an hourly high of $0.347. Since then, it has continued to increase, creating several higher highs.
Tracing these highs gives us an ascending resistance line.
The resistance and support lines combine to create an ascending channel:
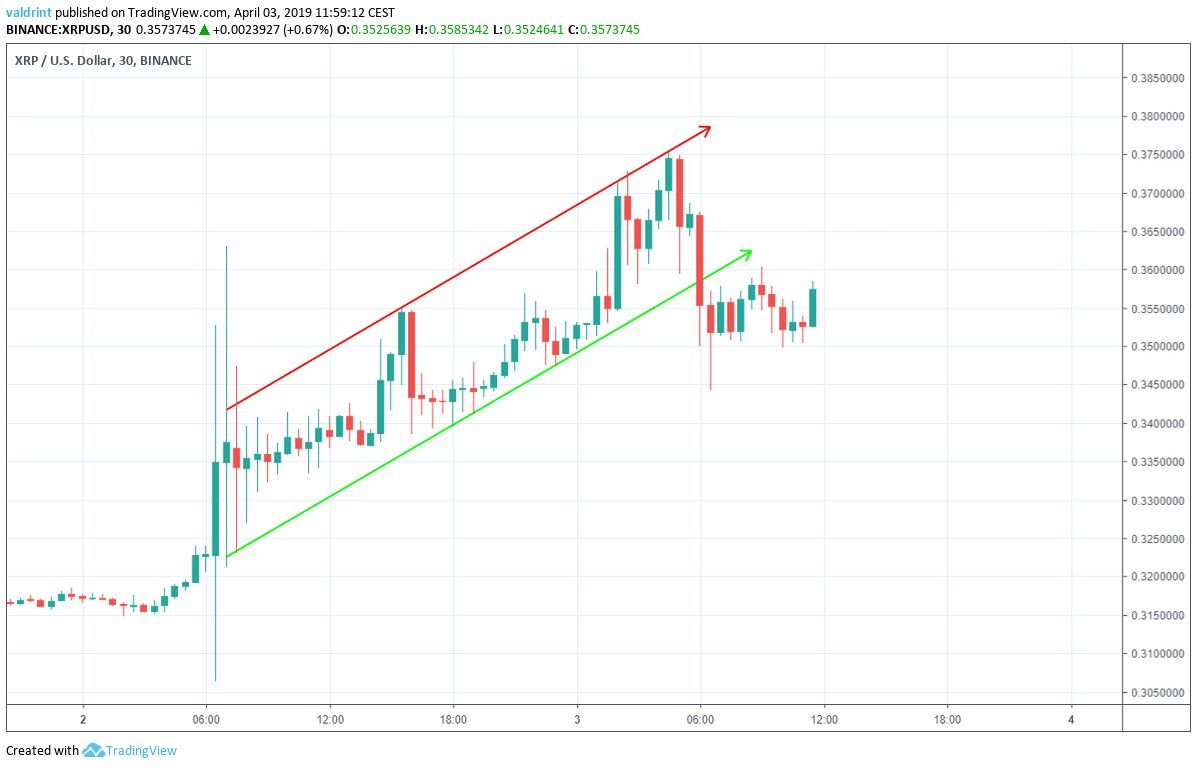
The price broke down from the channel on Apr 3 when it dropped below support.
Bearish Divergence
To better determine future possible price fluctuations for XRP, we integrate technical indicators into our analysis.
RSI is shown with price in the graph below:
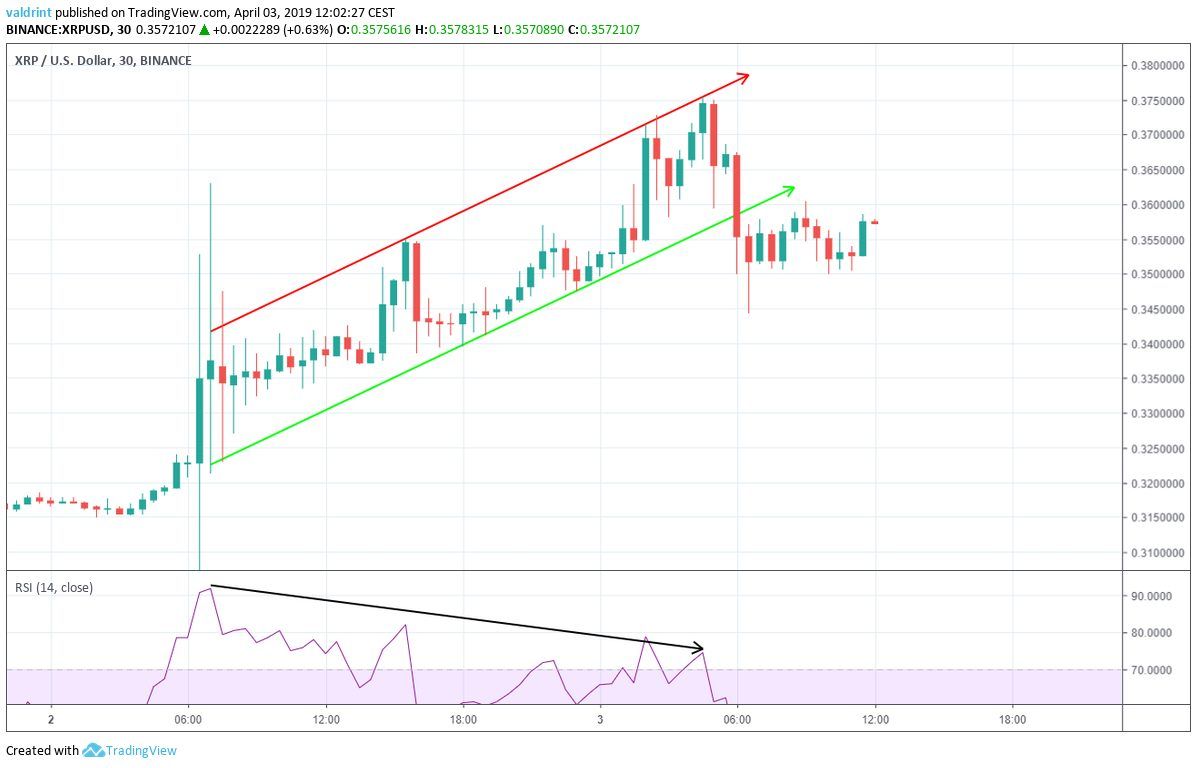
On Apr 2, the price reached an hourly high of $0.347. It has continued to increase since.
Similarly, the RSI made the first high on Apr 2. However, it has proceeded to generate lower values.
This is known as bearish divergence and often precedes price decreases. It emerged prior to the breakdown from support. Thus, the price drops we have seen so far are not surprising.
Furthermore, continued price drops appear likely based on the current RSI. The breakdown from support is another indicator that XRP/USD is going to continue losing value.
It should be noted that while Bitcoin (BTC), Litecoin (LTC), Ethereum (ETH), Stellar lumens (XLM), Cardano (ADA), Dogecoin (DOGE), and EOS (EOS) saw gains in March, XRP saw losses.
The losses that are now occurring might be an indication that XRP’s March bears are following the cryptocurrency into April.
Resistance and Support
Since the breakdown, the price has not created a clear trading structure.
However, it is possibly trading inside a horizontal channel with resistance and support at $0.36 and $0.35 respectively. We believe that this is possible but unlikely.
On the contrary, the indicators, breakdown, and March losses all suggest that XRP will continue along a downtrend. It may break down below support soon.
In such an event, prices may stabilize between $0.335 and $0.34.
Summary of Analysis
Based on this analysis, the price of XRP is likely to a breakdown below the support of the short-term channel defined above. Price drops below $0.35 could lead to consolidation between $0.335 and $0.34.
Do you think the price of XRP will keep trading inside the channel? Let us know in the comments below
Disclaimer: This article is not trading advice and should not be construed as such. Always consult a trained financial professional before investing in cryptocurrencies, as the market is particularly volatile.


