


The price of Ripple’s XRP has lost the critical support line of a previous pattern. This puts the entire long-term bullish structure at risk.
The price action and Relative Strength Index (RSI) readings in multiple time frames support the continuing decrease. As a result, despite the ongoing bounce, the acceleration of the downward movement is the most likely future price scenario.
Even though there is no decisive news regarding the Ripple vs Securities and Exchange Commission (SEC) case, the former won a small victory when the judge presiding over the case denied a motion filed by the securities regulator.
There are drawbacks to the postponement of the case, mostly relating to Ripple’s ability to access its reserves and raise funds through its sale.
Ripple Price Loses Crucial Support Level
The XRP price has traded inside an ascending parallel channel since June 2022. The price action inside the pattern consists of numerous bounces between the resistance and support lines before an eventual breakdown. As a result, the ascending parallel channel is considered a bearish pattern.
As expected, the price was rejected by the channel’s resistance line on March 29, catalyzing the ongoing downward movement. Afterward, the price decreased below the $0.53 horizontal resistance, creating a lower high (red icon) in the process.
The breakdown below the channel’s midline (red circle) confirmed the bearish pattern. XRP has fallen toward the support line since.
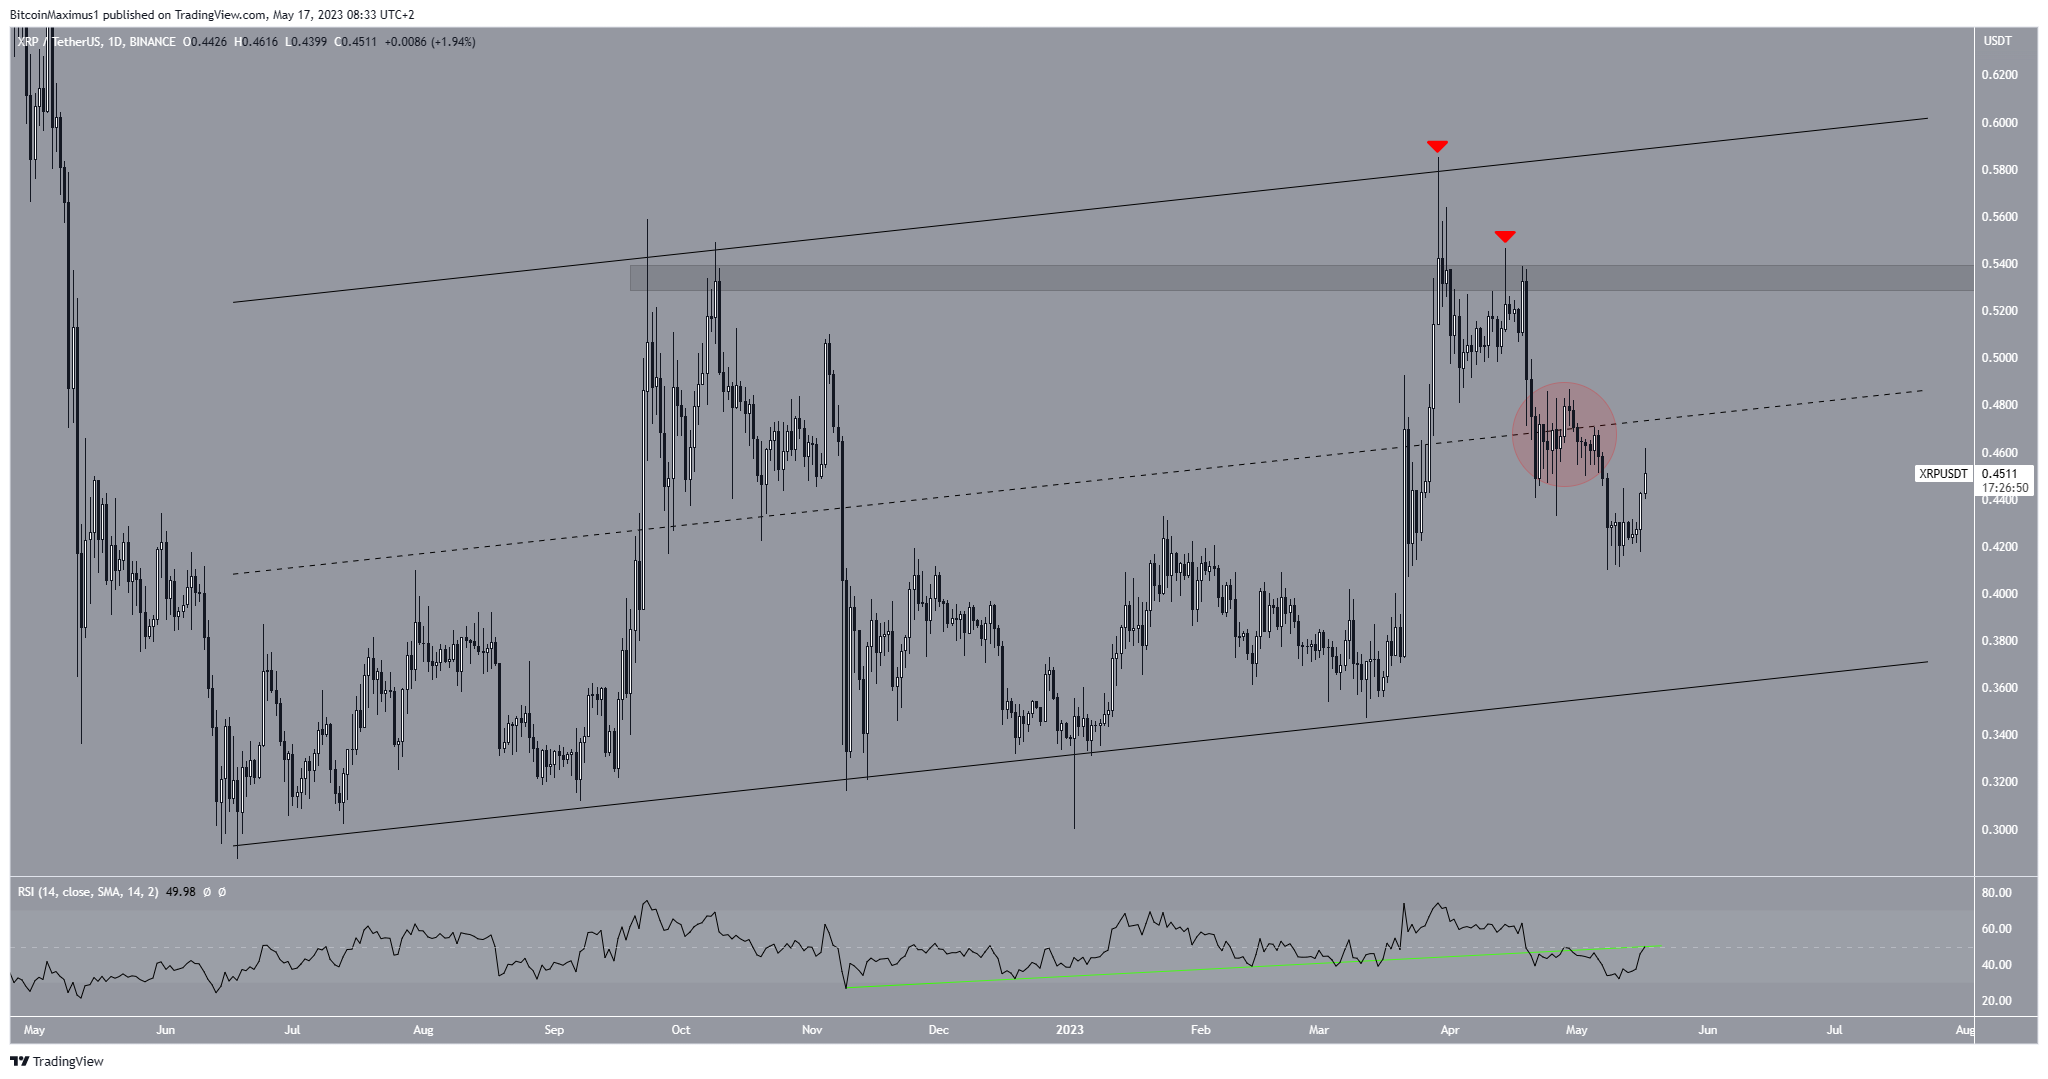
Moreover, the Relative Strength Index (RSI) is bearish. Traders utilize the RSI as a momentum indicator to assess whether a market is overbought or oversold, and to determine whether to accumulate or sell an asset.
If the RSI reading is above 50 and the trend is upward, bulls still have an advantage, but if the reading is below 50, the opposite is true.
When evaluating market conditions, traders use the RSI as a momentum indicator to determine whether a market is overbought or oversold and whether to accumulate or sell an asset.
The indicator shows two bearish signs. Firstly, it broke out from its previous support trendline (green line), and secondly, it is below 50 and falling.
XRP Price Prediction: How Long Will Bounce Continue?
The technical analysis from the short-term four-hour time frame suggests that despite the bounce, the decrease is expected to continue in the near future, providing a bearish XRP price forecast.
The main reason is the wave count, which supports the decrease. Technical analysts utilize the Elliott Wave theory to ascertain the trend’s direction by studying recurring long-term price patterns and investor behavior.
The wave count shows a completed five-wave downward movement. After the move, the XRP price began to bounce.
However, due to the preceding decrease, it is likely that the bounce is part of a corrective rally.
The most likely target for its top is between the 0.5-0.618 Fib retracement resistance levels at $0.50-$0.52. Afterward, the decrease could continue.
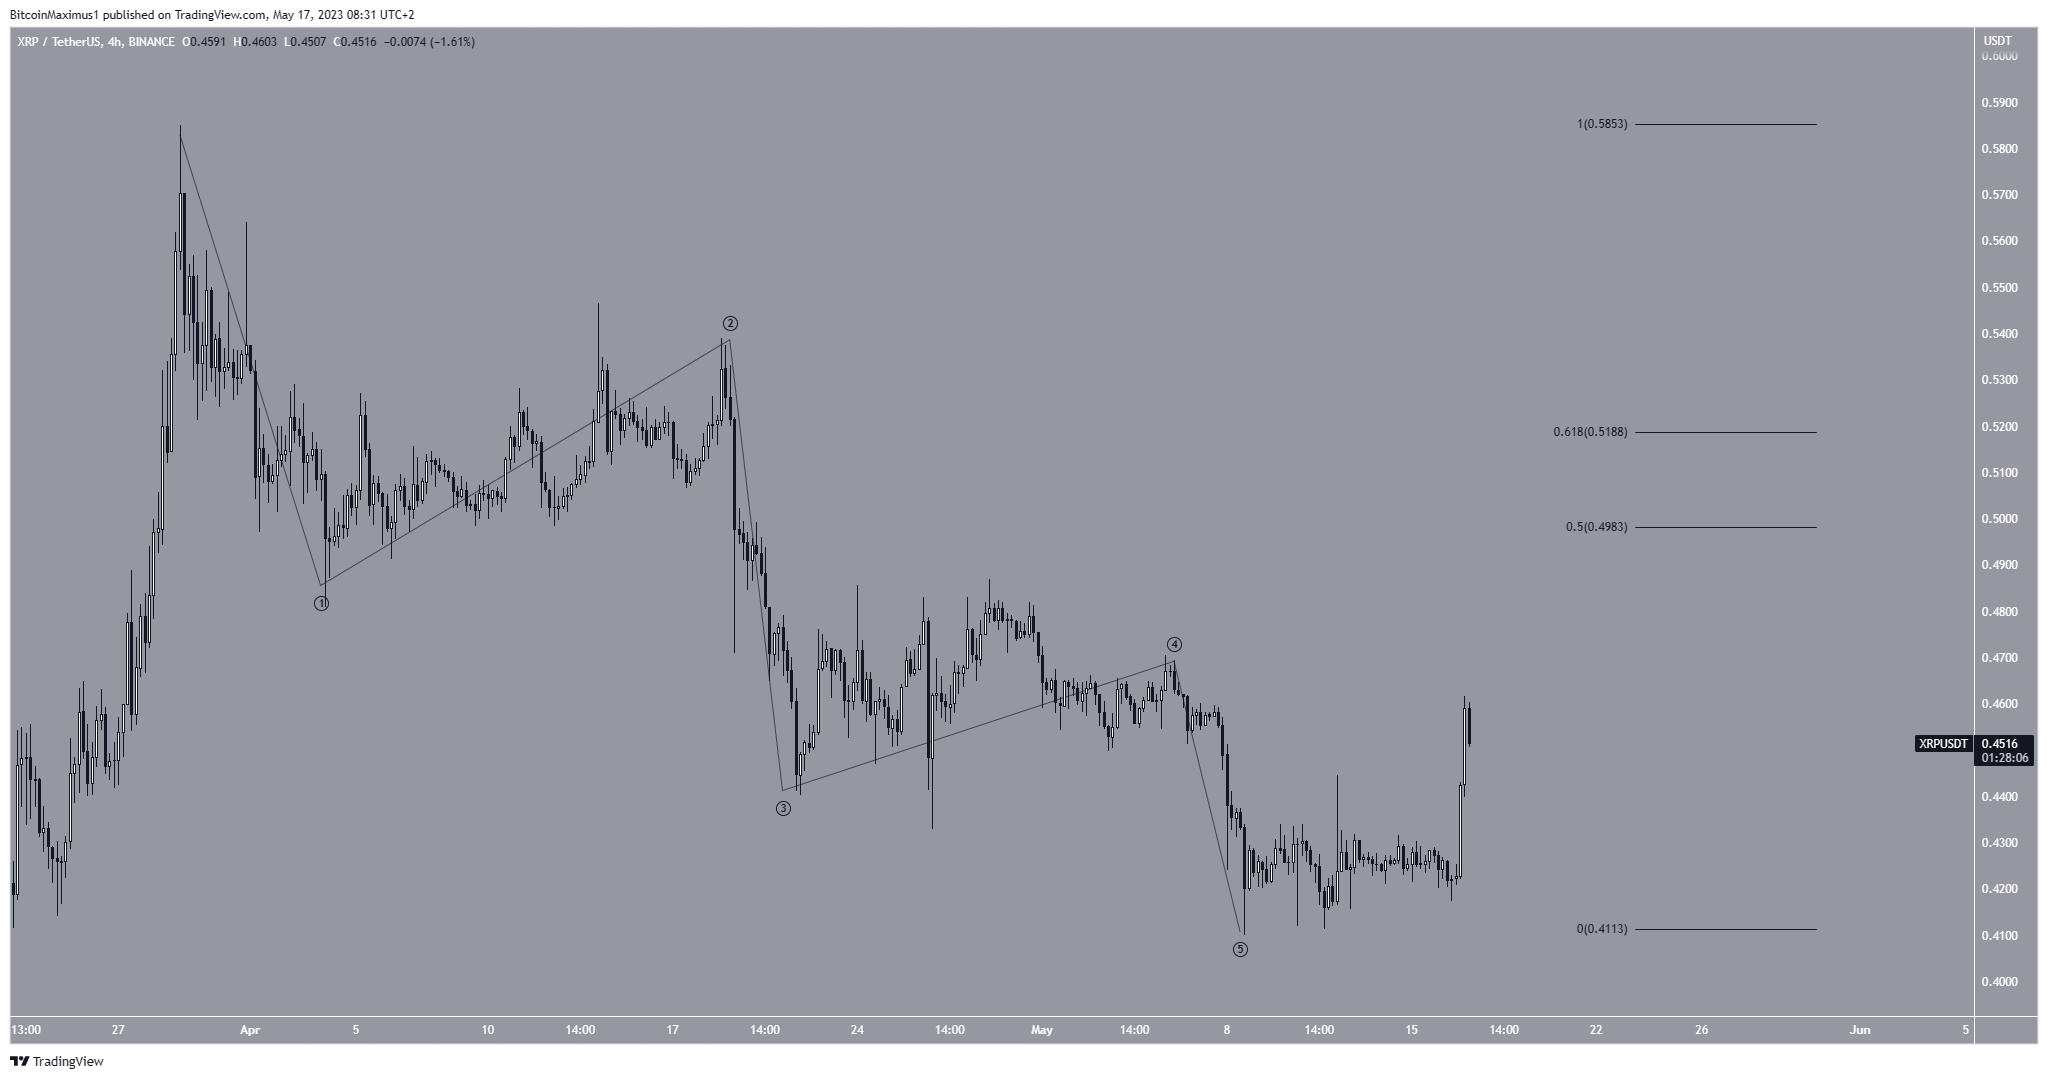
Despite this bullish short-term XRP price prediction, a fall below the wave 5 low at $0.41 will mean that the trend is still bearish.
In that case, a decrease to the channel’s support line at $0.36 will be the most likely scenario.
For BeInCrypto’s latest crypto market analysis, click here


