


On July 27, 2019, the XRP price reached a high of $0.49. A rapid decrease ensued. On July 5, the price made a low of $0.375. It has been increasing since.
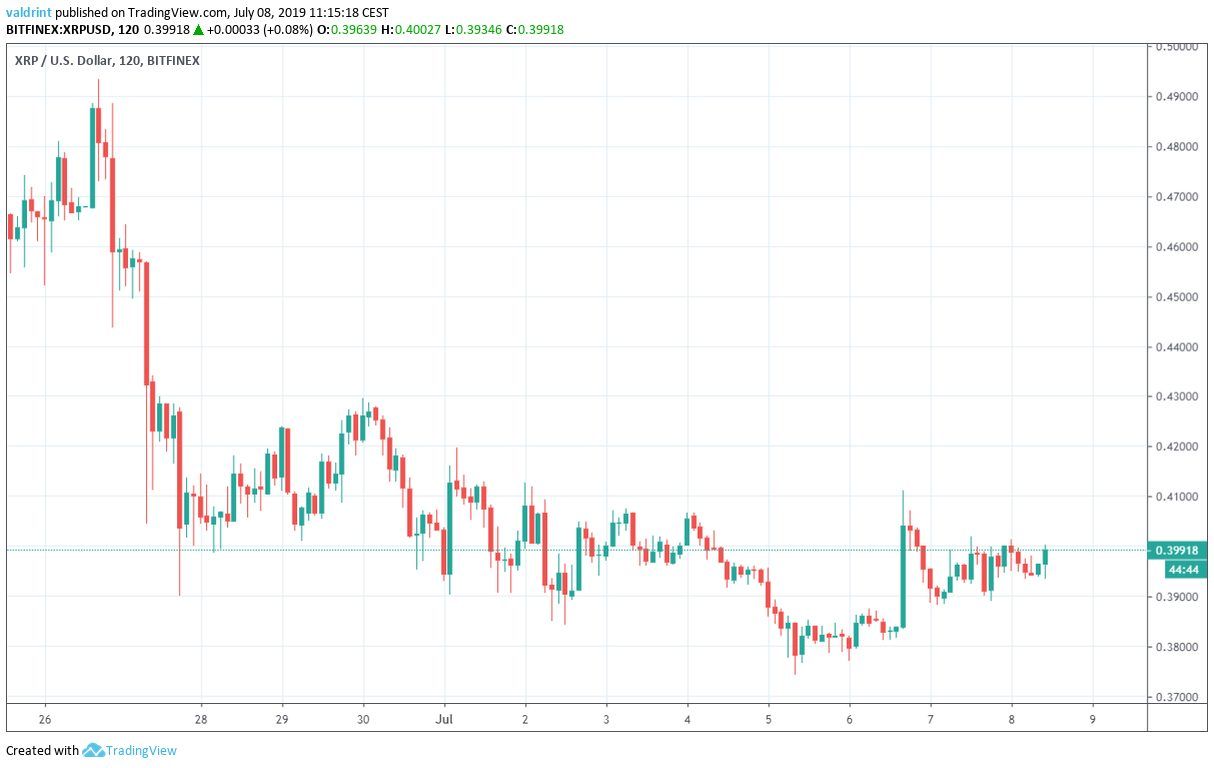
How long will this increase continue? In order to find the answer, keep reading below
For our previous analysis, click here.
If you would like to trade XRP on our partner exchange, follow this link to get all signed up on XCOEX.
XRP Price: Trends and Highlights for July 8
- The price broke out from a descending wedge.
- It is following an ascending support line.
- The daily moving averages are providing resistance.
- The RSI has generated bullish divergence.
- There is resistance near $0.43.
Previous XRP Price Movement
The XRP price has been trading in a descending wedge since June 28.
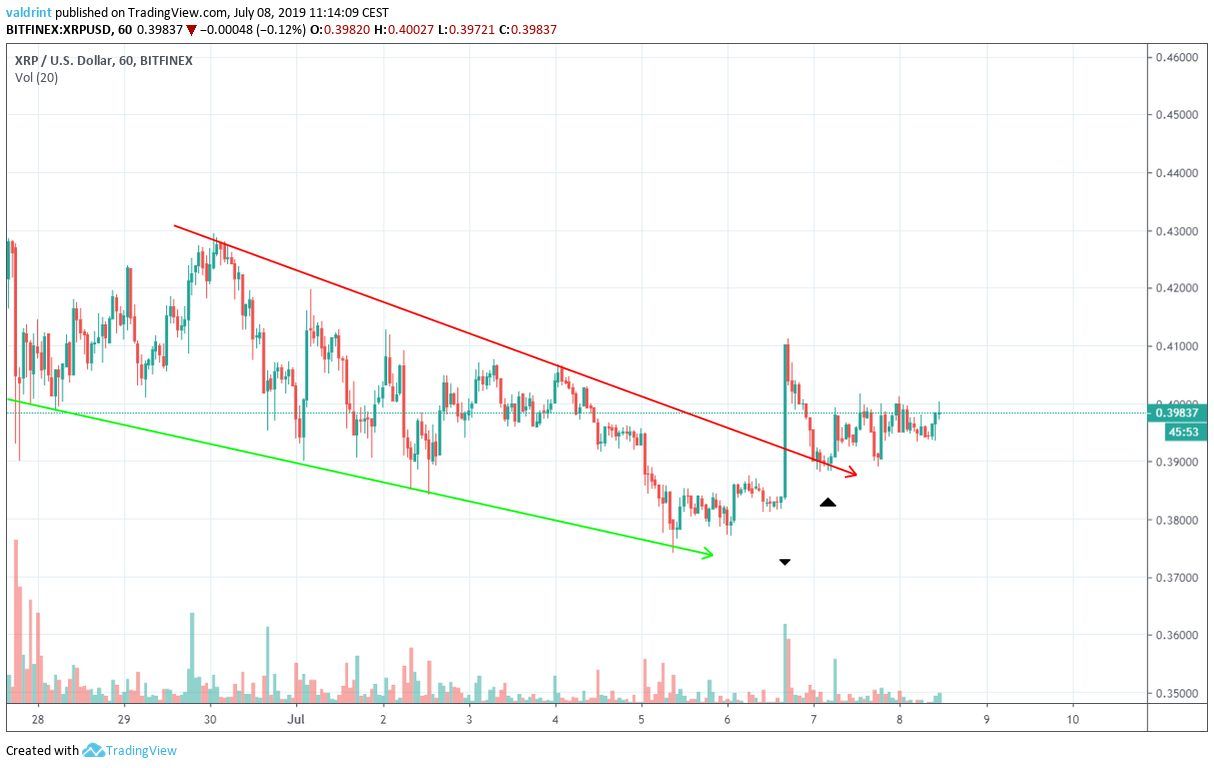
On July 6, a breakout occurred. It transpired with significant but not extreme volume.
Afterward, the XRP price decreased and touched the resistance line of the wedge.
Since then, the price has been following the ascending support line outlined below:
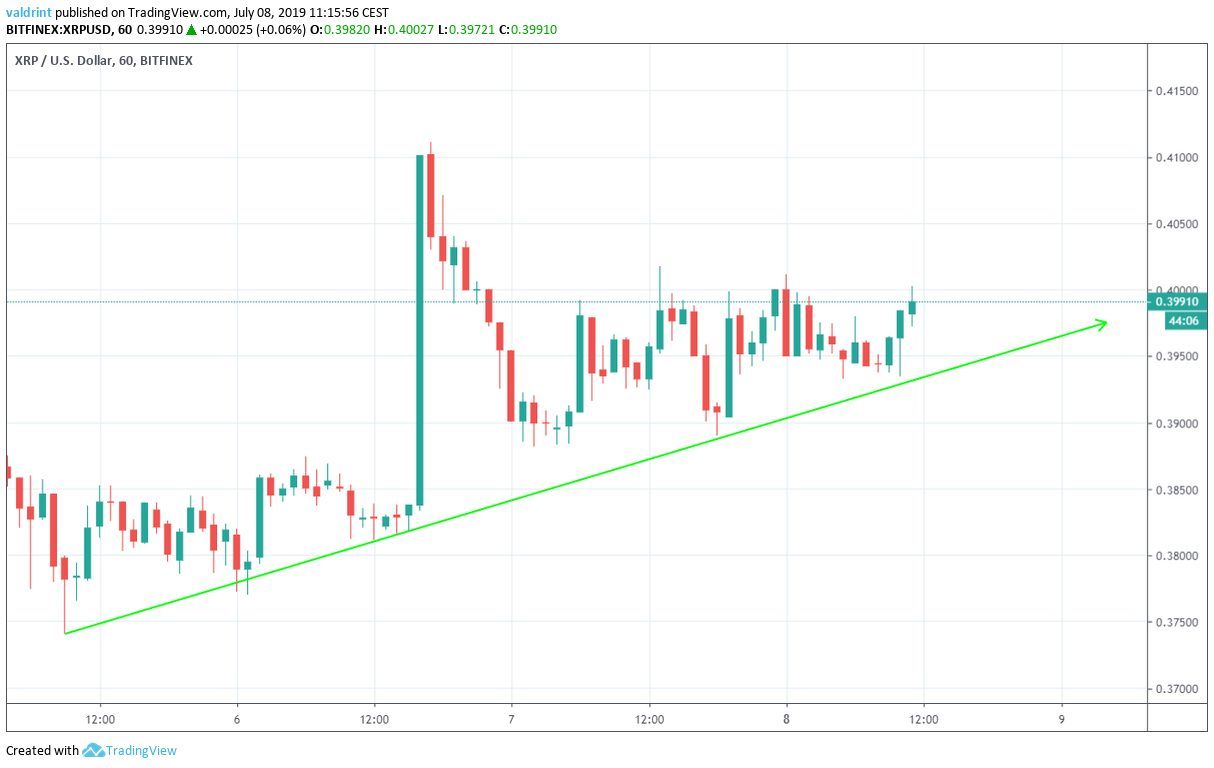
Will the price continue to increase at the rate predicted by the line?
Ascending Support
A look at the daily time-frame shows that the price is also following an ascending resistance line in the long-term.
It has been doing so since reaching a low of $0.36 on May 17.
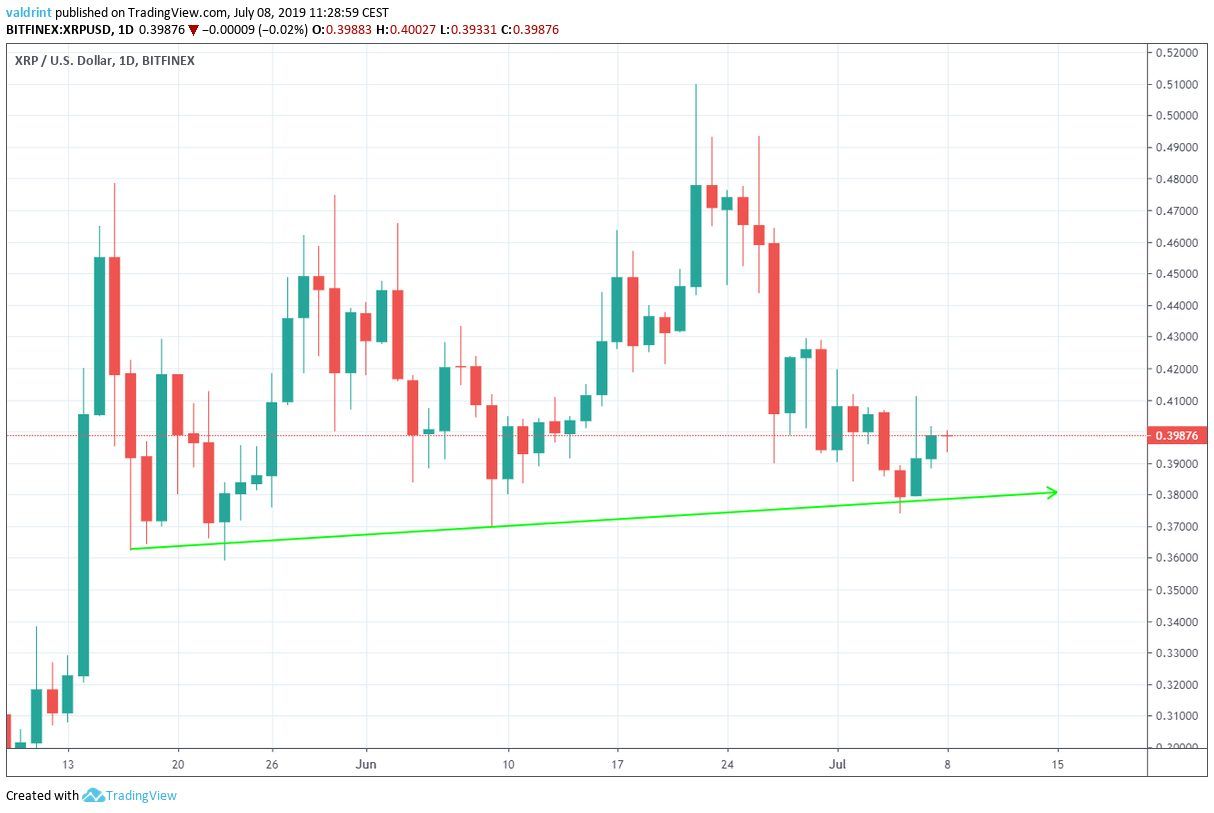
The XRP price touched the support line for the fourth time on July 5.
This coincided with the aforementioned low inside the descending wedge.
Afterward, the price began to increase.
Technical Indicators
A bearish cross between the 10- and 20-day MAs transpired on July 2.
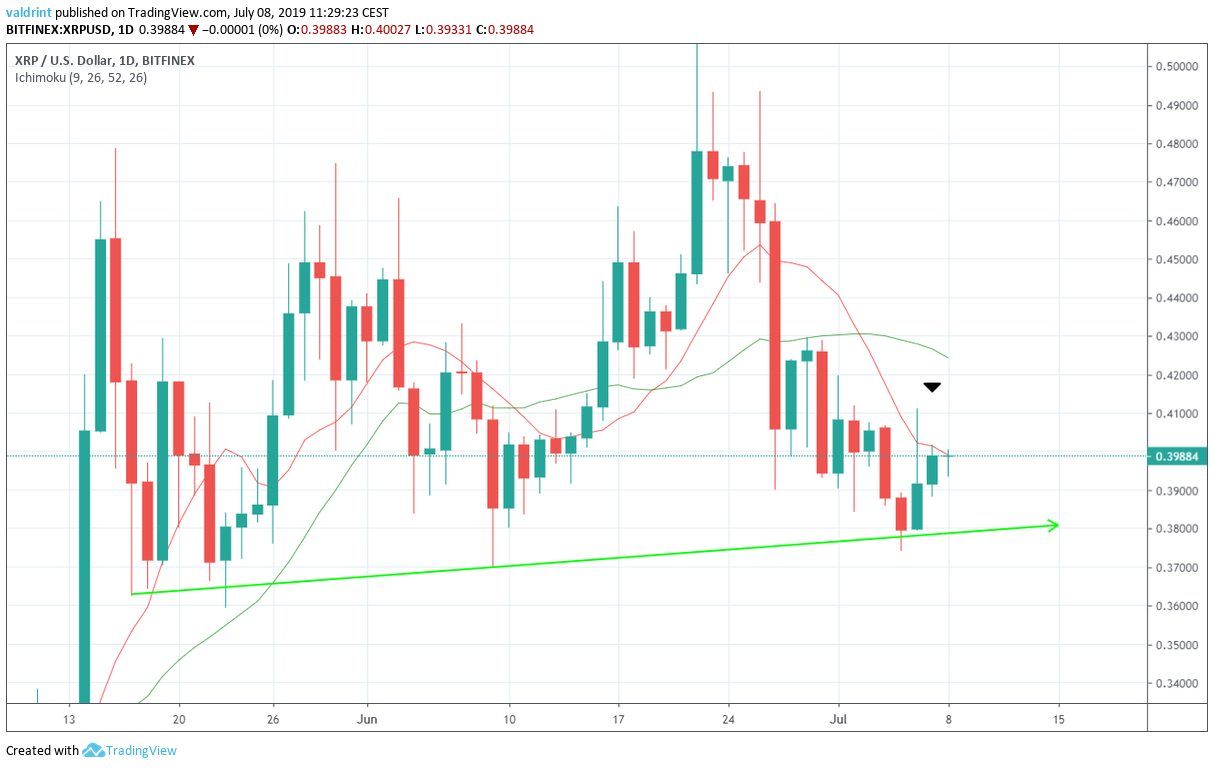
Since then, the XRP price has been trading below both MAs, facing very close resistance from the 10-day one.
On July 6, it made an attempt at a breakout but was immediately pushed down.
A look at the RSI gives a more positive outlook.
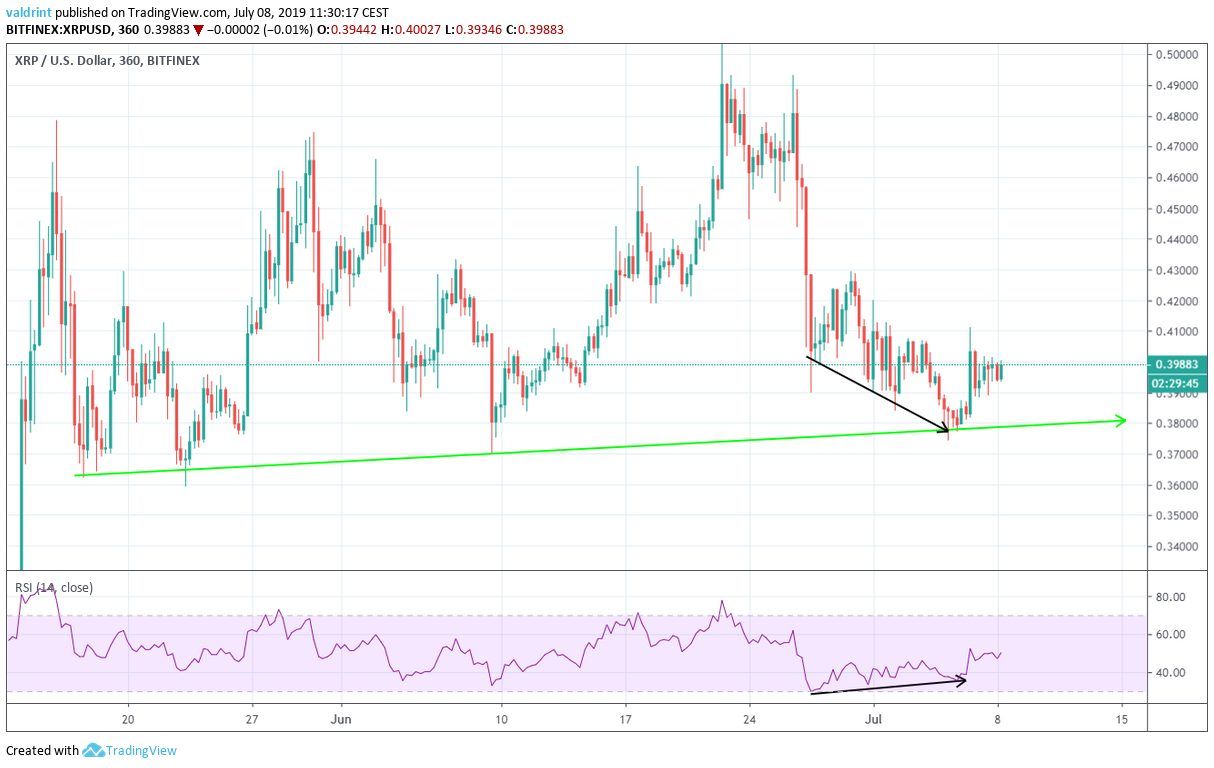
It has been generating bullish divergence since June 26, which preceded the breakout from the wedge.
However, the divergence is not present in longer-term time-frames such as the daily time-frame.
Therefore, it is likely that the breakout and the possible ensuing increase is a response to the rapid price drop on July 26 and not the beginning of a new uptrend.
If that is the case, where will the price find resistance?
Reversal Areas
One resistance area is traced for XRP/USD below:
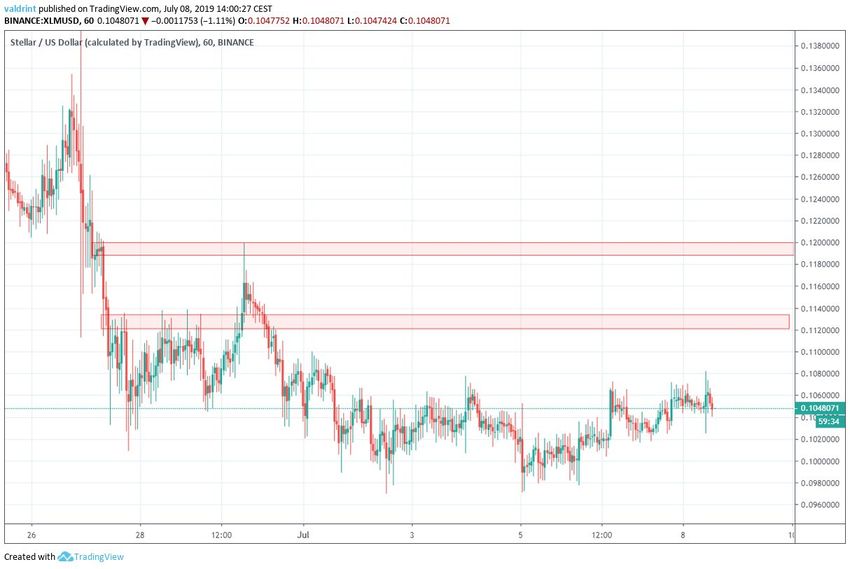
The closest resistance area is found near $0.43.
According to our analysis, it is likely that the XRP price will reach this area.
If it does, we will again look at XRP to see if further increases are likely or if the area will initiate a reversal.
Summary
The XRP price recently broke out from a descending wedge. It is currently following an ascending support line.
Daily moving averages indicate that there is significant resistance above the price.
The RSI supports an upward move towards the resistance area outlined above.
Do you think the XRP price will reach the resistance area outlined above? Let us know in the comments below.
Disclaimer: This article is not trading advice and should not be construed as such. Always consult a trained financial professional before investing in cryptocurrencies, as the market is particularly volatile.
Images are courtesy of Shutterstock, TradingView.


