


On July 11, 2019, the XRP price reached a low of 2777 satoshis. An upward move ensued. On July 18, it reached a high of 3345 satoshis. After a slight decrease, it reached similar levels on July 30. It has been decreasing since.
How long will XRP continue to decrease? In order to answer this question, we will analyze the XRP price in different time-frames alongside technical indicators.
For our previous analysis click here.
Looking to easily trade XRP (XRP) and other cryptocurrencies with a quick signup via our partner exchange? Follow this link to get a free Xcoex account!
XRP Price: Trends and Highlights for August 1
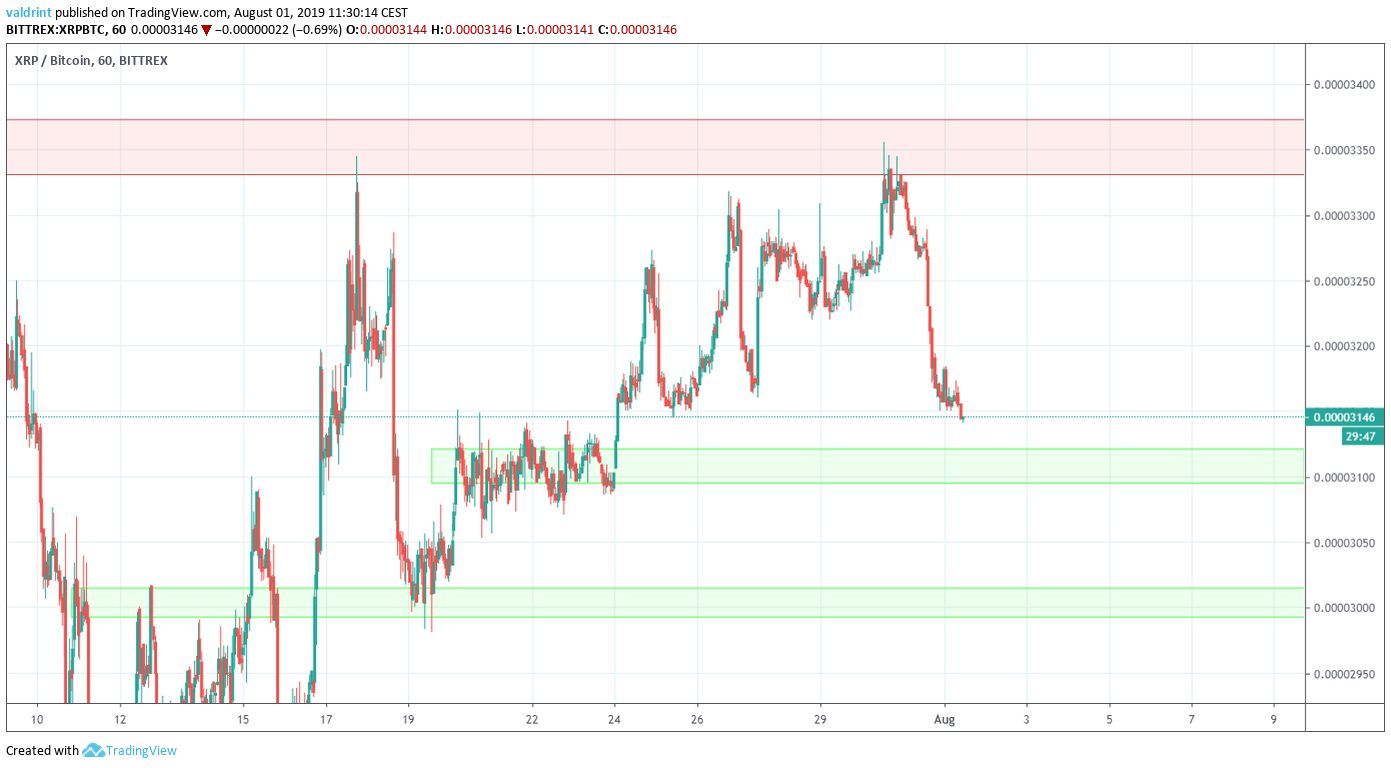
- XRP/BTC broke down from an ascending triangle.
- There is resistance near 3350 satoshis.
- There is support at 3100 and 3000 satoshis.
- XRP has found support above the 20-day moving average.
Previous Pattern
Since reaching a low on July 11, XRP has been trading inside the ascending triangle outlined below.
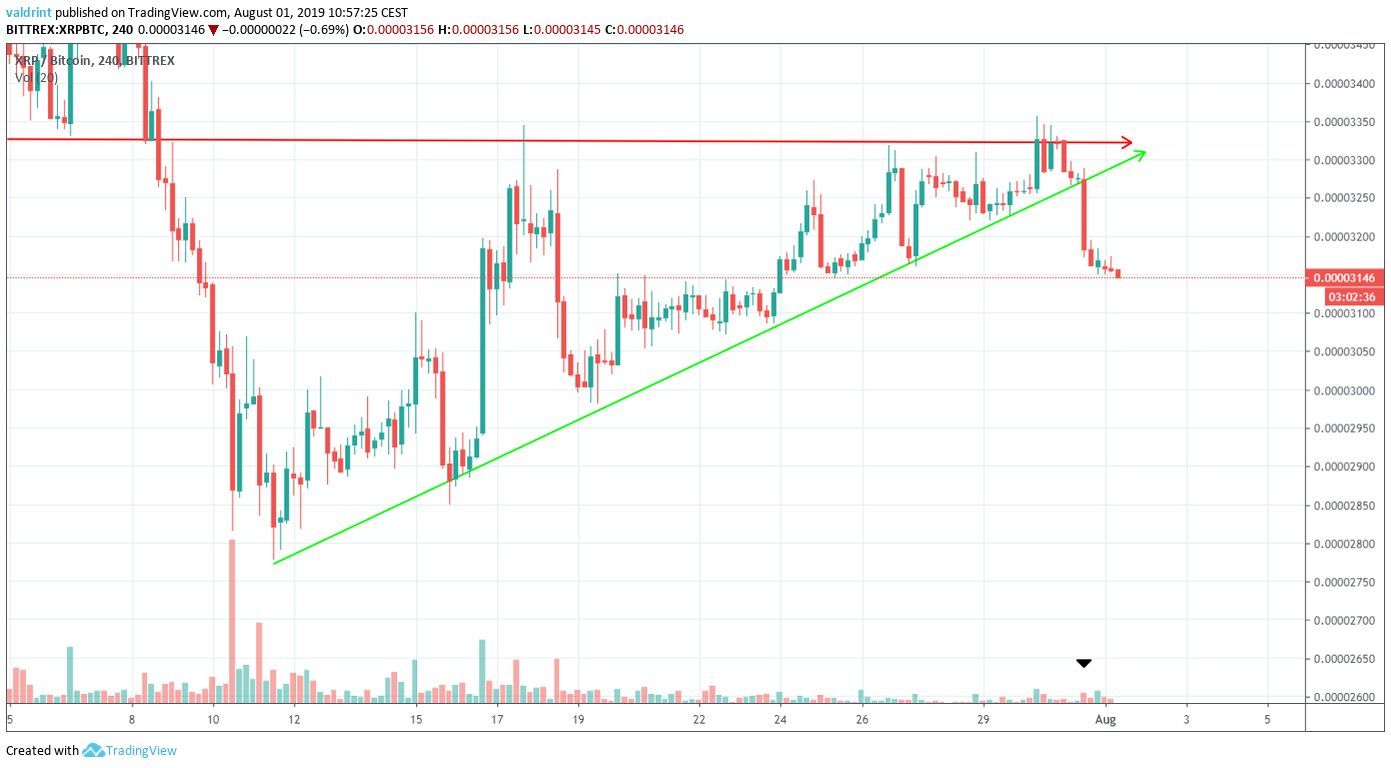
On July 30, the XRP price broke down from the triangle.
The breakdown transpired with low volume, reducing its significance.
Will the price rebound?
Daily Outlook
A look at the daily time-frame gives us two notions:
- There is a resistance area at 3350 satoshis.
- Yesterday’s candle is akin to the first candle of a reversal.
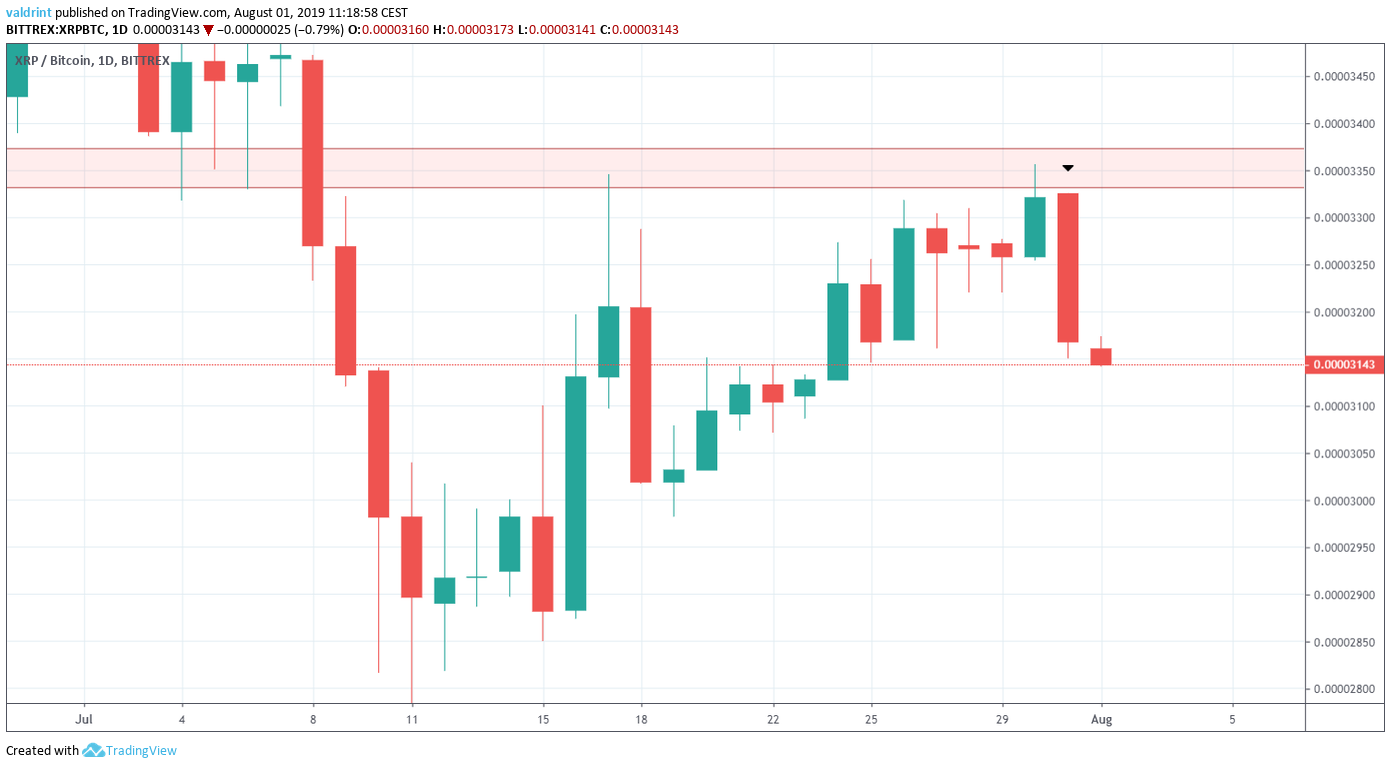
The price first reached the resistance area on July 17, before immediately increasing.
It did so again on July 30. Likewise, a decrease followed.
The candle for July 31 was a bearish engulfing one.
Besides the low volume, it has the characteristics of the first candle of a reversal.
A look at the moving averages (MA) gives us a possible reversal sign.
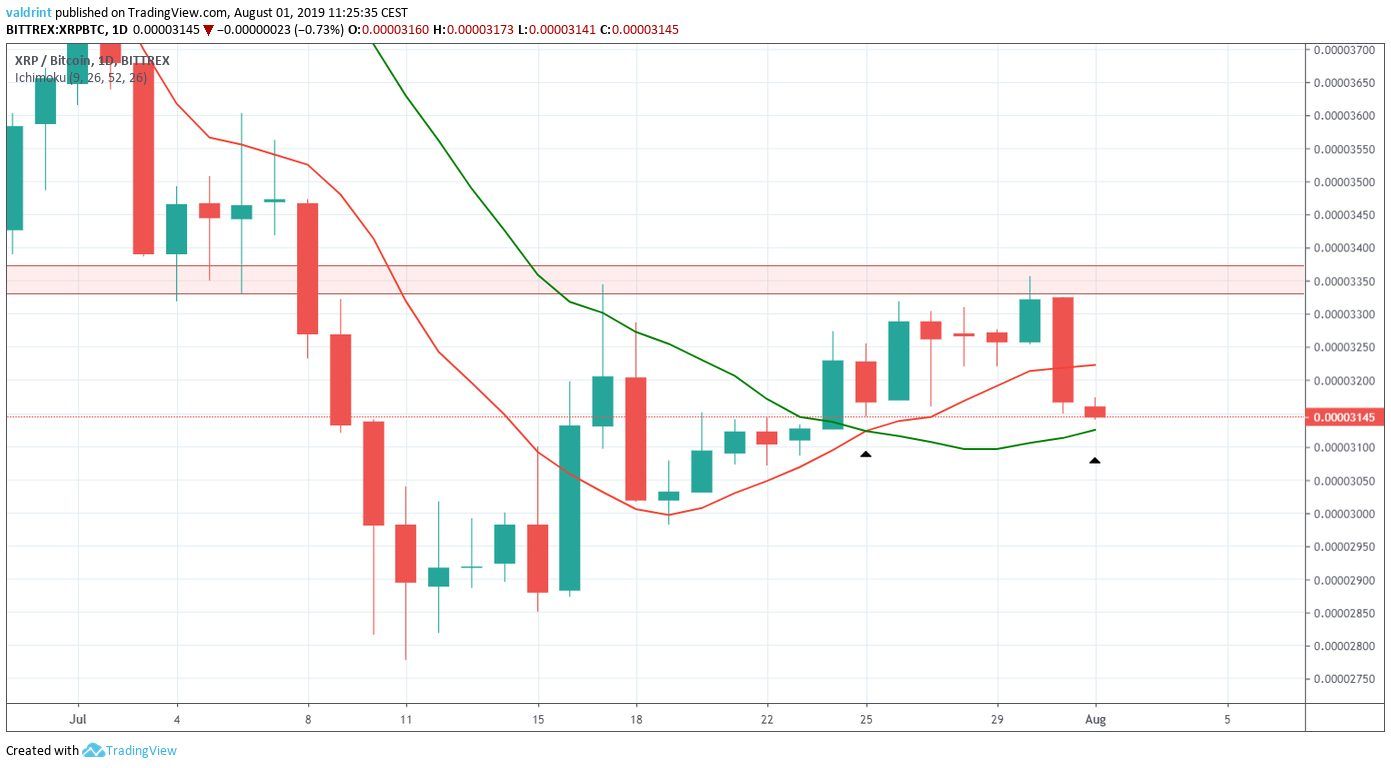
The 10- and 20-day MAs made a bullish cross on July 25.
The XRP price traded above both until July 31.
The recent decrease took the price right to the 20-day MA, which is possibly providing support.
It previously acted as resistance on July 17 and as support on July 14.
It would not be surprising if the price bounces from it.
Let’s go back to a shorter time-frame to see if that is likely.
Possible Reversal
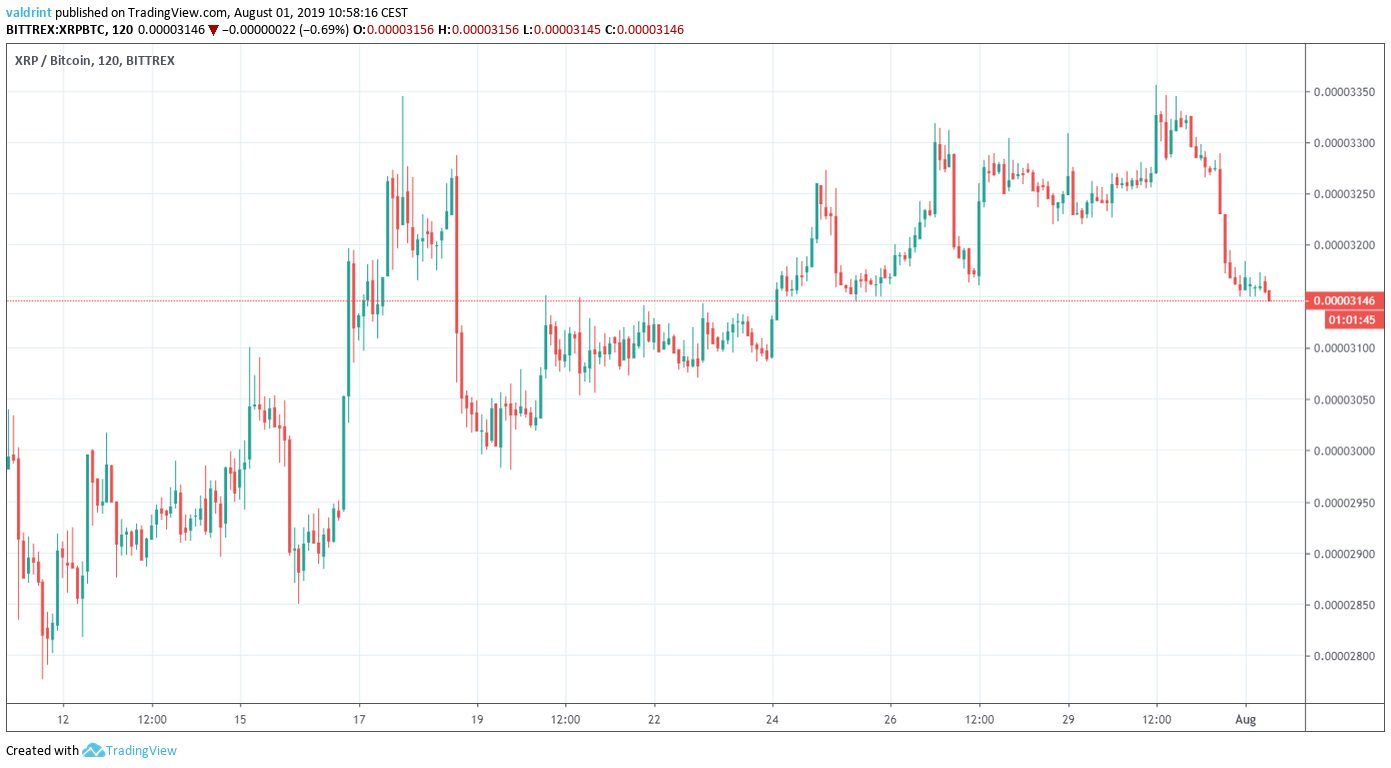
In order to better visualize possible reversal areas, we have gone back to the hourly time-frame.
We can see that there are two support areas, found at 31000 and 3000 satoshis respectively.
Furthermore, we can see that there is some bullish divergence developing in the RSI.
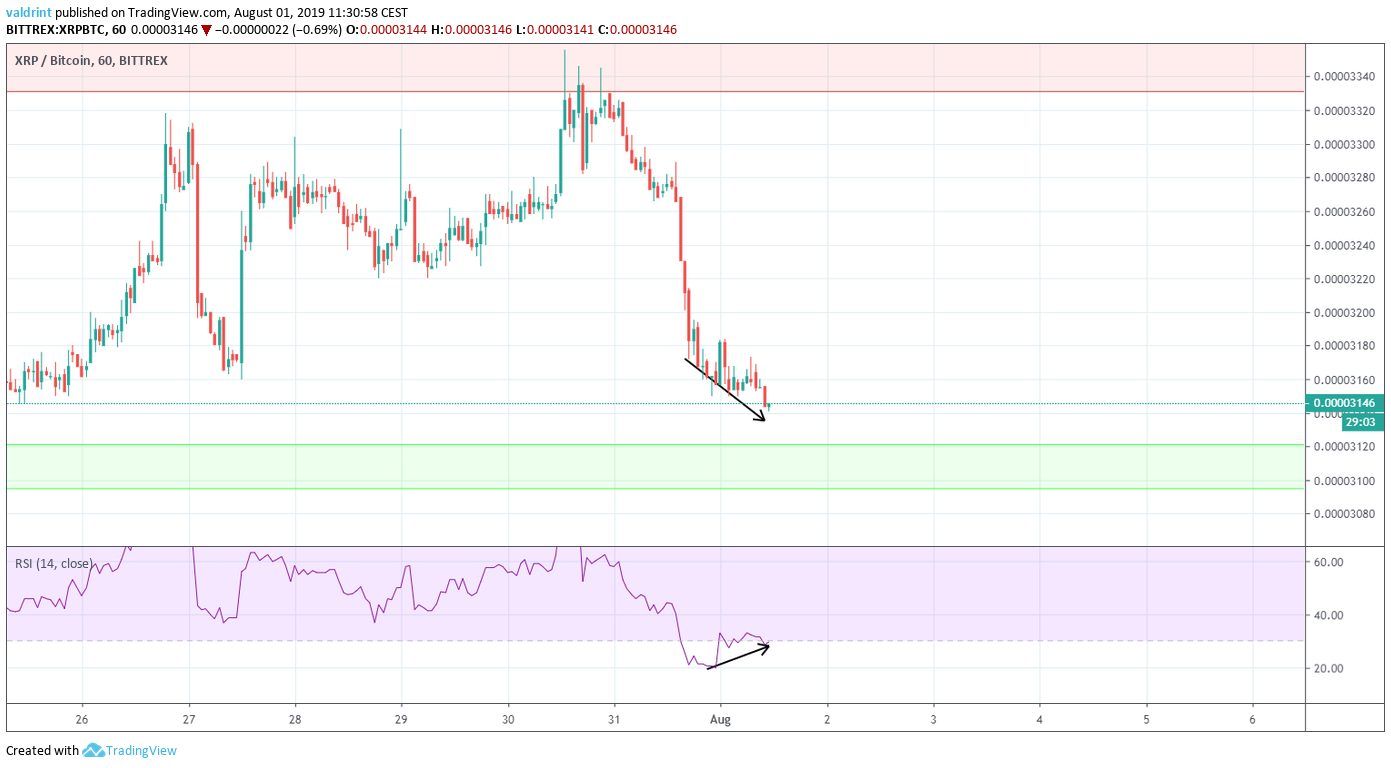
While not present in longer time-frames, it gains significance since it is occurring very close to a support area.
Therefore, we would expect the XRP price to reach the support area at 3100 satoshis before beginning to increase.
While an immediate decrease towards 3000 satoshis is possible, it seems unlikely at the current time.
XRP Price Summary
The XRP price recently broke down from an ascending triangle.
According to our analysis, it is likely to reach the support area outlined above, before beginning to increase.
Do you think XRP will reach the support area? Let us know in the comments below.
Disclaimer: This article is not trading advice and should not be construed as such. Always consult a trained financial professional before investing in cryptocurrencies, as the market is particularly volatile.
Images are courtesy of TradingView, Shutterstock.


