The Chainlink (LINK) price is very close to reaching an all-time high. However, technical indicators show considerable weakness, putting doubt in the possibility of a breakout.
LINK/BTC
The LINK price is currently trading inside a very strong resistance area at 54,000 satoshis, inside which it has formed a triple top pattern. The two previous tops took place in March and April. Furthermore, the price has been following a curved ascending support line since its inception. The line is very close to matching up with the previous resistance area. Technical indicators are bearish since there are multiple divergences on the weekly RSI. The volume has been declining heavily since the first top. Therefore, it’s more likely that LINK breaks down from the curved support line instead of breaking out above resistance. If it does break down, then the price could decline all the way to the next major support area at 35,000 satoshis.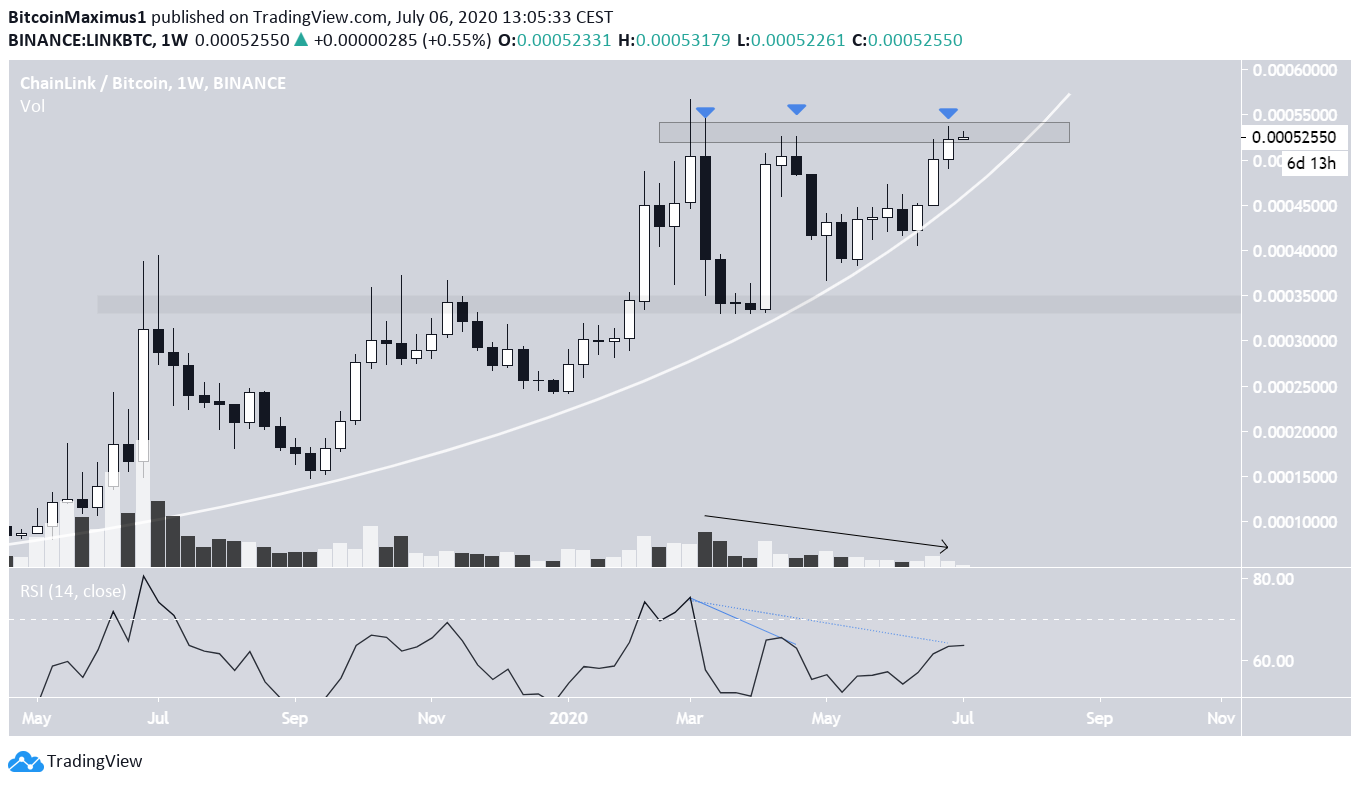

LINK/USD
The LINK/USD chart shows a relatively similar but not identical movement. The price has been trading inside a parallel rising channel since June 2019. Similar to the LINK/BTC pair, there are multiple bearish divergences on the weekly RSI, and the volume has been gradually decreasing throughout this entire upward move.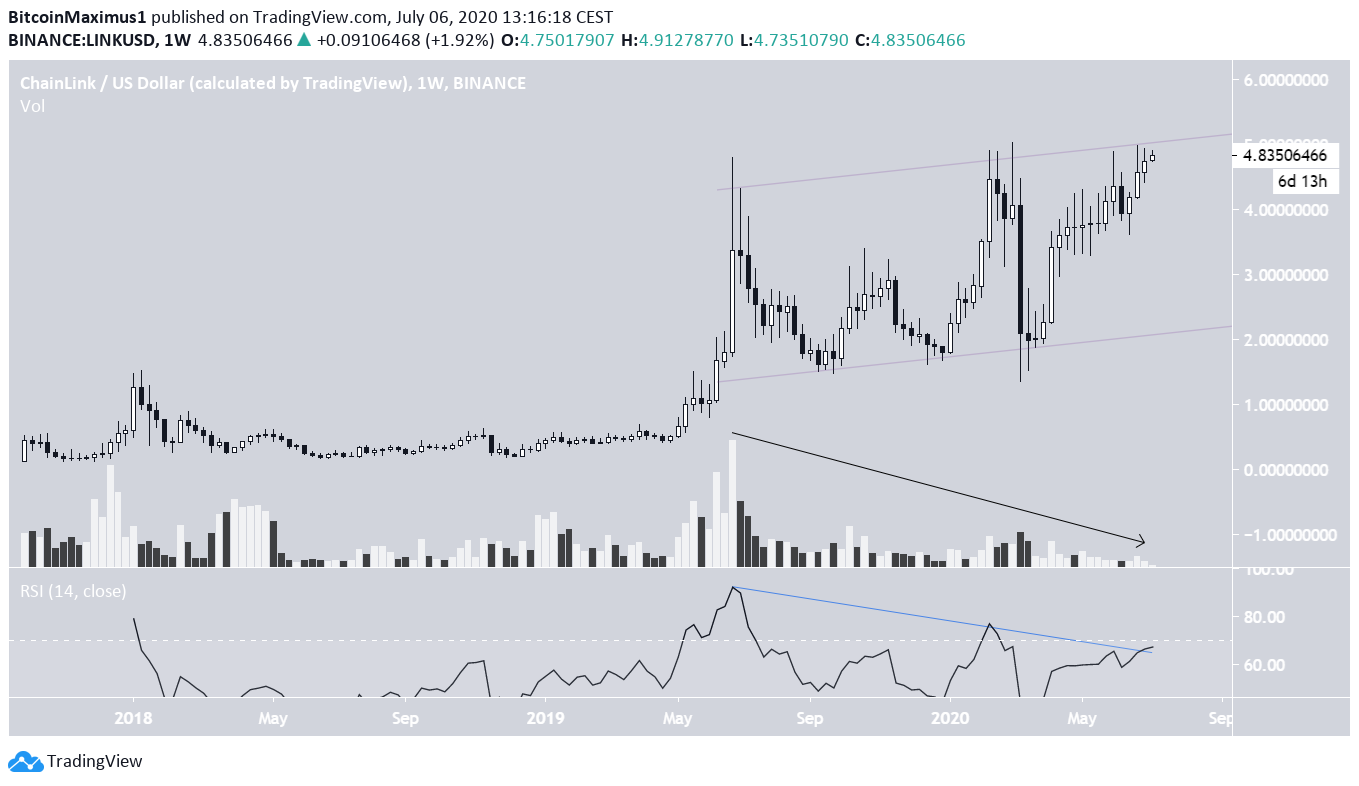
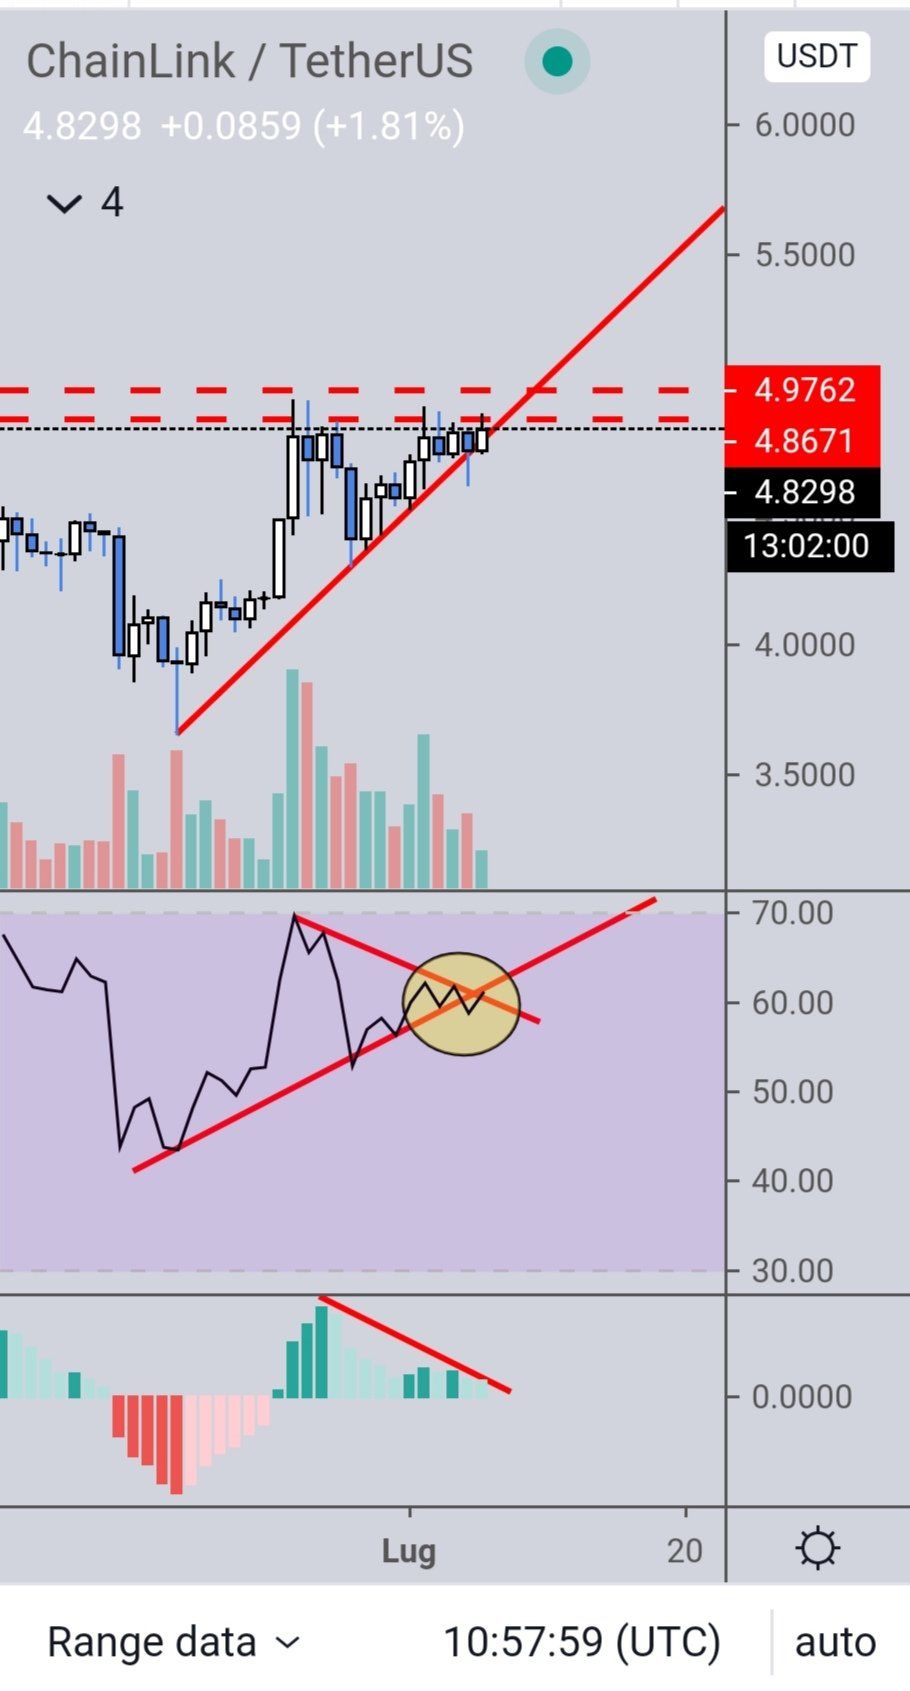
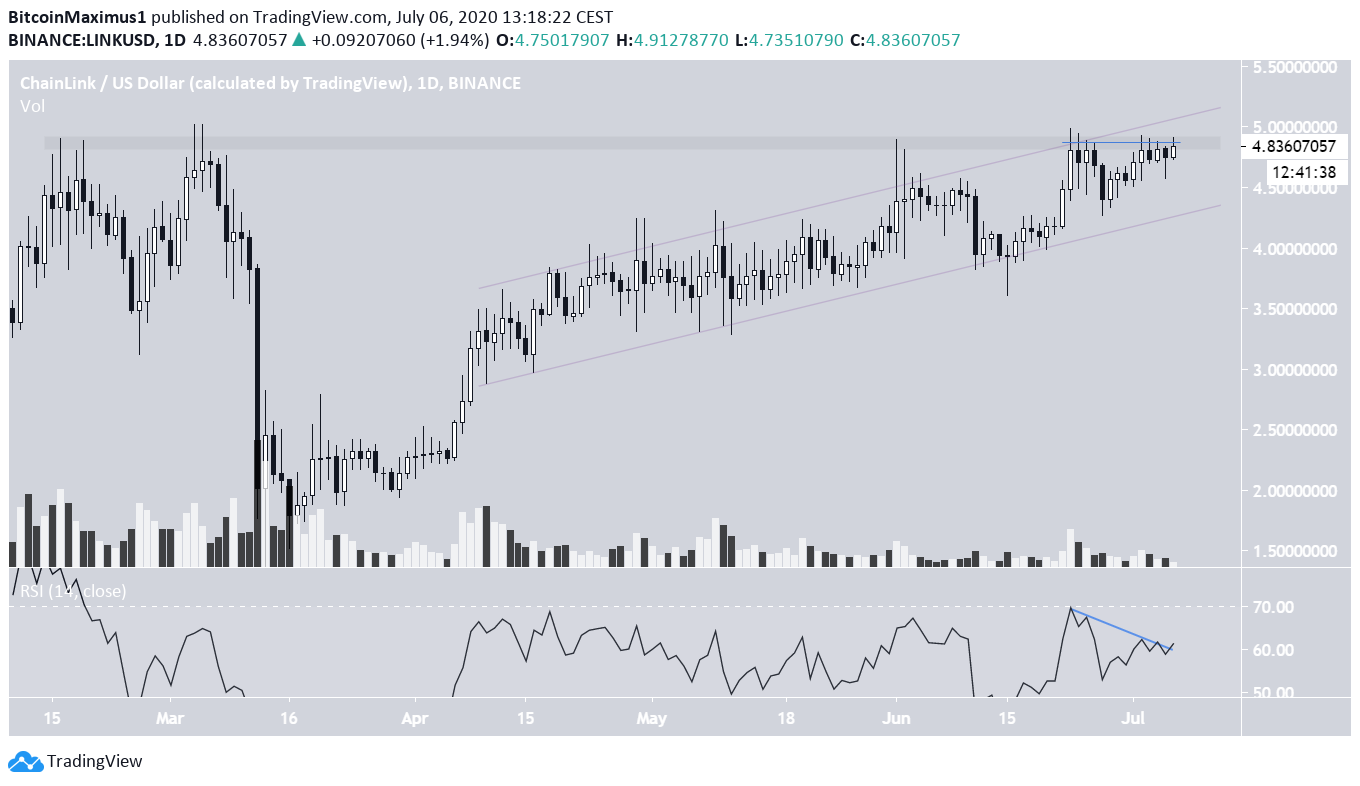 Cryptocurrency trader @Walter_Wyckoff also has a bearish view. He explains that he is entering a short since the RSI has also broken down from an ascending support line.
Top crypto projects in the US | May 2024
Trusted
Disclaimer
In line with the Trust Project guidelines, this price analysis article is for informational purposes only and should not be considered financial or investment advice. BeInCrypto is committed to accurate, unbiased reporting, but market conditions are subject to change without notice. Always conduct your own research and consult with a professional before making any financial decisions. Please note that our Terms and Conditions, Privacy Policy, and Disclaimers have been updated.

Valdrin Tahiri
Valdrin discovered cryptocurrencies while he was getting his MSc in Financial Markets from the Barcelona School of Economics. Shortly after graduating, he began writing for several different cryptocurrency related websites as a freelancer before eventually taking on the role of BeInCrypto's Senior Analyst.
(I do not have a discord and will not contact you first there. Beware of scammers)
READ FULL BIO
Sponsored
Sponsored