

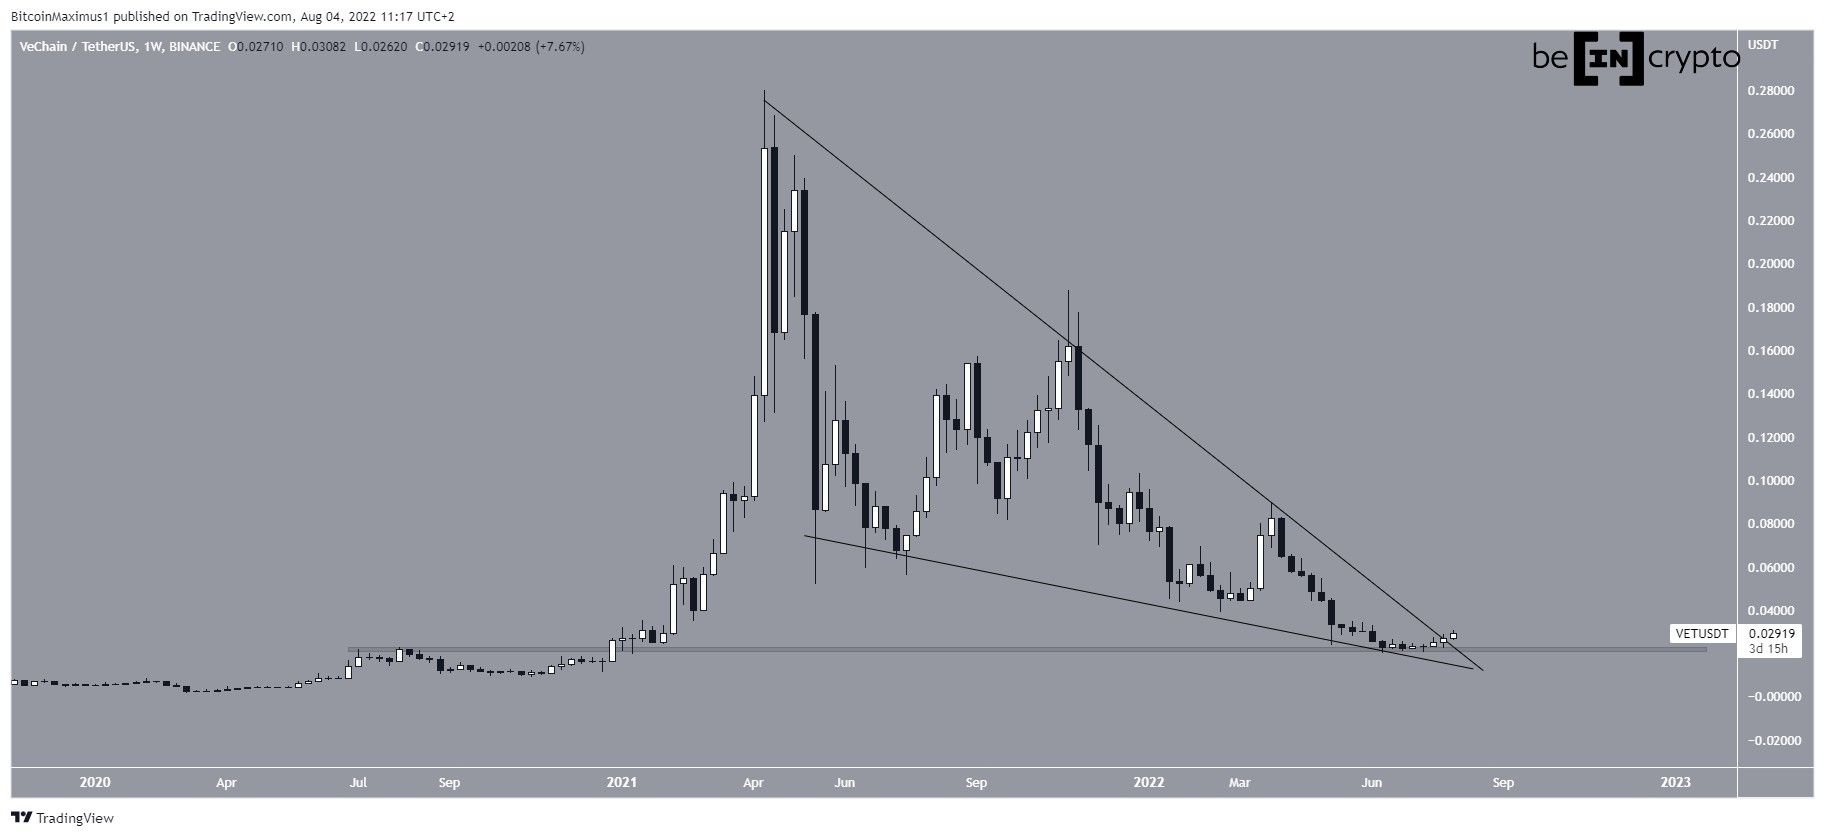
VeChain (VET) is in the process of breaking out from a long-term descending wedge. The wave count suggests a bottom has been reached.
VET has been falling since reaching an all-time high price of $0.279 in April 2021. The downward movement has been contained inside a descending wedge, which is considered a bullish pattern.
The decrease led to a low of $0.02 in June, before the price bounced and initiated the current upward movement. The bounce transpired after the price bounced at the $0.0215 horizontal area.
This is an important area since it previously acted as resistance from June to Dec 2021. Therefore, it has now seemingly turned to support.
While the exact line of the slope cannot be accurately determined due to the presence of several long upper wicks, it seems that VeChain is in the process of breaking out.
If true, this would likely lead to a significant upward movement, since the wedge has been in place for 370 days.
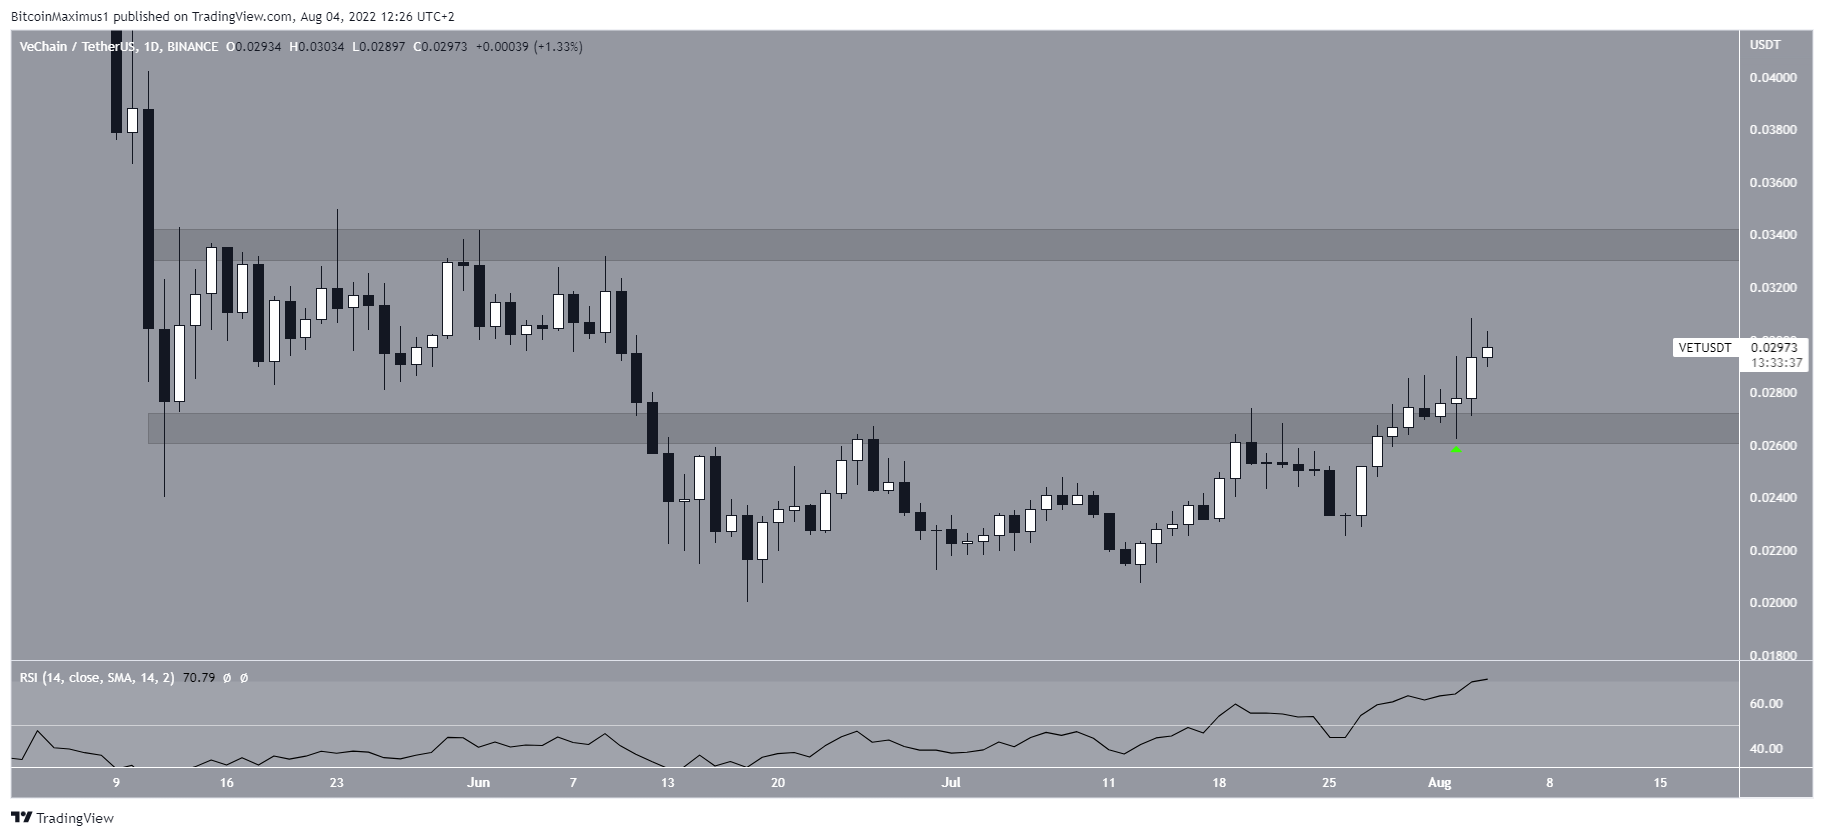
VET trading range
The daily chart provides a relatively bullish outlook. VET has broken out from the $0.0265 resistance area and validated it as support afterwards (green icon).
Alongside the breakout, the daily RSI has moved above 50 and is still increasing. This supports the possibility that the upward movement will continue. If so, the closest resistance area would be at $0.0337.
If the price reaches this area, it would mean that it has definitively broken out from the long-term wedge, hence indicating that the long-term trend is bullish.
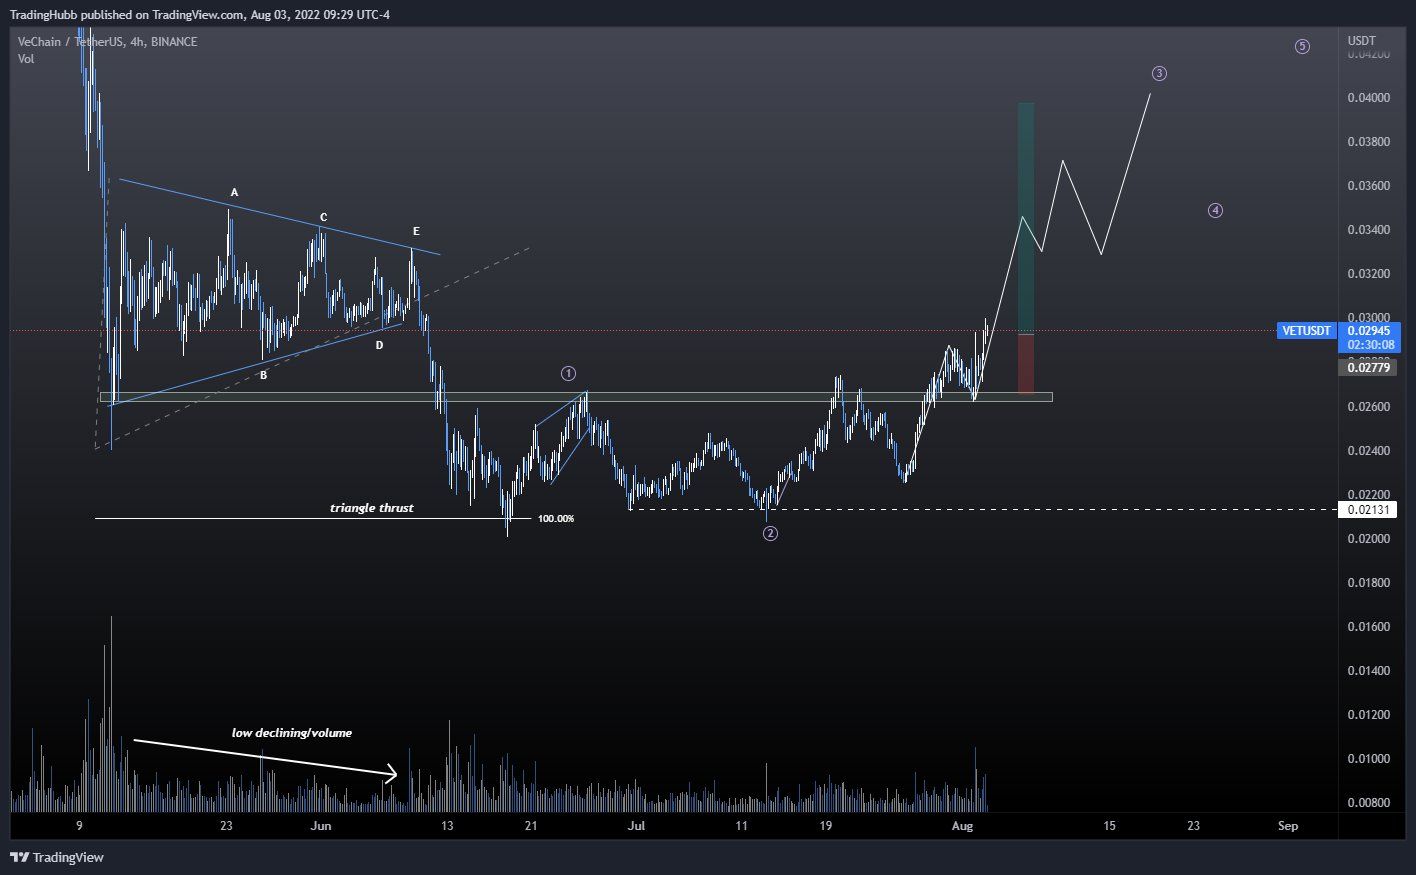
Wave count analysis
Cryptocurrency trader @Thetradinghubb tweeted a chart of VET, stating that the price has possibly begun a long-term bullish wave three.
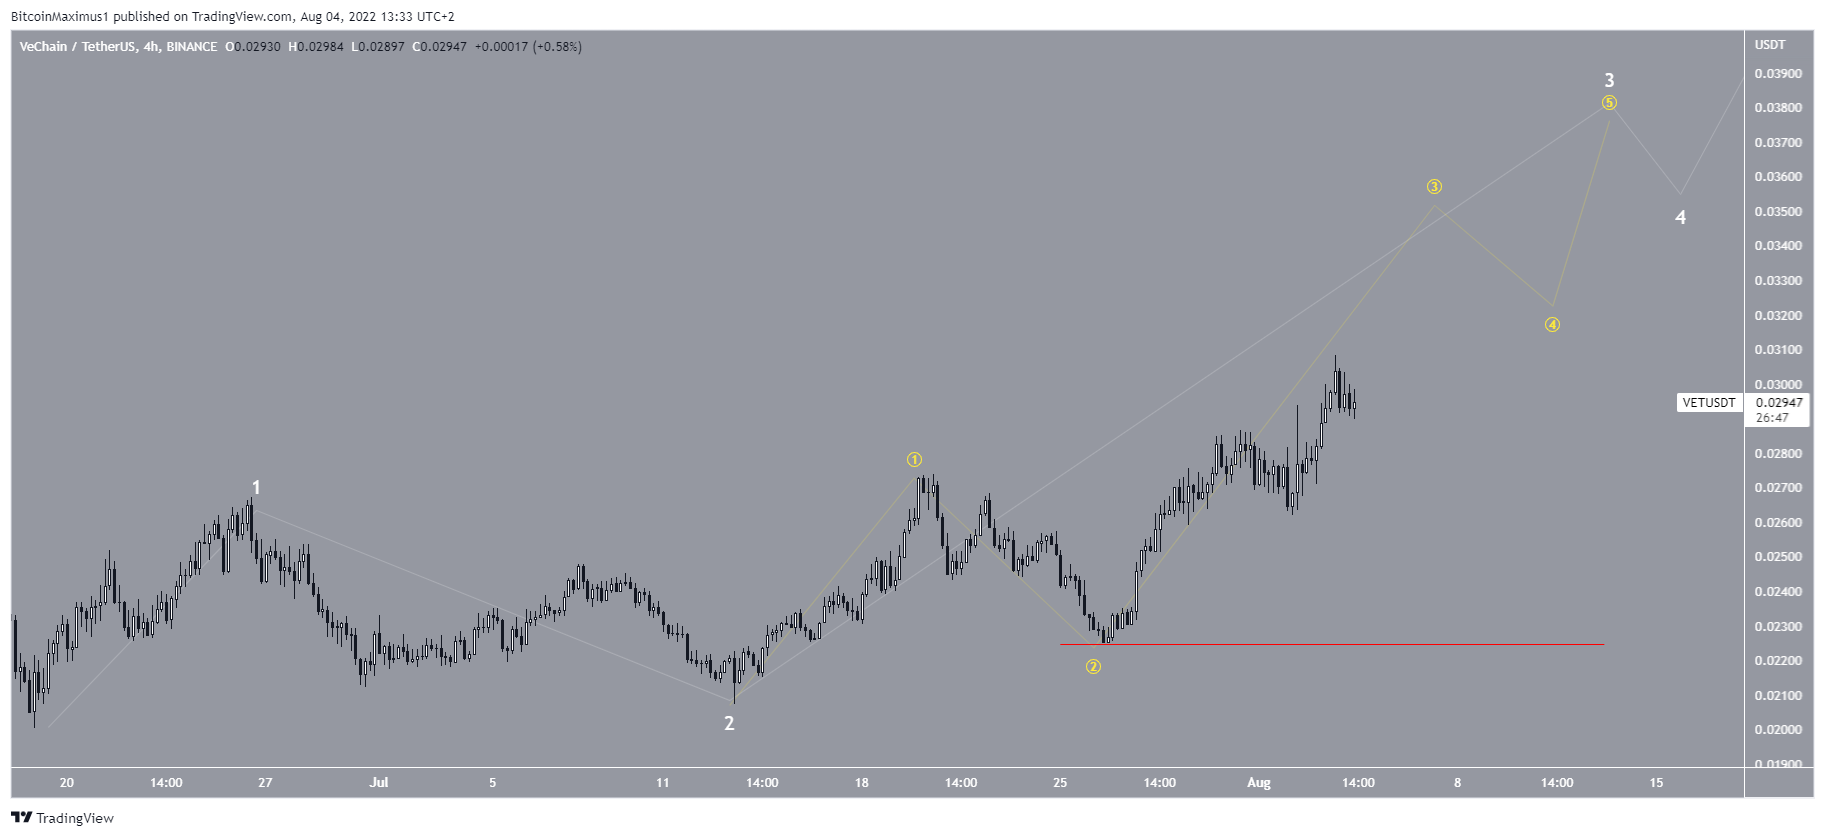
The short-term count does suggest that VET could be in wave three (white) of a five-wave upward movement that began in June. The sub-wave count is given in yellow, showing a potential 1-2/1-2 wave count.
If correct, it would mean that a very sharp upward movement is expected to follow.
Conversely, a decrease below the sub-wave two low (red line) at $0.0225 would invalidate this particular wave count.
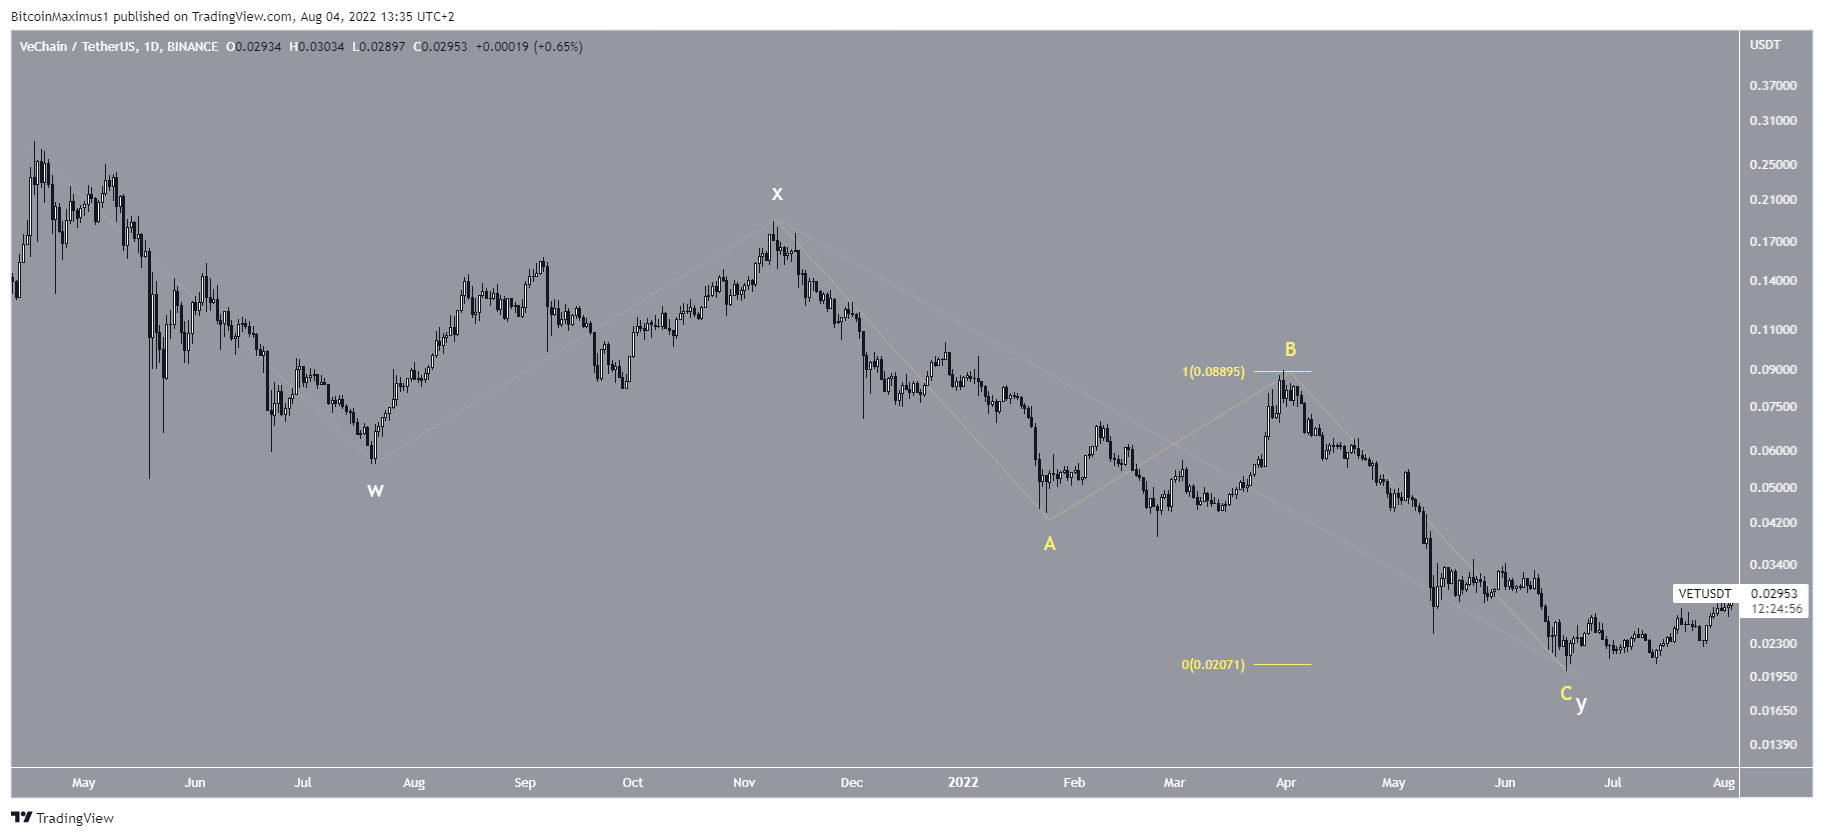
The long-term count also aligns with this reading, since it shows a potentially completed W-X-Y structure (white) when measuring from the all-time high.
In it, the A:C sub-waves (yellow) have had an exactly 1:1 ratio, supporting the possibility that this is the correct count.
For Be[in]Crypto’s latest Bitcoin (BTC) analysis, click here
Disclaimer
In line with the Trust Project guidelines, this price analysis article is for informational purposes only and should not be considered financial or investment advice. BeInCrypto is committed to accurate, unbiased reporting, but market conditions are subject to change without notice. Always conduct your own research and consult with a professional before making any financial decisions. Please note that our Terms and Conditions, Privacy Policy, and Disclaimers have been updated.
