


The Polygon (MATIC) price failed to break out from a descending resistance trend line in place for 750 days.
Based on the wave count, there are two potential scenarios for the future MATIC price trend.
Polygon Creates Bearish Candlestick
MATIC has fallen under a descending resistance trend line since its all-time high of $2.90 in December 2021. The decrease peaked at $0.32 in June 2022 and the MATIC price has increased since.
Despite the upward movement, MATIC failed to break out from the descending resistance trend line. Rather, it was rejected several times, most recently in November and December 2023 (red icons).
This includes a failed breakout attempt that led to a bearish engulfing candlestick two weeks ago. MATIC now trades below the descending resistance trend line, which has been in place for 750 days.
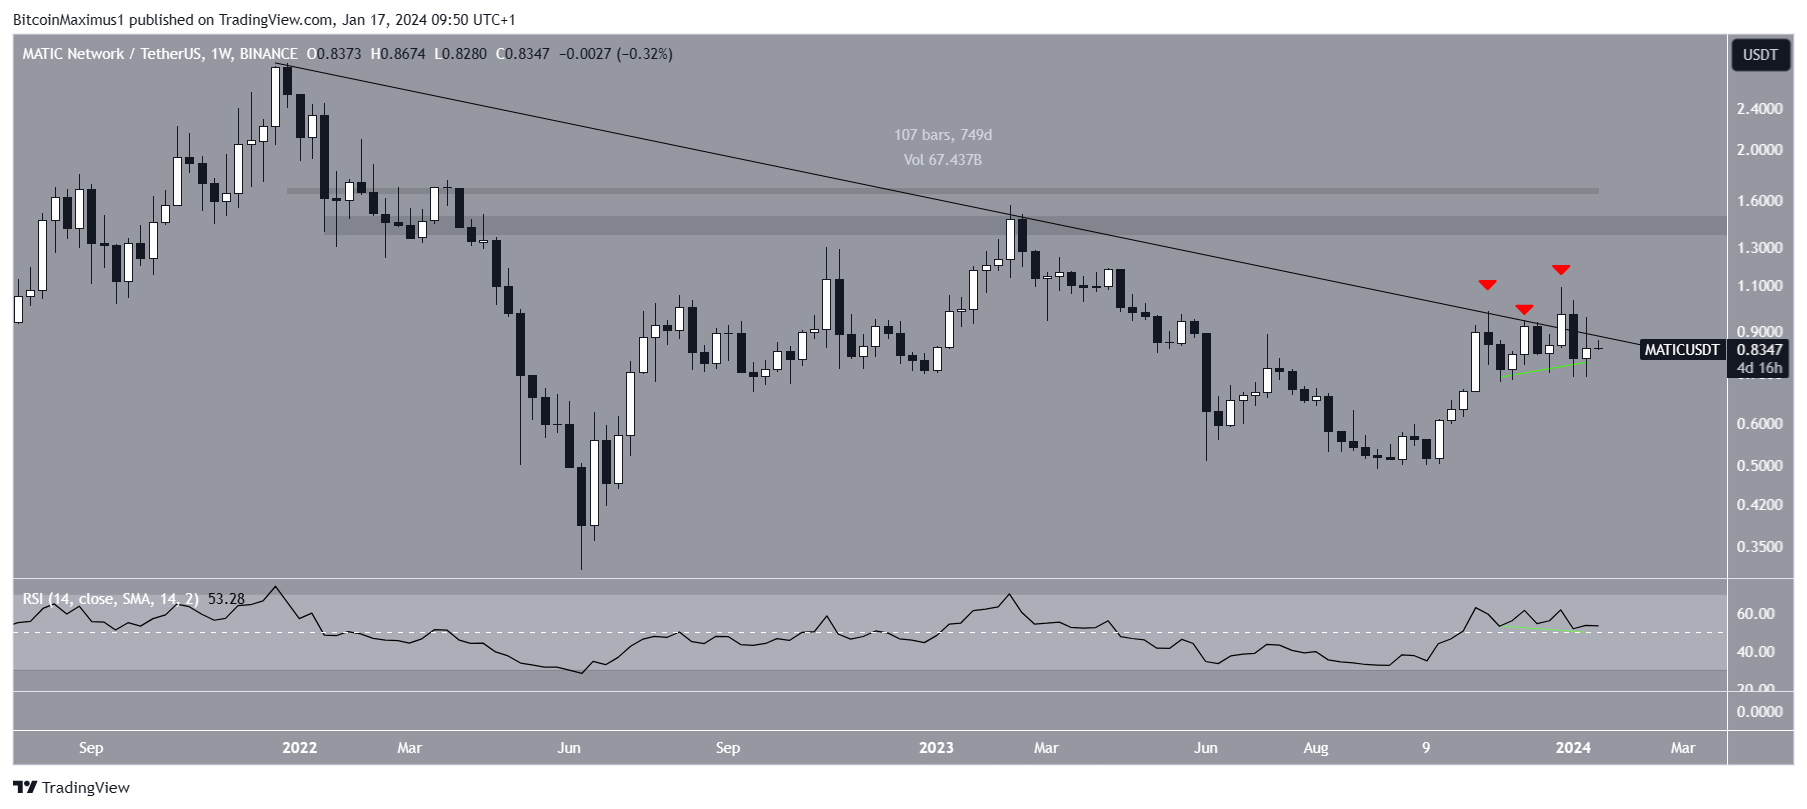
Despite the failed breakout attempts, the Relative Strength Index shows bullish signs.
The RSI is a momentum indicator traders use to evaluate whether a market is overbought or oversold and whether to accumulate or sell an asset.
Readings above 50 and an upward trend suggest that bulls still have an advantage. Readings below 50 indicate the opposite.
The RSI is above 50 and has generated a hidden bullish divergence (green), a sign of trend continuation.
Read More: What is Polygon (MATIC)?
MATIC Price Prediction: Can Price Sustain the Bounce?
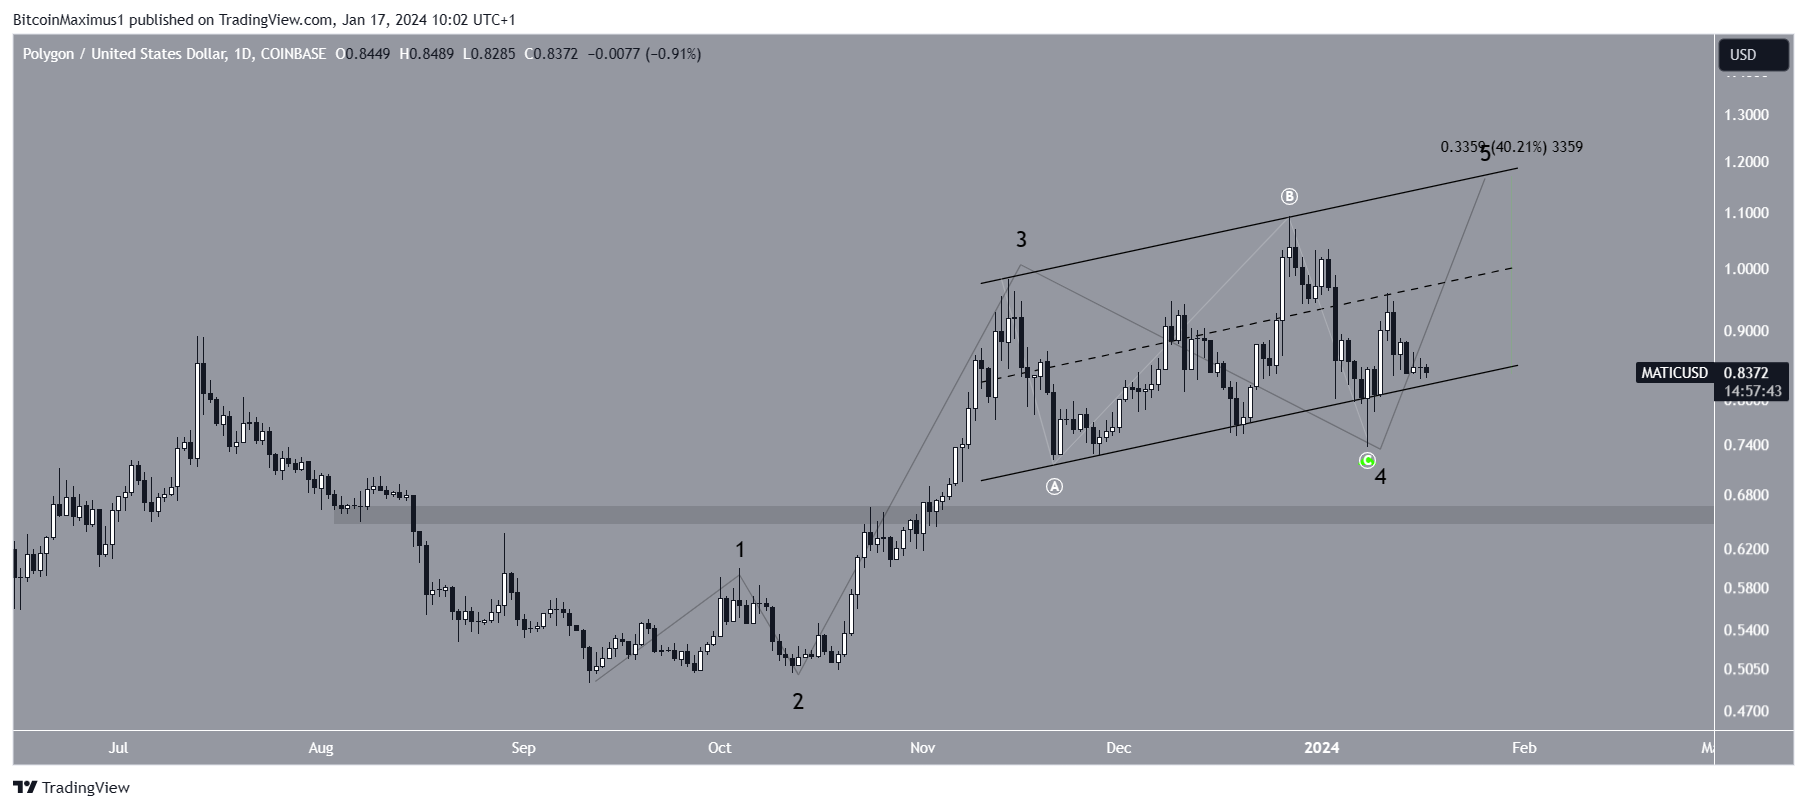
The daily time frame gives mixed readings and does not confirm whether the trend is bullish or bearish. Rather, it offers two scenarios for the future MATIC movement, coming from potential wave counts.
Elliott Wave theory involves the analysis of recurring long-term price patterns and investor psychology to determine the direction of a trend.
The bullish count suggests that MATIC has completed an A-B-C corrective structure (white), which has been contained inside an ascending parallel channel.
If the count is correct, the January 8 bounce (green icon) marked the end of the drop, leading to the start of the fifth wave (black). In this case, MATIC will increase nearly 40% to the channel’s resistance trend line at $1.18.
Polygon’s co-founder Sandeep Nailwal stated that the release of Matic 2.0 and POL token this year will significantly advance the existing infrastructure. The POL token is built to be a multi-chain token and will have a restaking mechanism.
Read More: How to Buy Polygon (MATIC)?
The bearish count suggests that the five-wave upward movement is complete, and wave four was a symmetrical triangle.
Therefore, the count indicates that the MATIC price is in the C wave of its correction, which will cause a 22% regression to the closest support at $0.65.
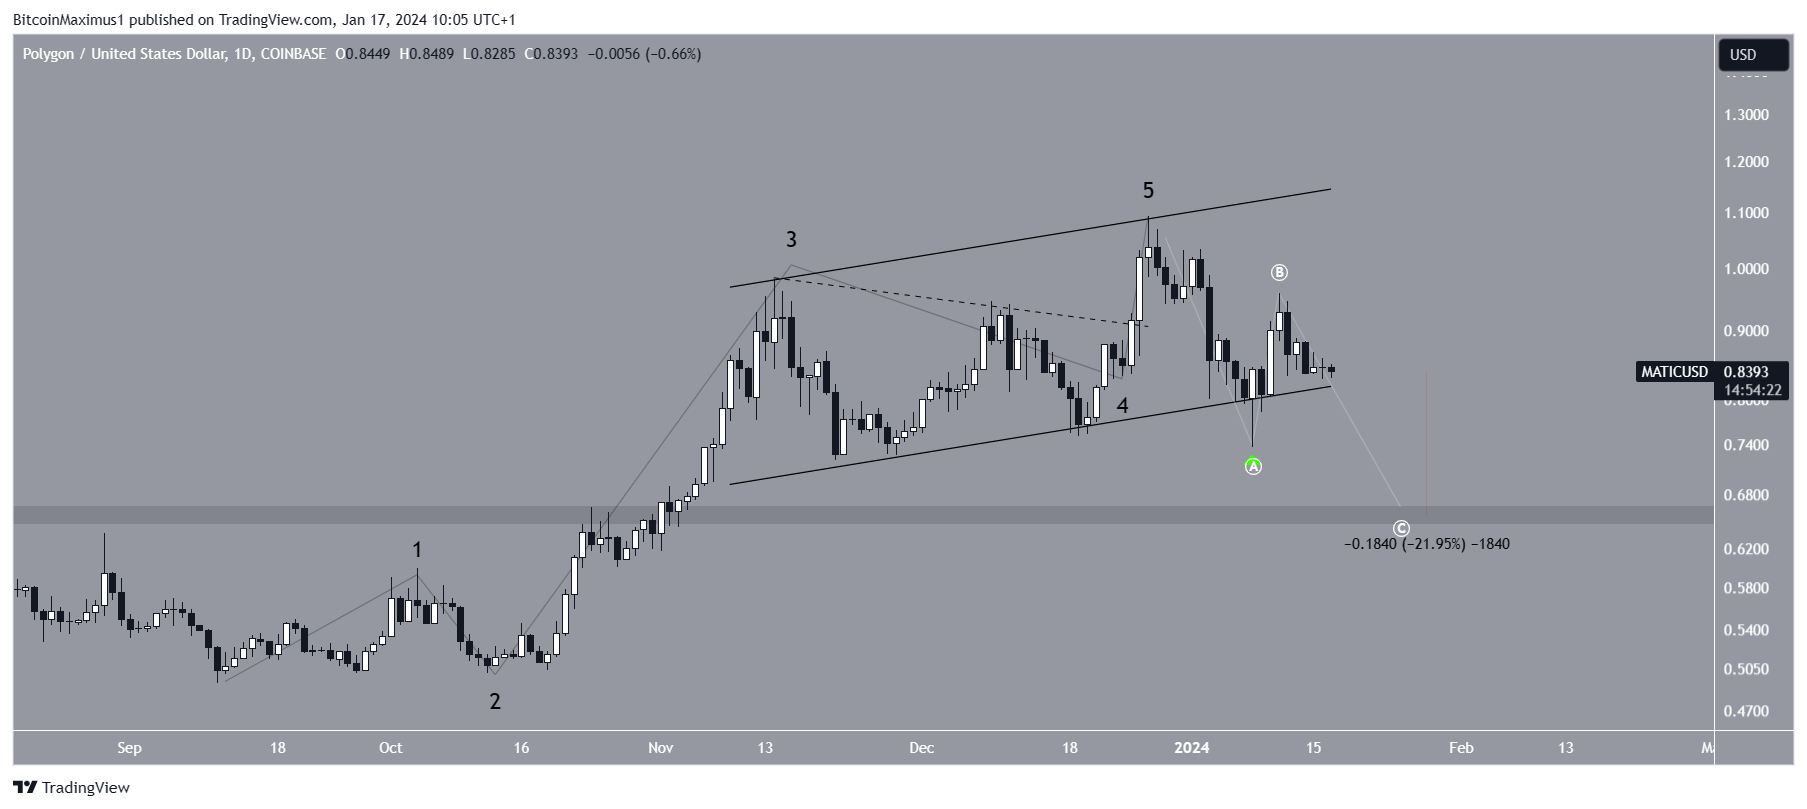
As a result, the MATIC price prediction will be determined by whether the price breaks out or down from the channel. An increase of 40% or a decrease of 22% will follow based on what happens.
For BeInCrypto’s latest crypto market analysis, click here.


