
Tron (TRX) is one of the few altcoins that has maintained a positive return over the past seven days. As a result, attention is shifting to the cryptocurrency whose price has increased by 65.65% within the last 365 days.
Since its fall from $0.12 on May 12, TRX bulls have defended the price from going below the $0.11 support. Based on on-chain data and analysis of the daily TRX/USD chart, here is how the price may move.
All Eyes on Tron?
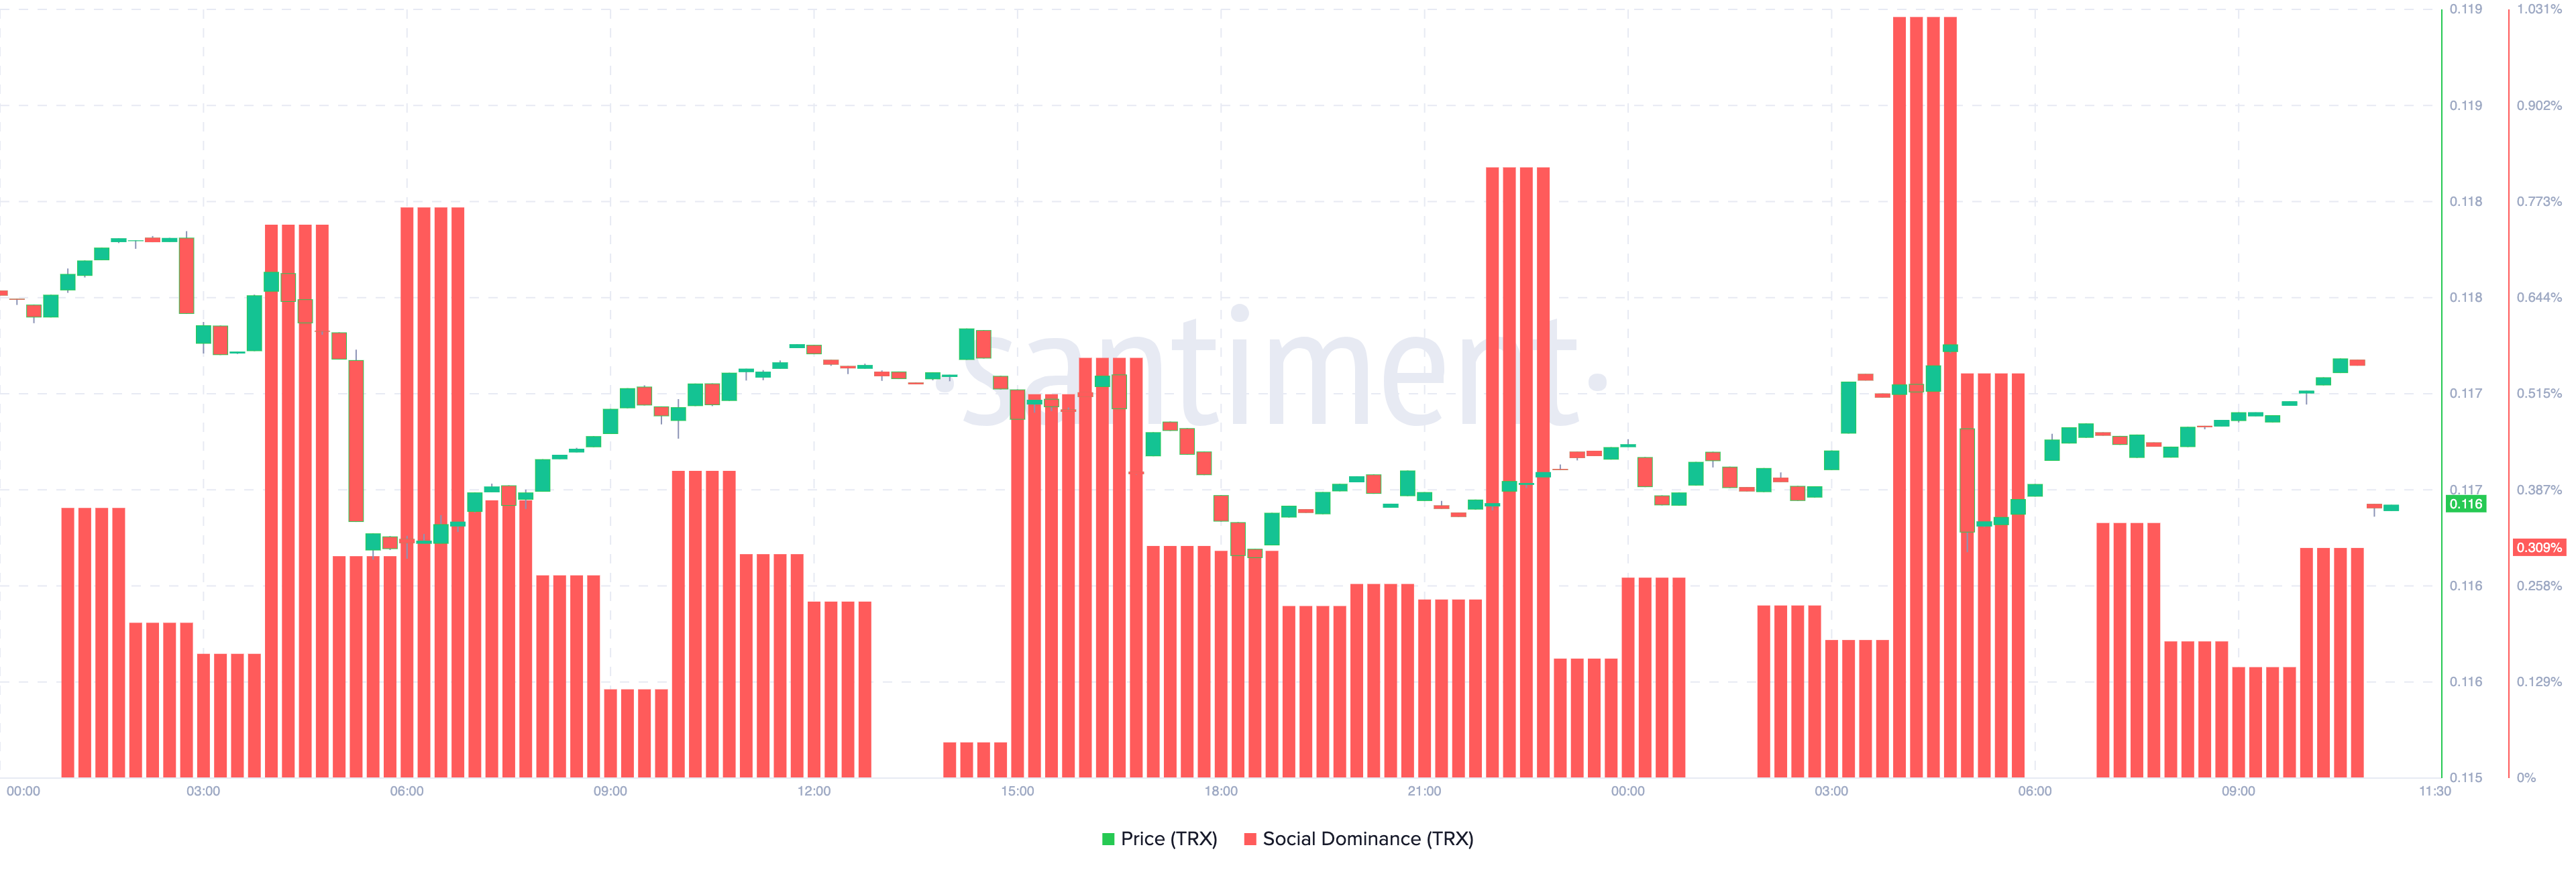
On-chain data from Santiment shows that Tron’s social dominance has been improving. In the early hours of June 12, Social Dominance on the network was 0.15%. However, as of this writing, the reading has doubled to $0.30%.
Social Dominance refers to the share of discussion about a particular asset in crypto media compared to other cryptocurrencies in the top 100.
When this dynamic ratio increases, the price of an asset may rebound as long as the discussions do not get overheated. However, a decline in the metric implies that a cryptocurrency is getting less recognition in the market.
The impact of the rising dominance has been reflected in the price of TRX. The chart below shows that TRX’s price has been moving with consistent green candlesticks, which typically proves that there is rising demand for the token.
Read more: 7 Best Tron Wallets for Storing TRX Tokens
However, evaluating the price potential from a technical angle is important. And the next segment does that.
On the daily chart, TRX faced selling pressure between mid-May and May 28. During this period, the price fell from a peak of $0.13 to $0.11. Bears tried to pull the price further down, but the bulls’ resilience ensured the effort was in vain as sellers were exhausted.
Meanwhile, Tron’s price has been moving upward since then, forming an ascending channel from May 28 till June 11.
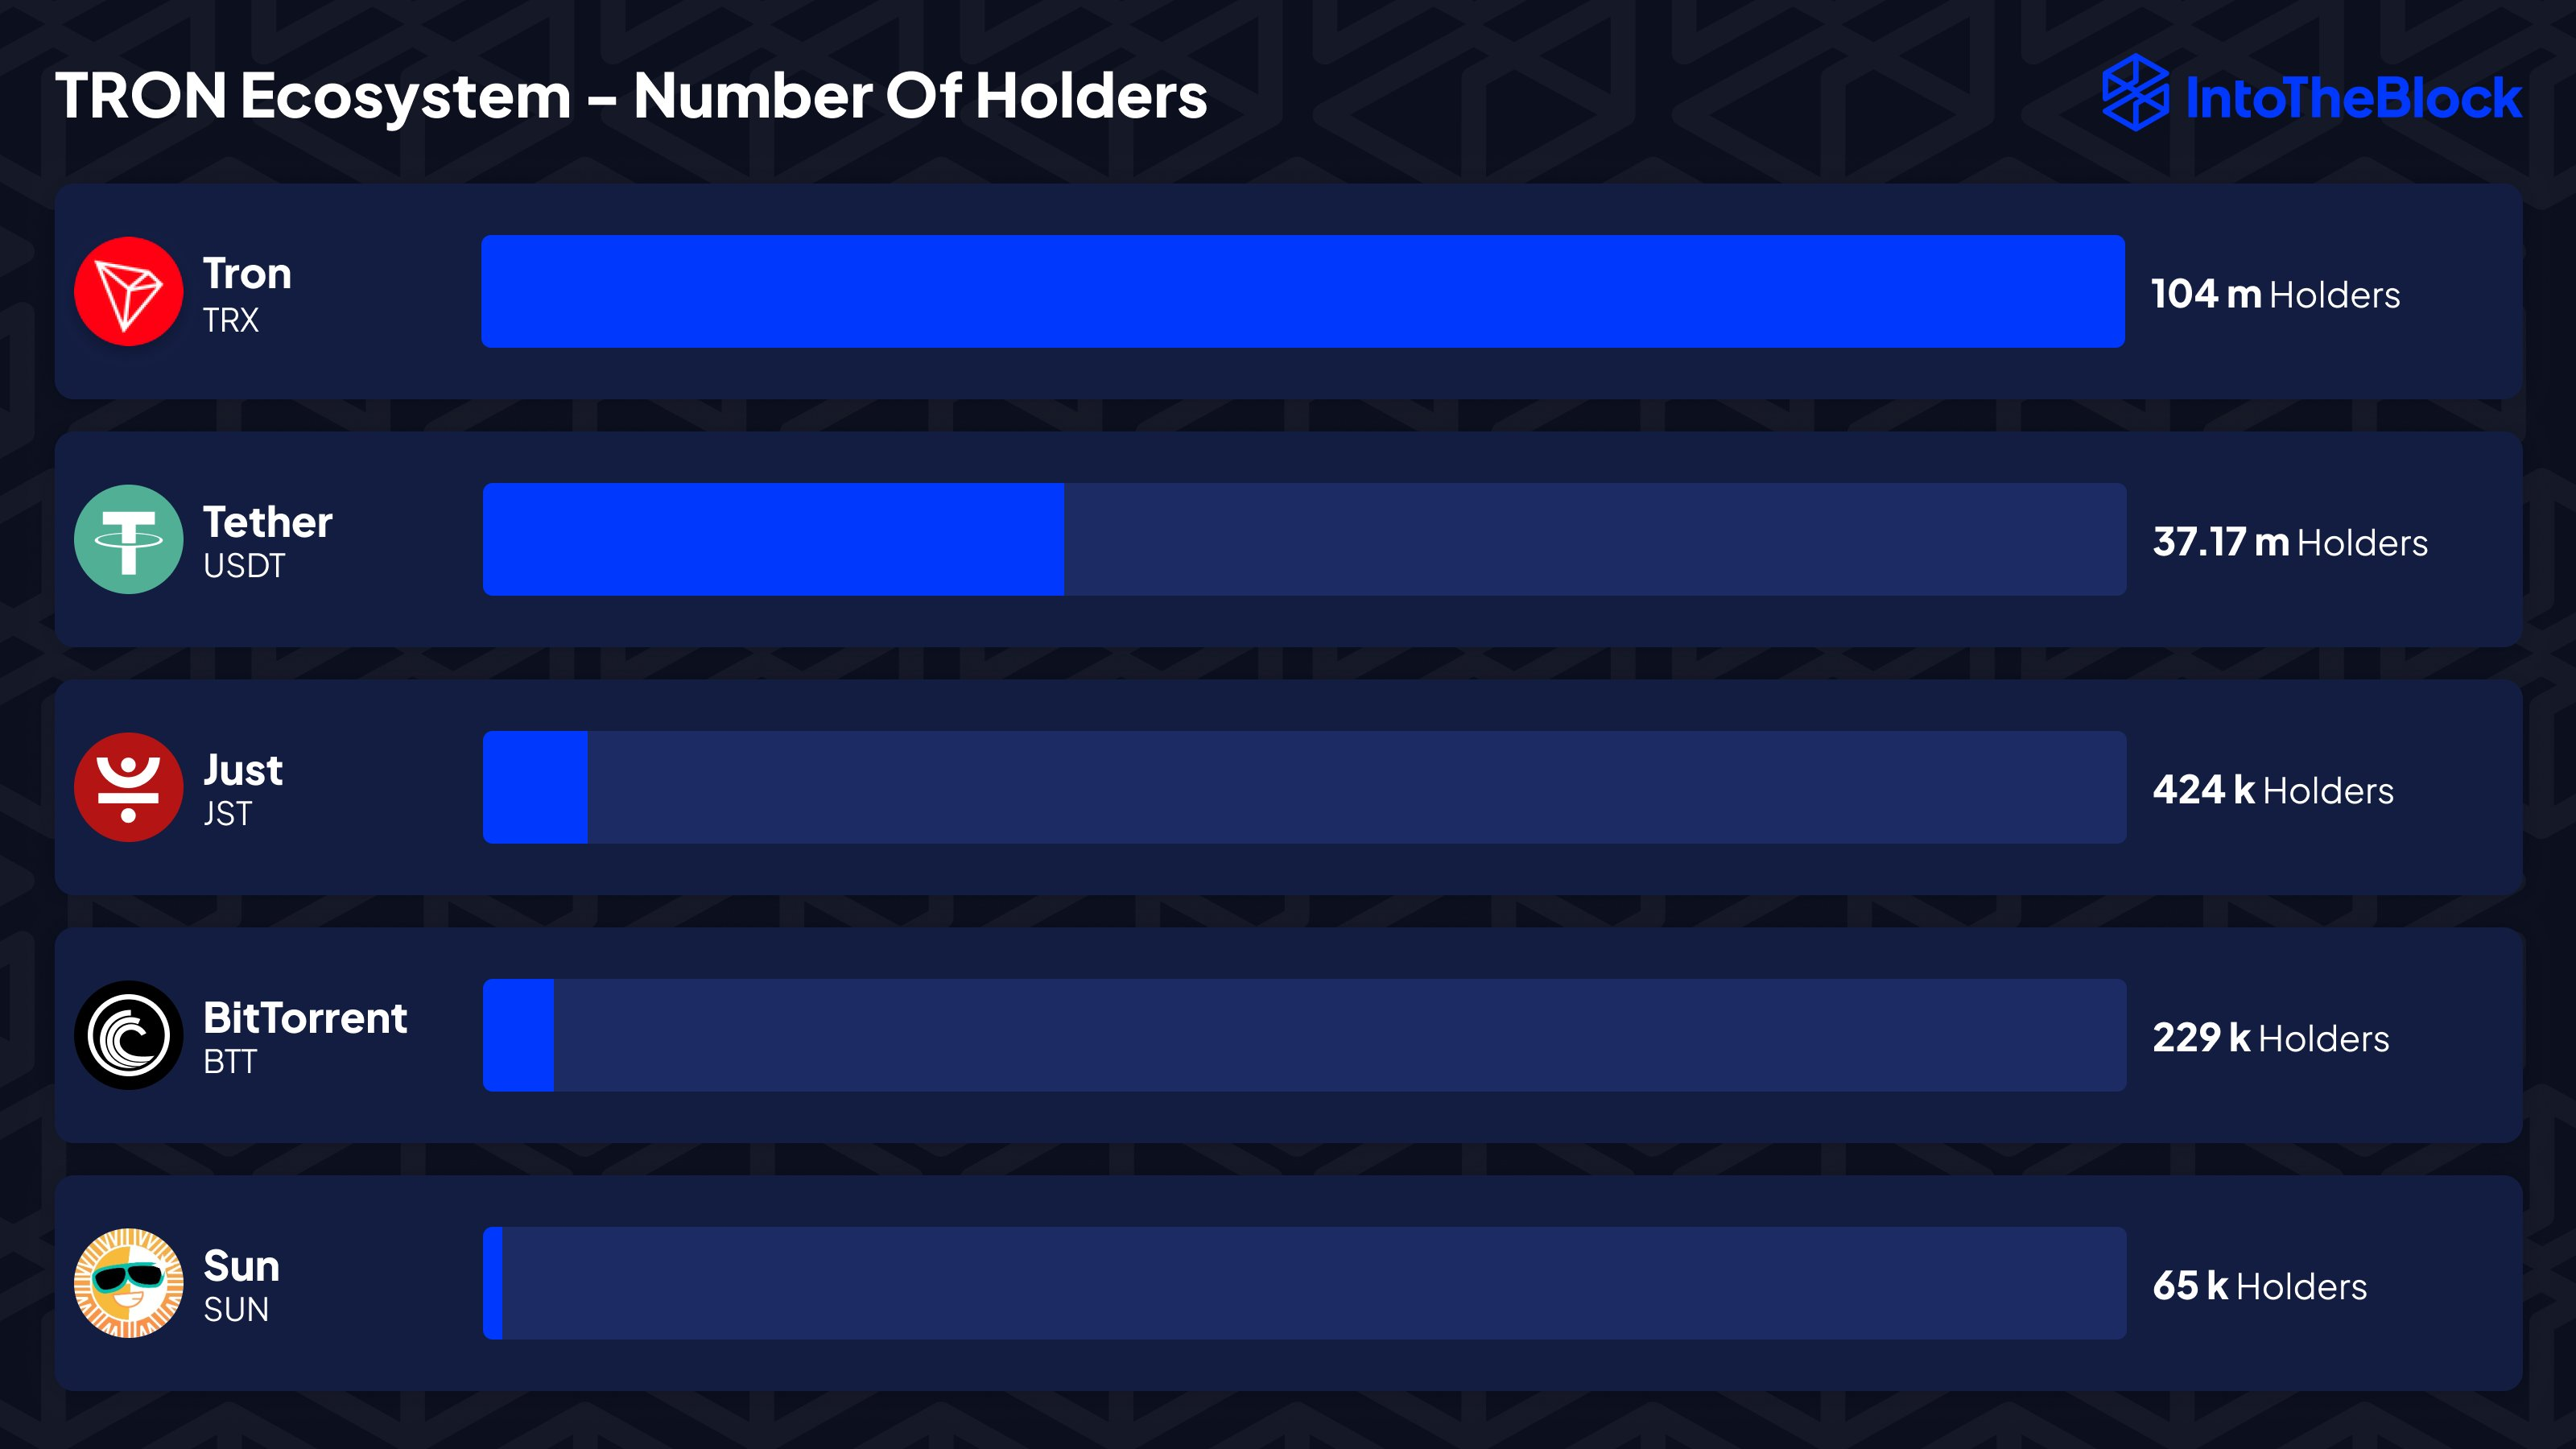
Additionally, Tron remains one of the largest Networks in the industry. Juan Pellicer, Senior Researcher at InToTheBlock, states that the Tron Network currently has over 104 million holder addresses.
“The TRON network averages 6.75 million transactions per day, significantly outpacing other Layer 1 blockchains. In comparison, Ethereum handles around 1.1 million daily transactions.” Pellicer commented.
“A substantial portion of TRON’s activity stems from USDT transactions, which typically range between 2 to 3 million per day. TRON has carved out a unique position in the market, favored for USDT payments and international settlements due to its low fees and widespread availability on numerous exchanges.” Pellicer added.
TRX Price Prediction: Watch Out For $0.13
An ascending channel, also known as a “channel up,” appears when a price forms two upward trendlines. On one end, the trendline forms a higher low, indicating support. On another, the trendline forms a higher high, representing resistance.
To confirm the ascending channel, BeInCrypto evaluates the Moving Average Convergence Divergence (MACD).
MACD is a technical tool that identifies whether a cryptocurrency’s momentum is bullish or bearish. Positive readings of the indicator suggest a bullish trend. Conversely, a negative reading indicates a bearish trend.
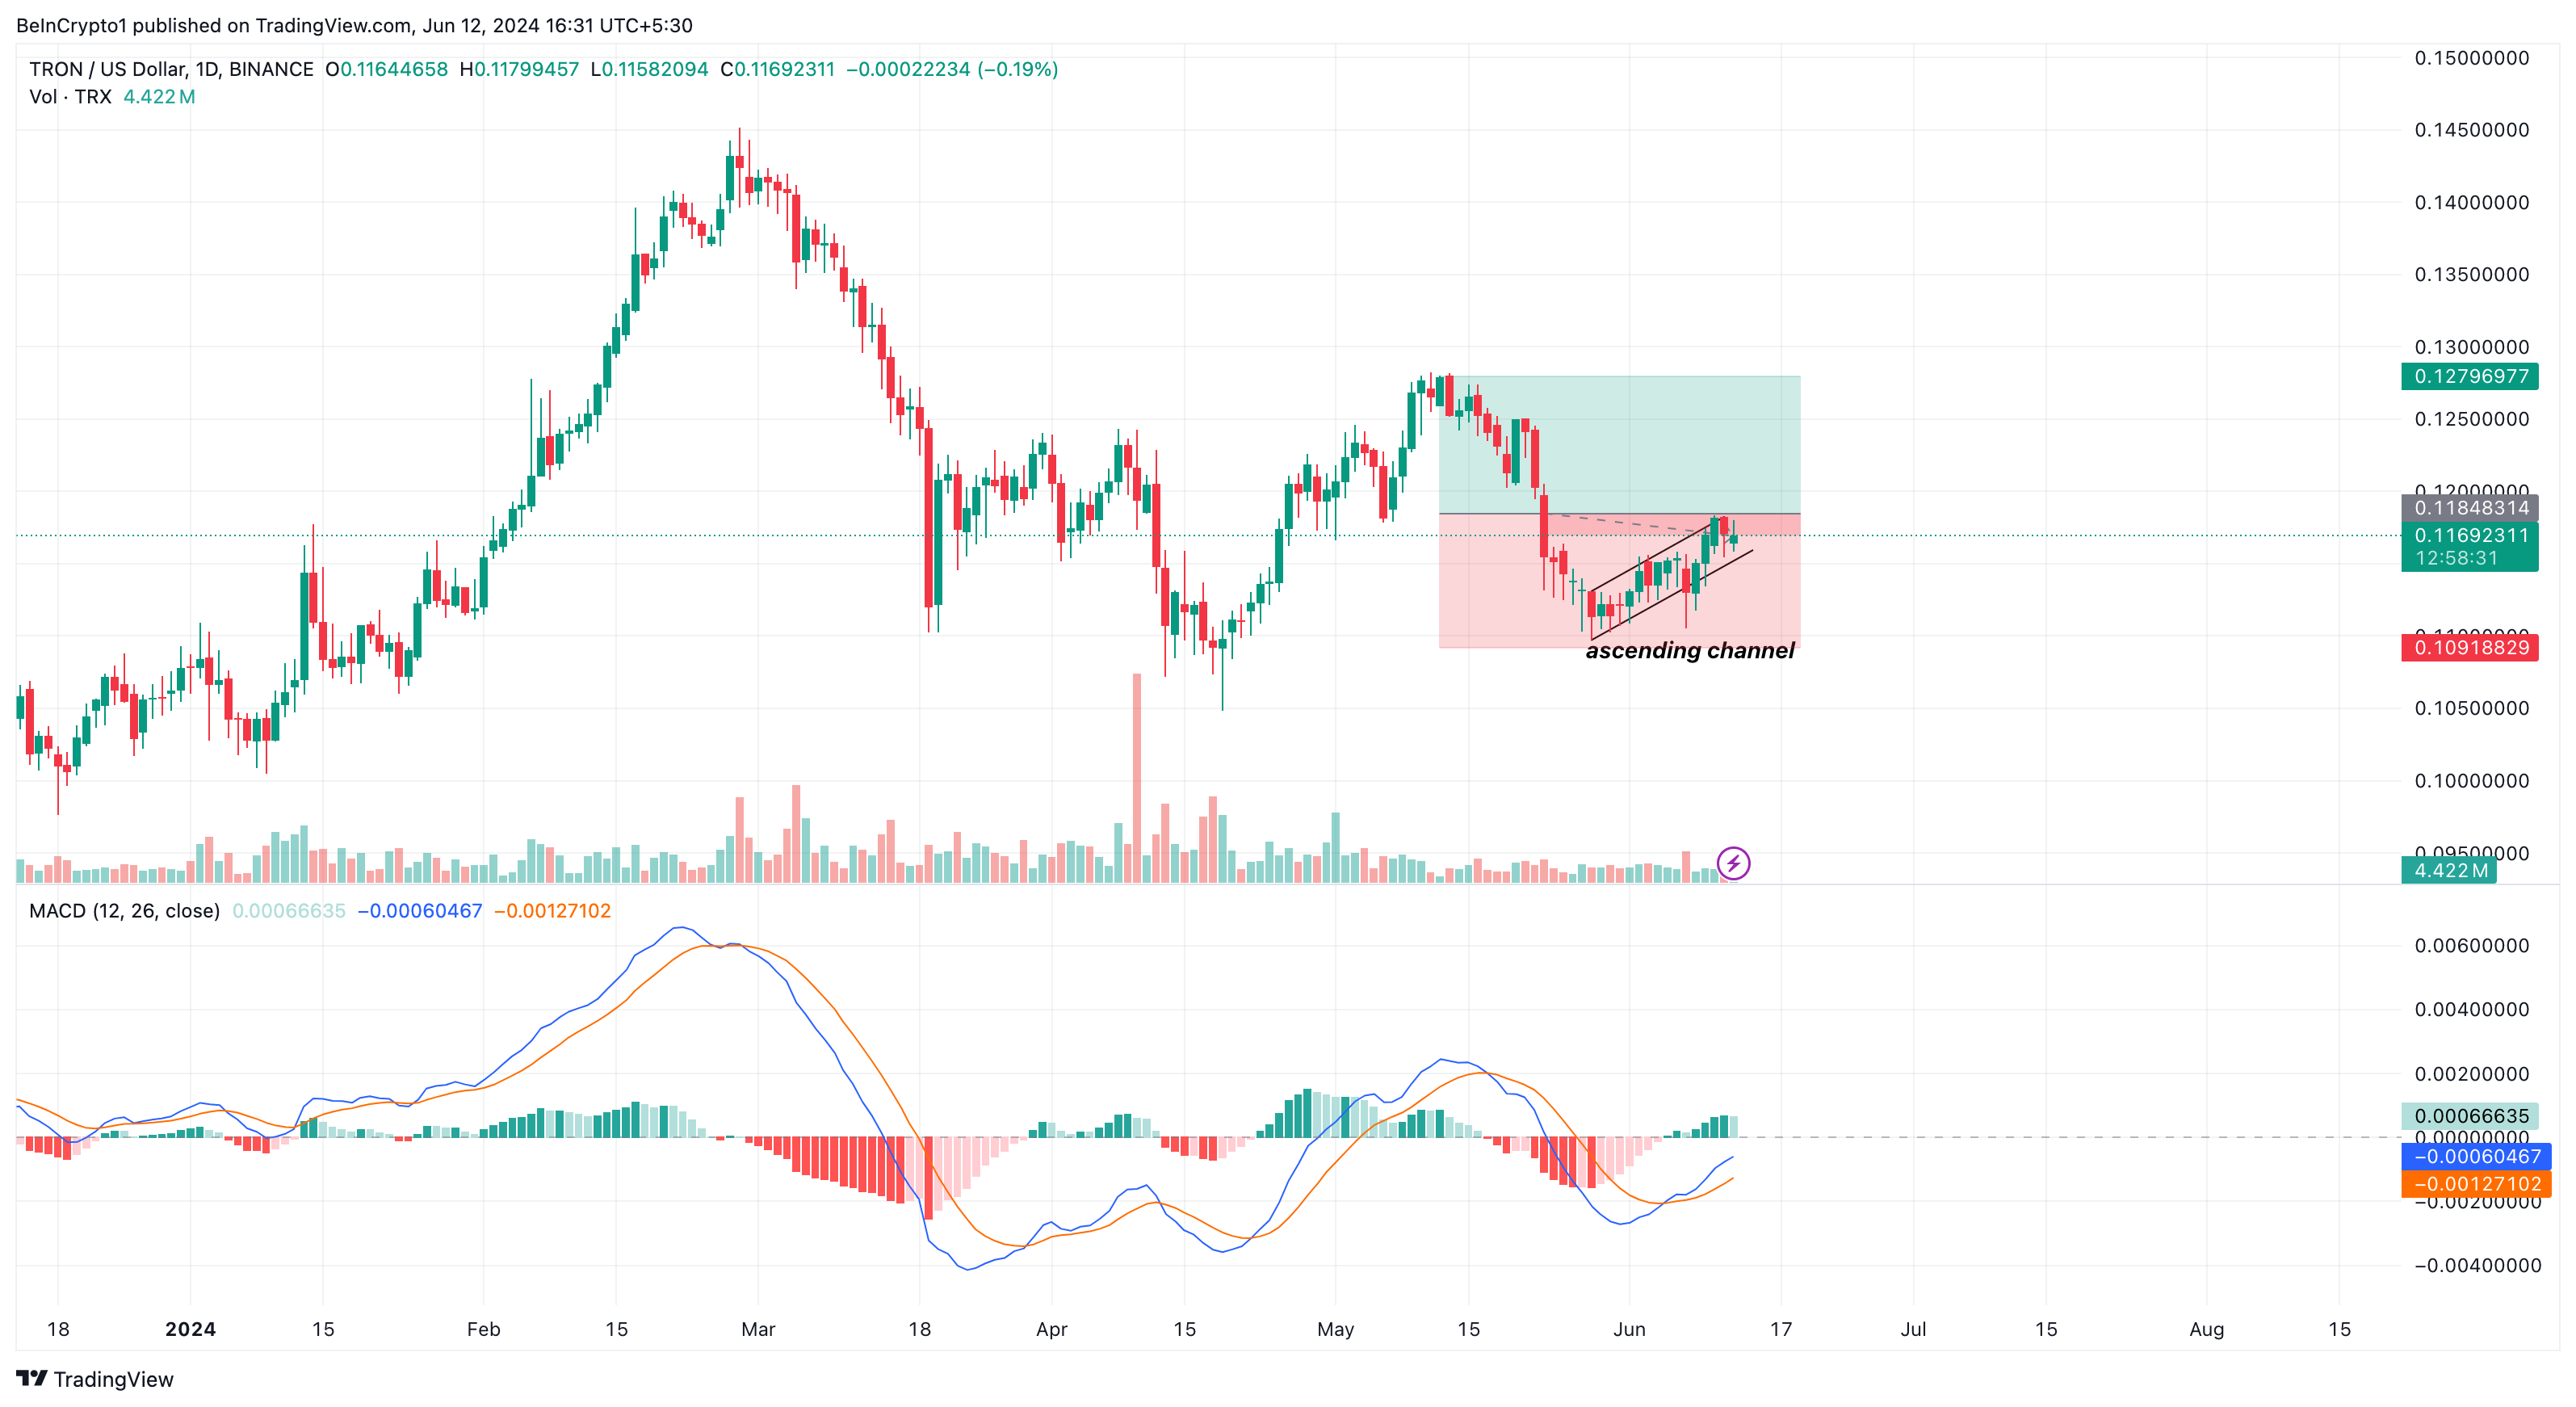
As of this reading, the MACD trends above the zero histogram line with clear green bars. This confirms the bullish momentum reflected by Tron’s price. Should the momentum remain bullish, TRX may key into the overhead resistance close to $0.13.
Despite the bullish outlook, crucial support and resistance levels should be identified. The Fibonacci Retracement Indicator helps with this. There are four key Fibonacci ratios: 23.6%, 38.2%, 50%, 61.8%, and 78.6%.
With this indicator, traders can spot possible reversal benchmarks after determining the difference in absolute highs and lows. The indicator suggests that a surge in buying pressure may send TRX toward $0.13, which is the point where the 1.618 golden ratio is located.
Read more: Tron (TRX) Price Prediction 2024/2025/2030
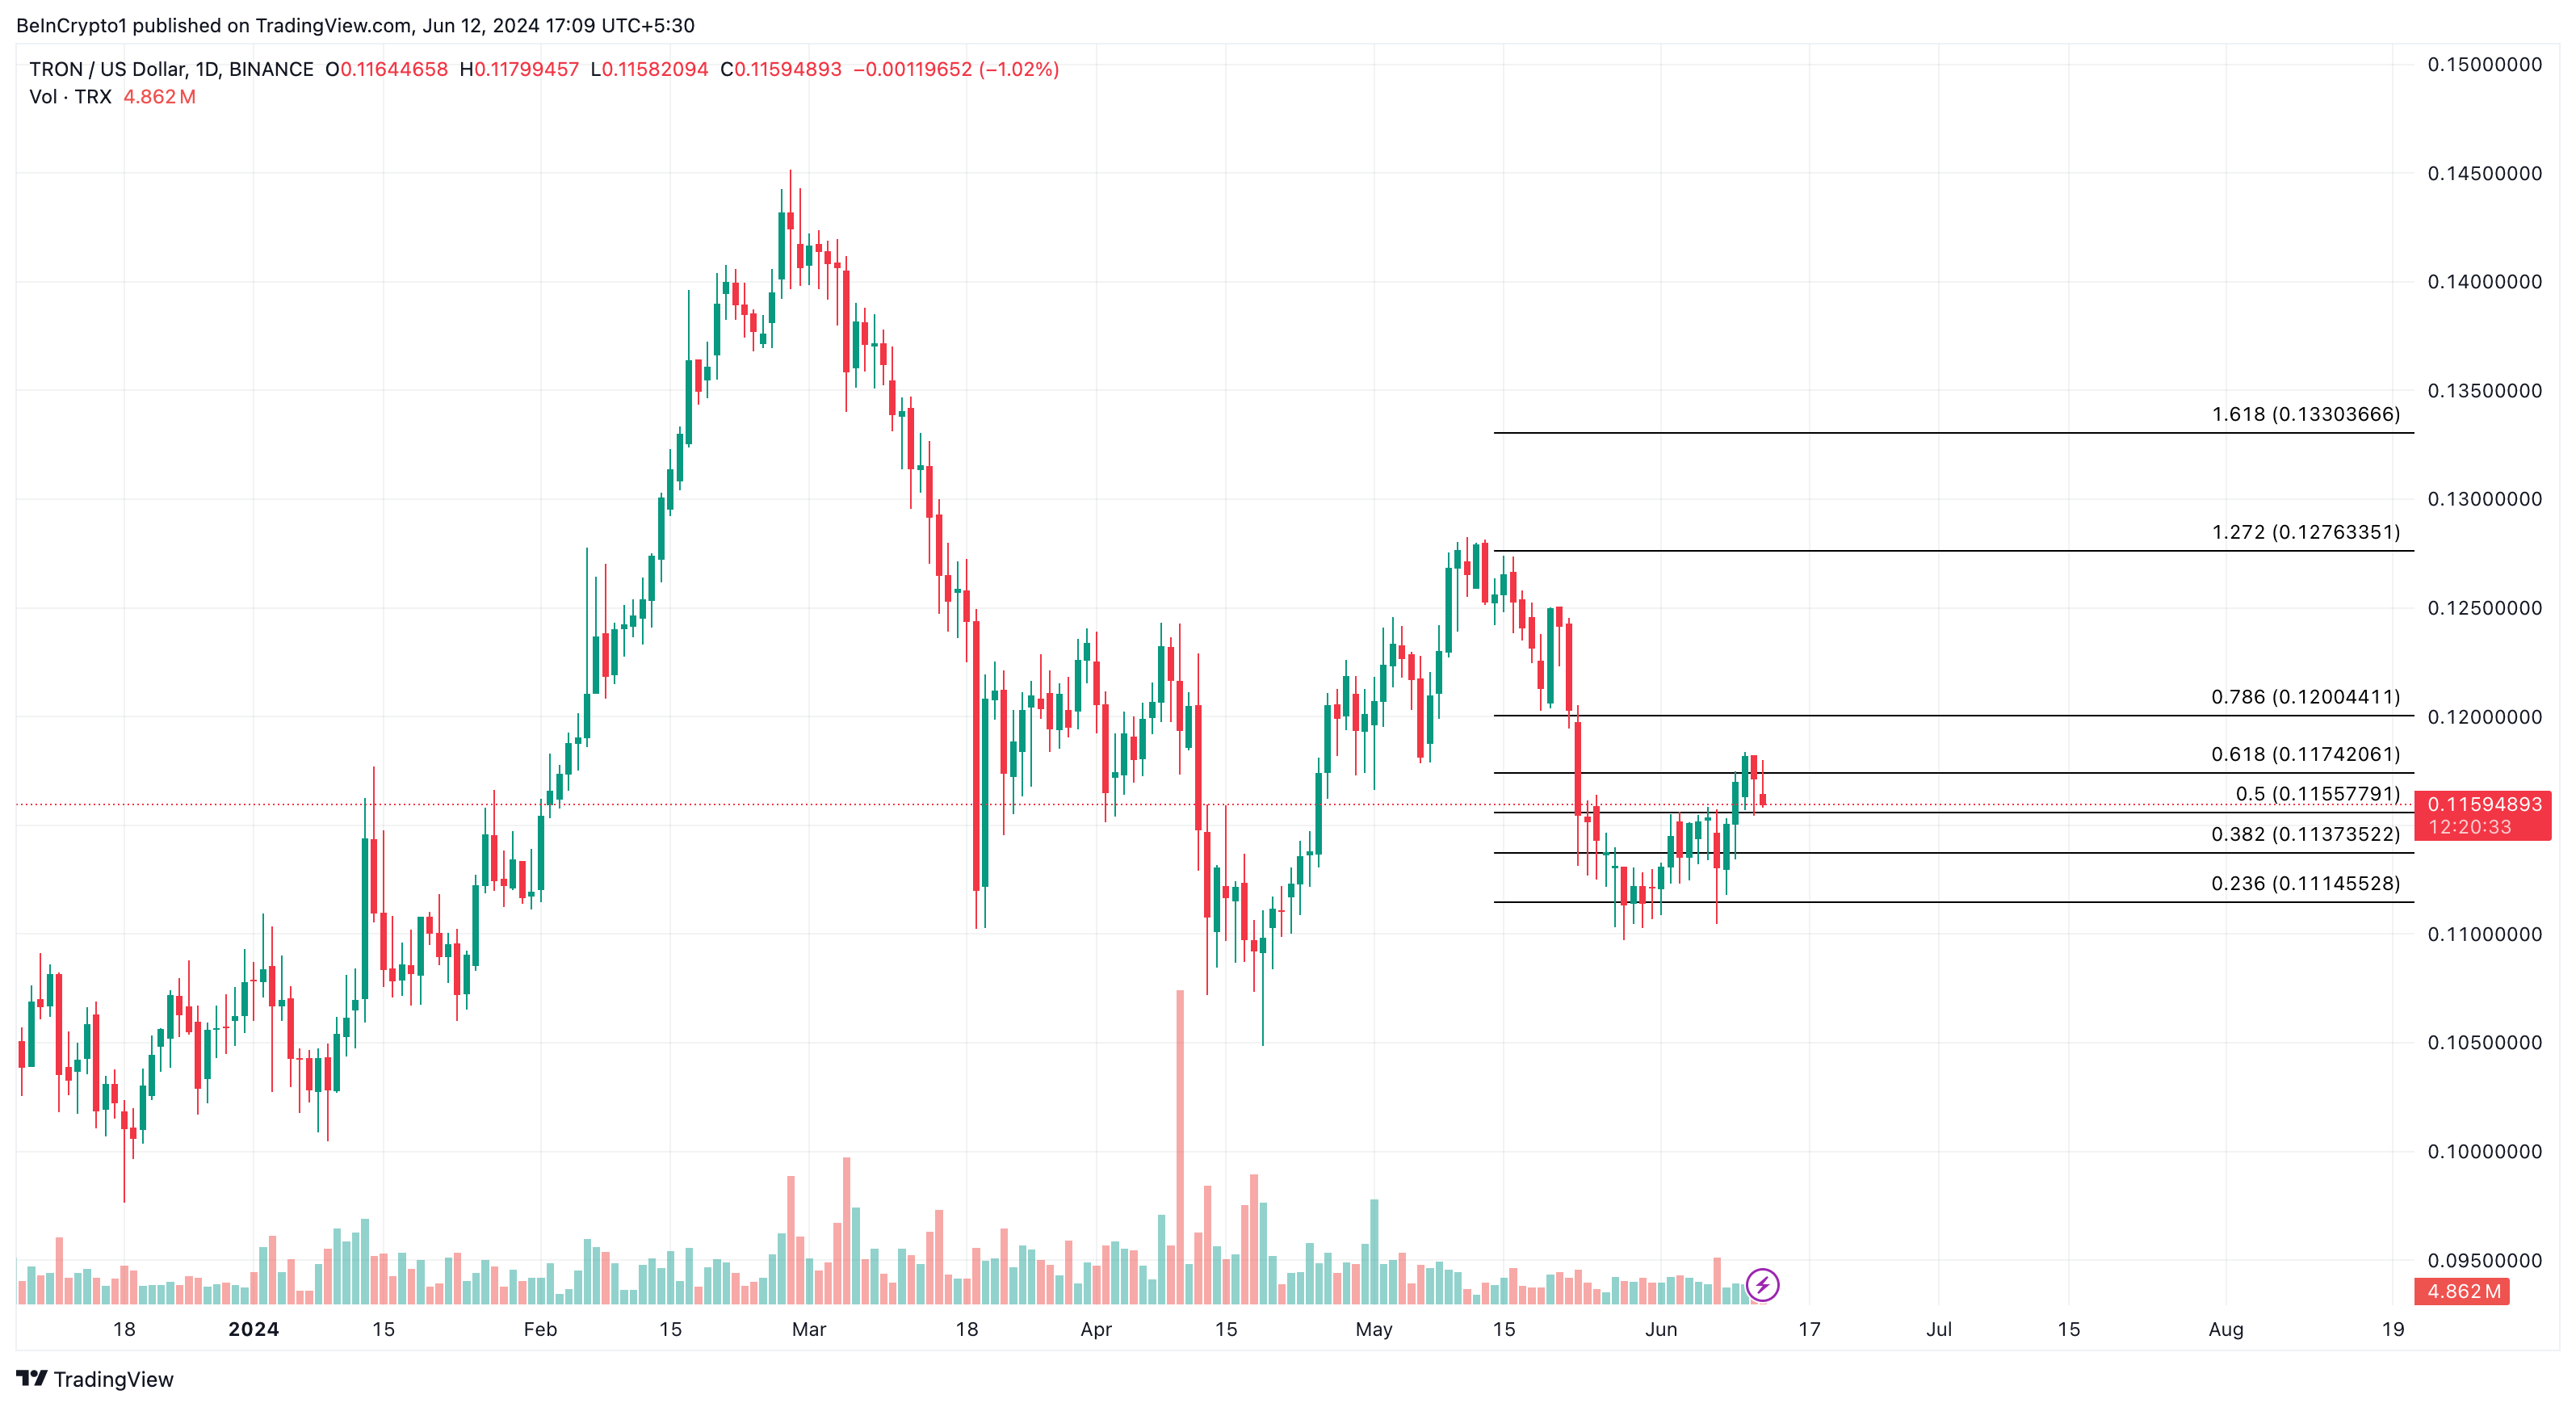
However, a resistance appears at the 0.786 Fibonacci level. If market participants decide to book profits at this level, TRX’s bullish bias may be invalidated. If this is the case, the price might nosedive to $0.10.
