
Tron (TRX) has regained its footing after a decrease as a result of its USDD de-peg, but concerns about its viability still remain.
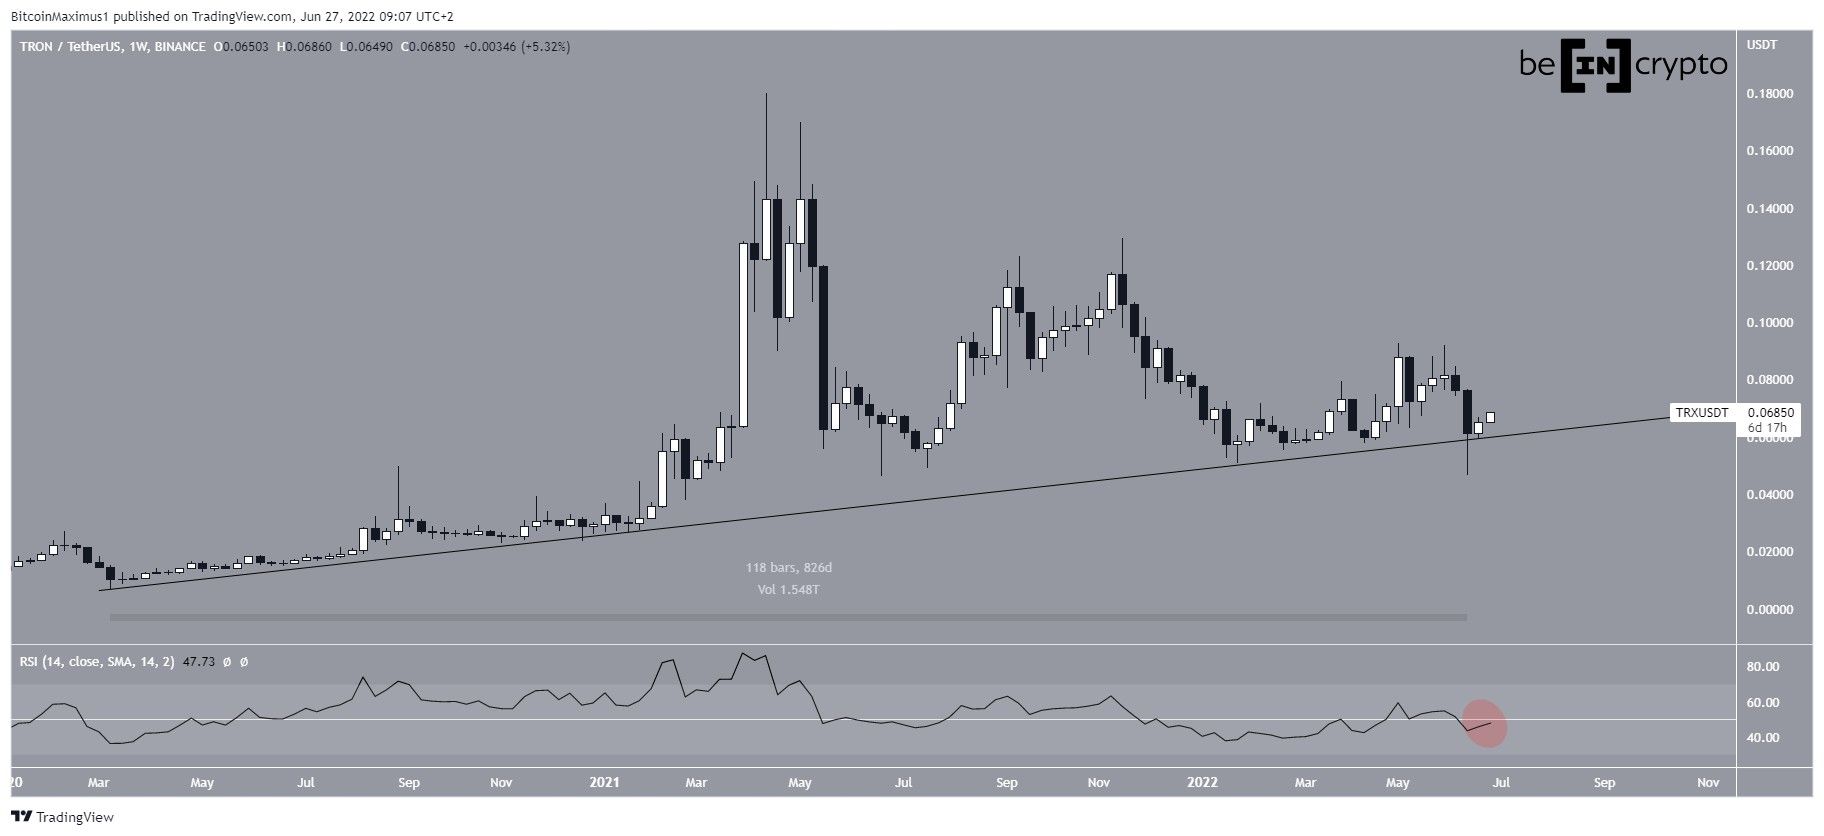
TRX has been decreasing since reaching an all-time high price of $0.18 in April 2021. The downward movement led to a low of $0.046 on June 15, 2022.
The low and subsequent bounce served to validate an ascending support line that has been in place for 826 days. As long as the price is trading above this line, the bullish structure remains intact.
The weekly RSI could be in the process of validating the 50 line as resistance (red circle). Whether it is successful in doing so or gets rejected could determine whether the price breaks down from the line or not.
A potential breakdown from this line could cause an acceleration of the downward movement.
Breakdown is followed by reclaim
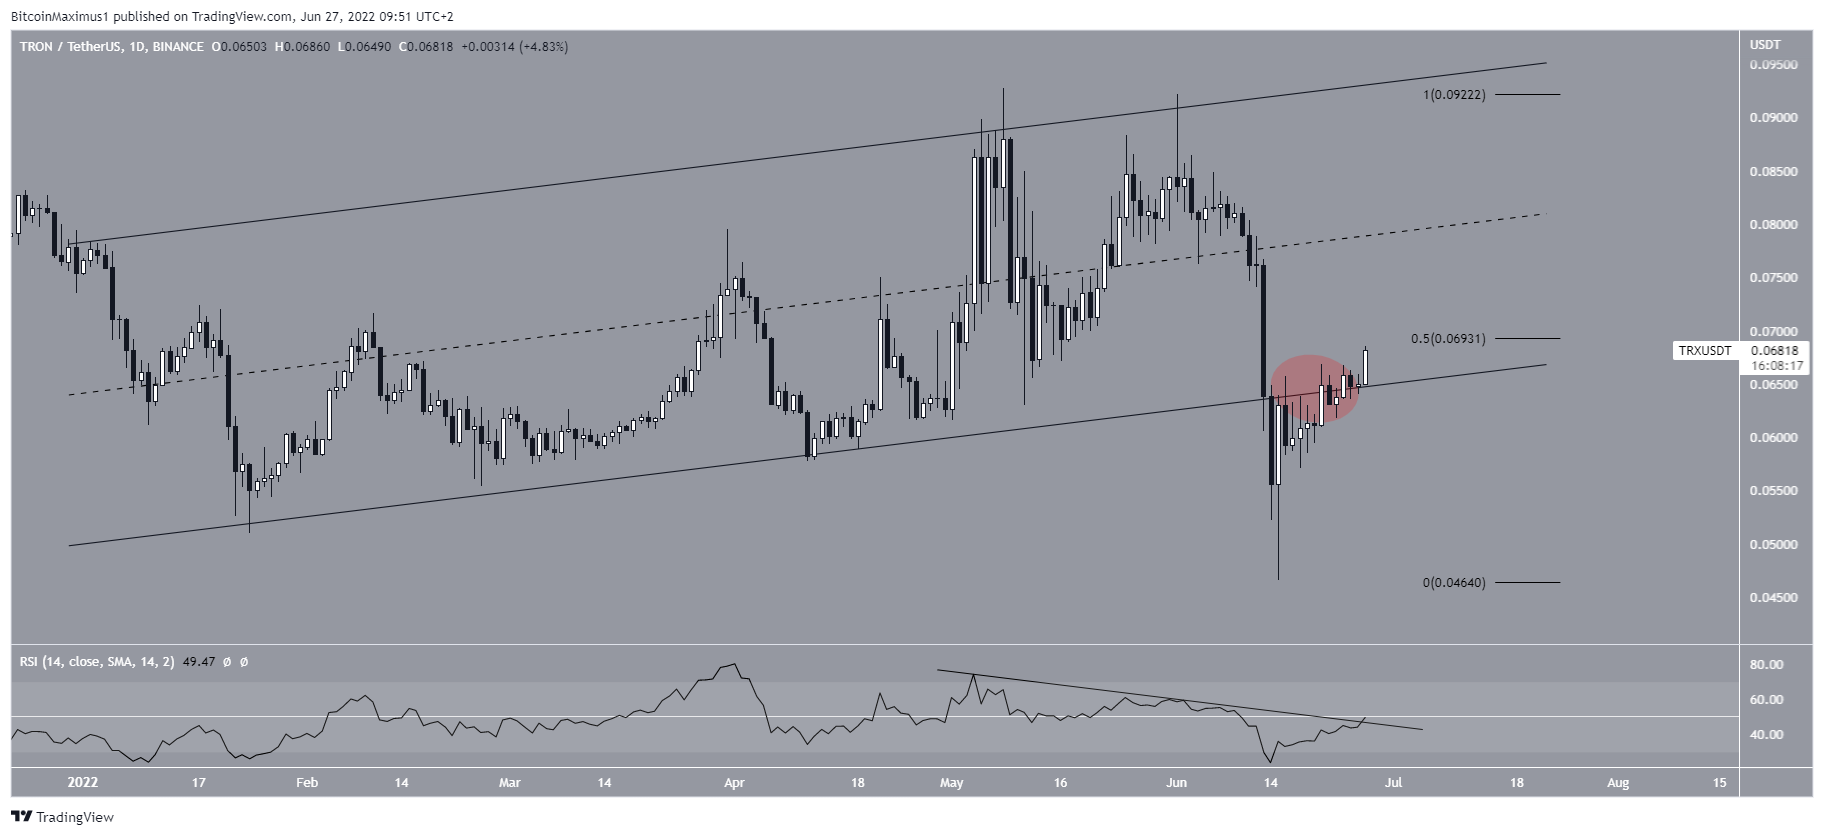
The daily chart shows that the price had been increasing inside an ascending parallel channel since the beginning of the year.
After finally breaking down from it on June 13, the price seemingly validated it as resistance throughout the ensuing week (red circle).
However, the price managed to reclaim the support line of the channel on June 27. It is currently trading at the 0.5 Fib retracement resistance level at $0.069.
Similar to the weekly chart, the RSI is currently validating the 50 line as resistance, while also following a descending trendline. So, if it is successful in breaking out, it could be the catalyst for a significant upward movement.
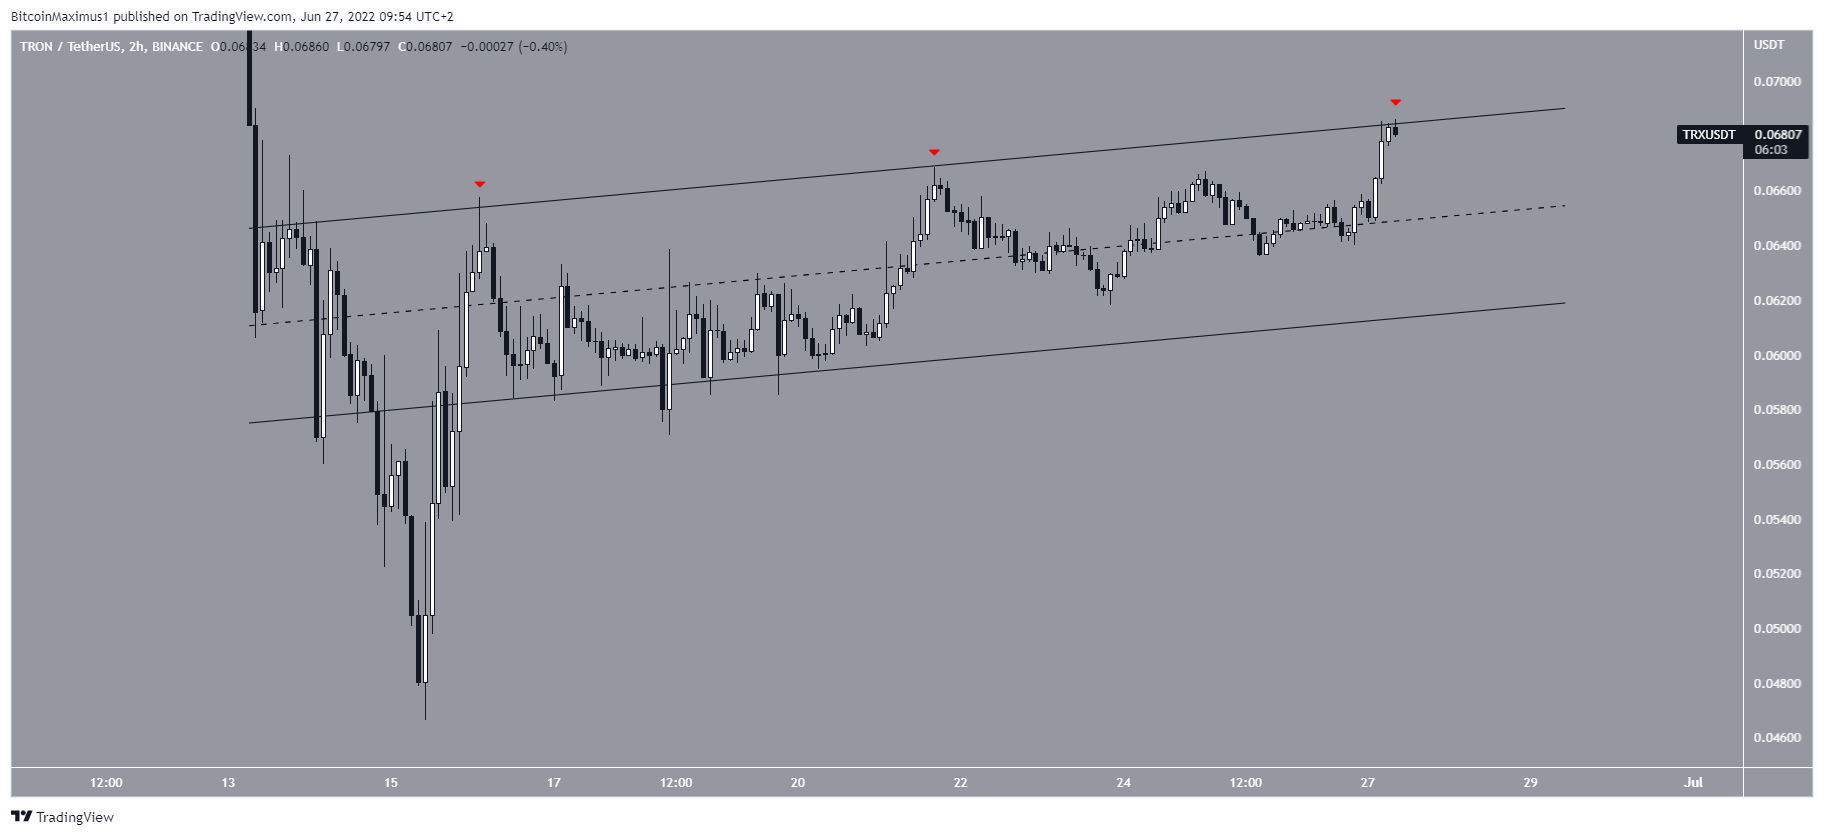
The two-hour chart is in alignment with this outlook since it shows that TRX is trading at the resistance line of an ascending parallel channel (red icon). Since the resistance of the channel coincides with the previously outlined Fib retracement resistance level, whether the price breaks out or gets rejected will likely determine the direction of the short-term movement.
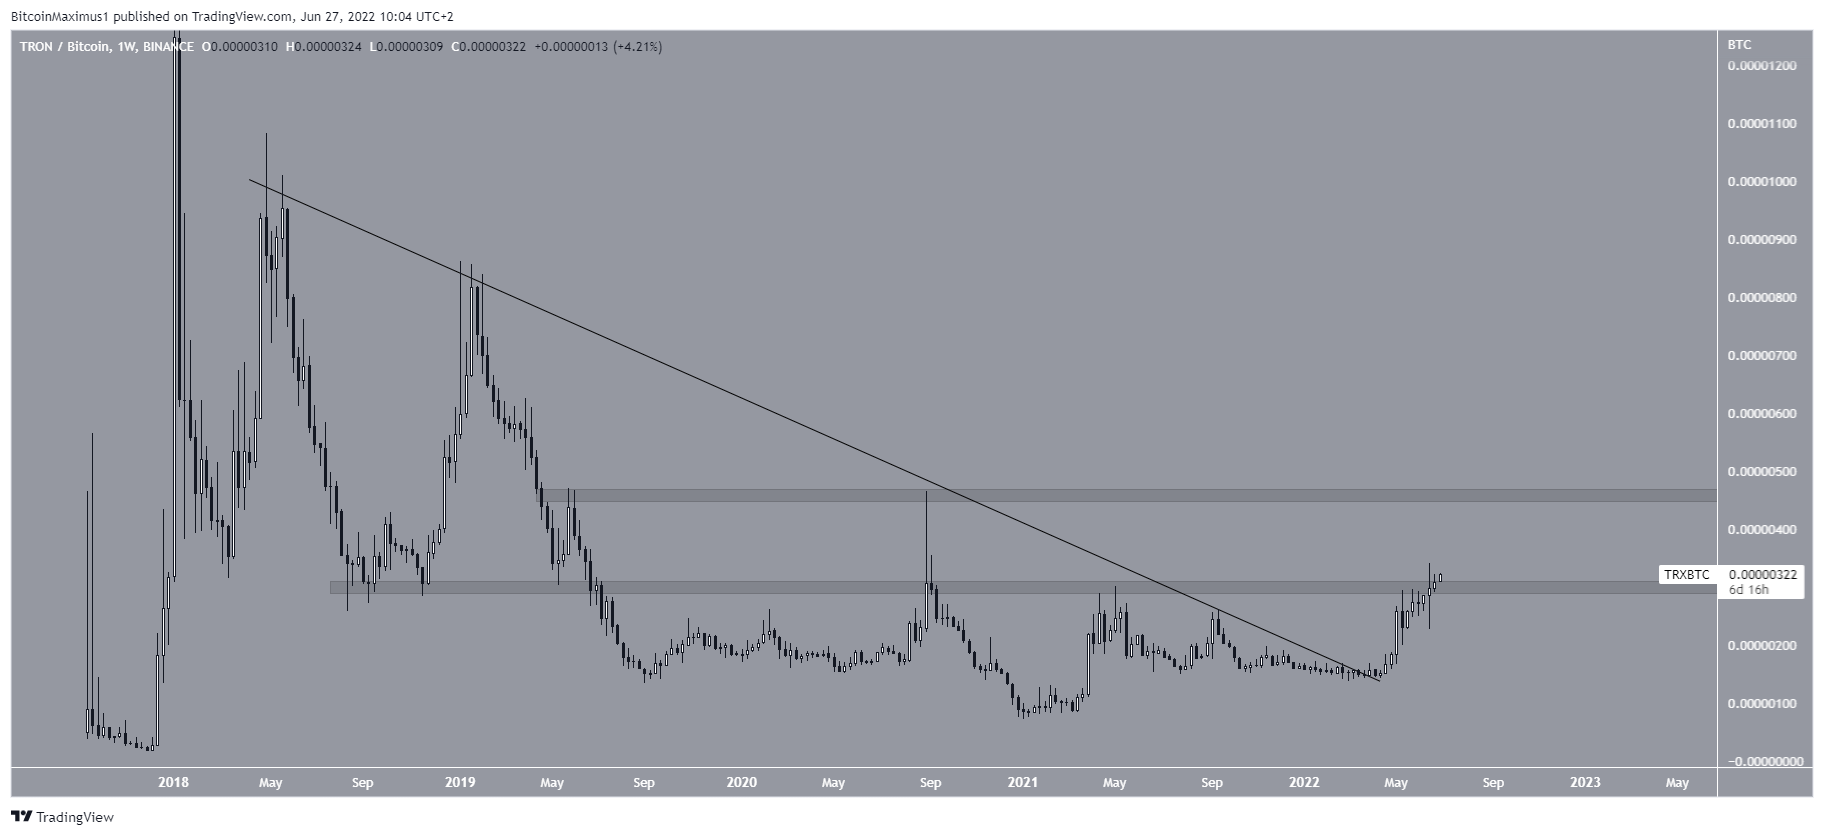
TRX/BTC
Cryptocurrency trader @CryptoShadowOff tweeted a chart of TRX, stating that the price has finally broken out from a very long-term horizontal resistance area.
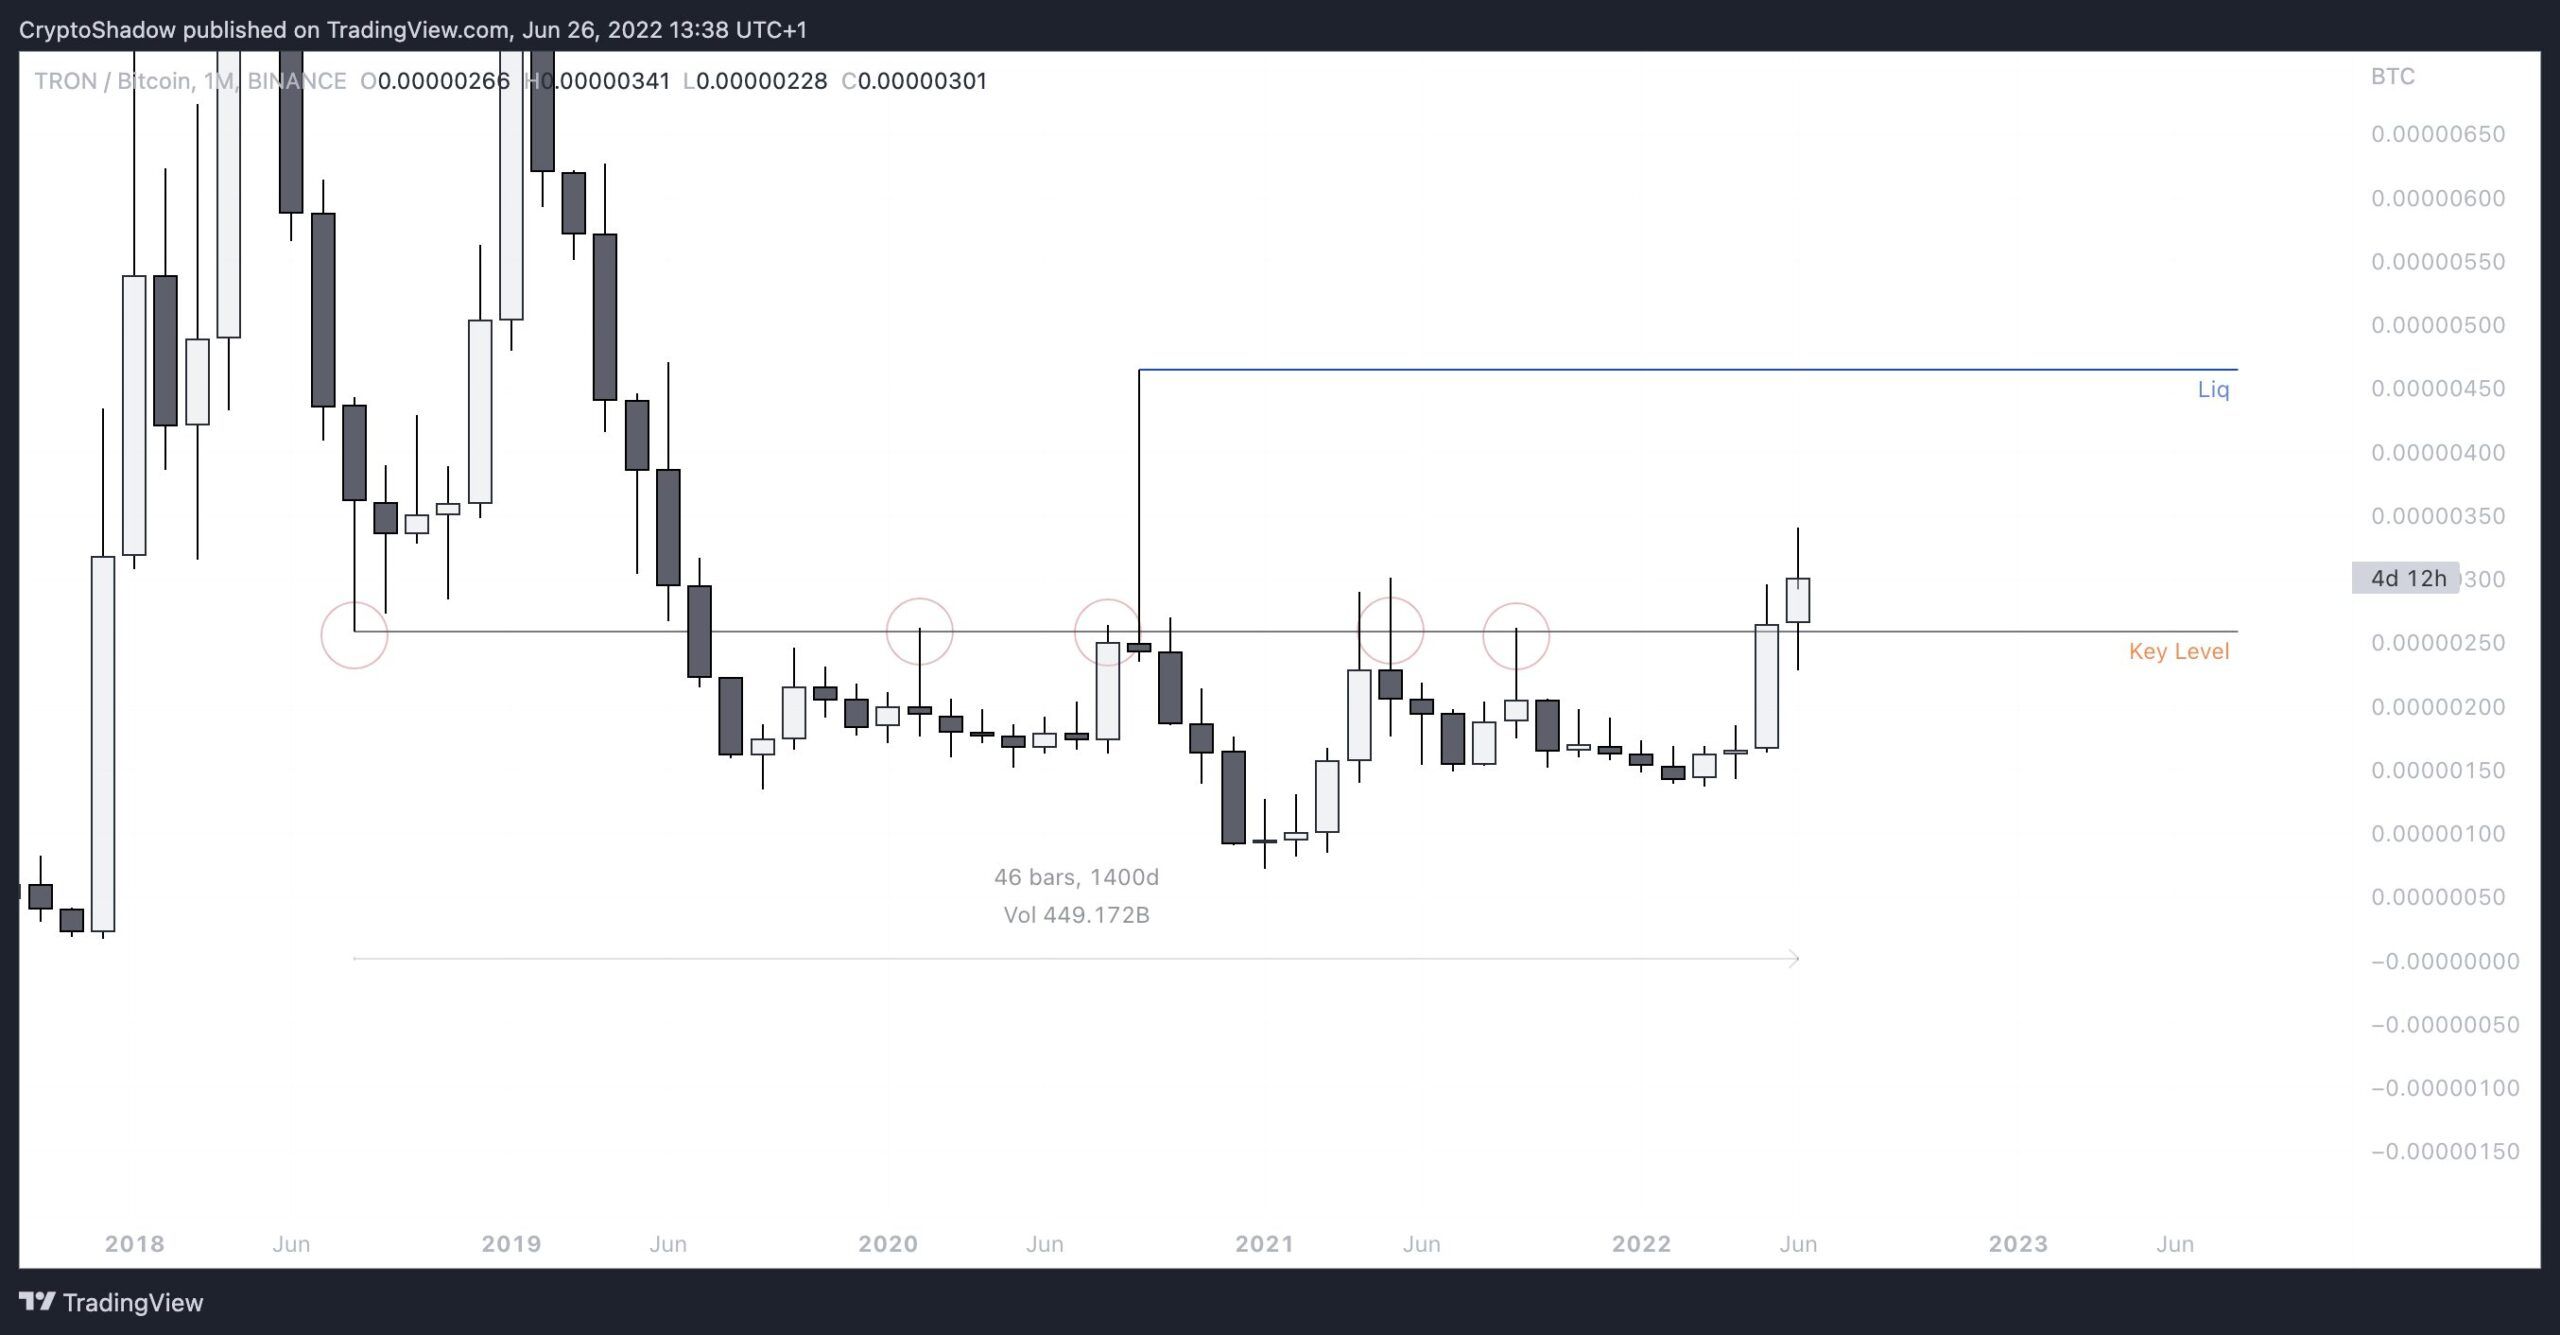
The long-term TRX/BTC chart is bullish for two main reasons.
Firstly, the price has broken out from a descending resistance line that had previously been in place since May 2018. Secondly, it has reclaimed the 300 satoshi horizontal area, which had been in place since Sept. 2018.
If the upward movement continues, the next closest resistance area would be at 460 satoshis.
For Be[in]Crypto’s latest bitcoin (BTC) analysis, click here
