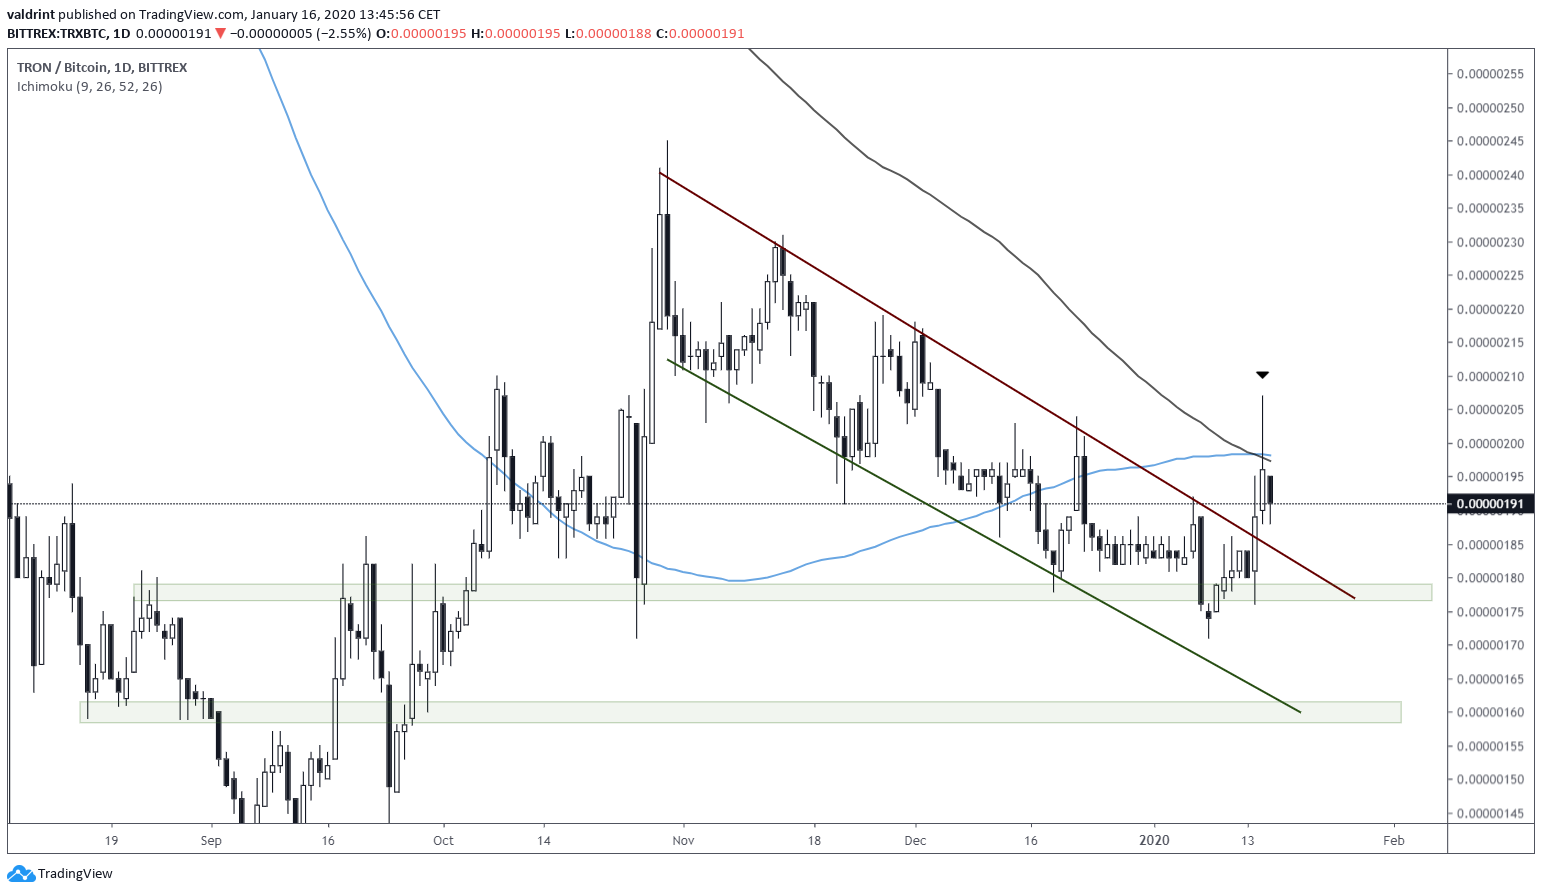
On January 14, the TRON (TRX) price broke out above the descending resistance line that has been in place for the past 77 days.
The TRON price has slightly decreased since the breakout — possibly indicating that it will consolidate inside a trading range before eventually continuing the upward movement.
Trader Crypto Krillin tweeted a TRX price chart announcing that the price has reached his target of 208 satoshis. Additionally, he stated that he has re-entered the trade at 195 satoshis in anticipation of another upward move.
$TRX
— krillin ॐ (@LSDinmycoffee) January 15, 2020
Straight to first target at 208!
Rest of the bag stopped at 200.
Re-entering now at 195.
Please don't disappoint us @justinsuntron. pic.twitter.com/8kJl8iX0Ki
TRON’s Channel Breakout
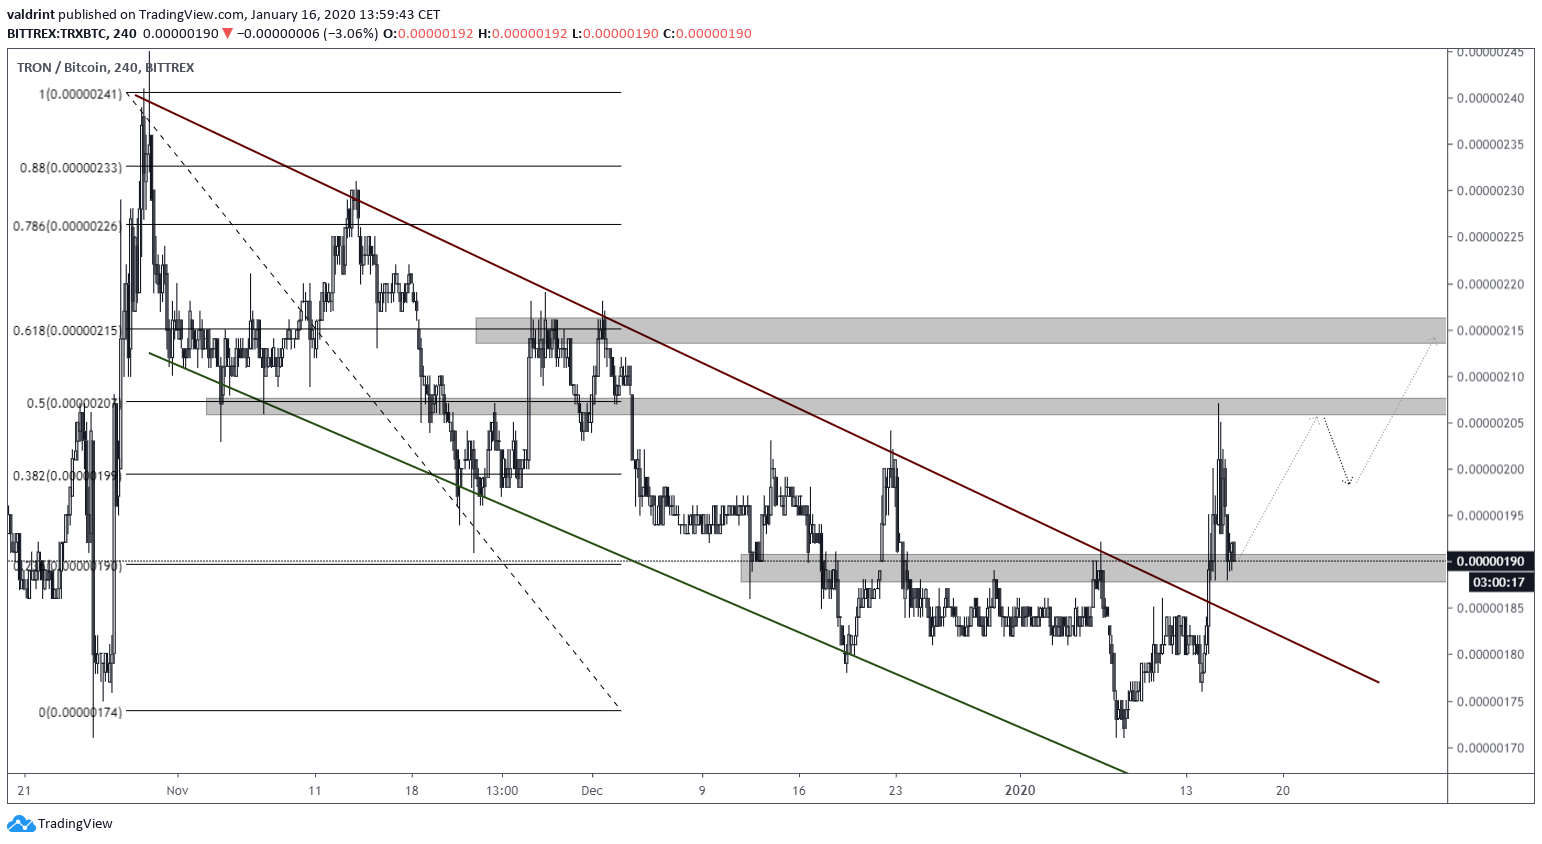
Since reaching a high of 245 satoshis on October 30, the TRX price has been decreasing — trading inside a descending channel. The price reached the 180 satoshi support area thrice and broke out afterward. The breakout likely marked an end to a 77-day downward trend. However, the price failed to move above the resistance provided by the 100- and 200-day moving averages (MAs). Once it got there, the price created a long upper wick and failed to reach a close above them. However, the MAs have made a bullish cross prior, possibly indicating that an upward trend has begun. After the breakout, it looks like the TRON price has retested the minor support area at 190 satoshis. A very common movement after a breakout, this could begin a consolidation between the support and resistance at 205 satoshis — followed by a breakout towards the next resistance area at 215 satoshis.

Future Movement
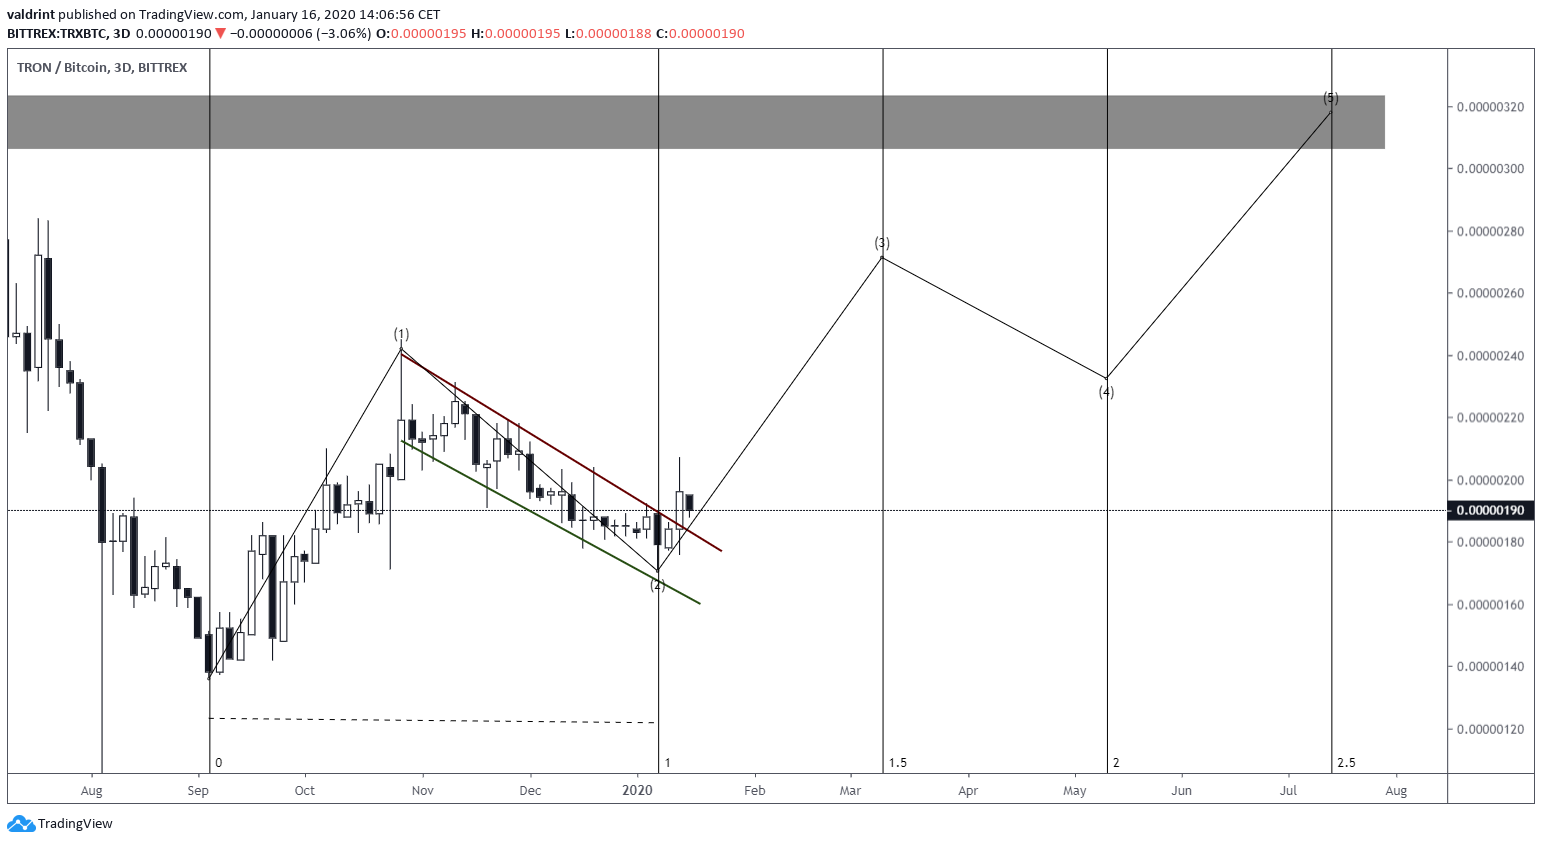
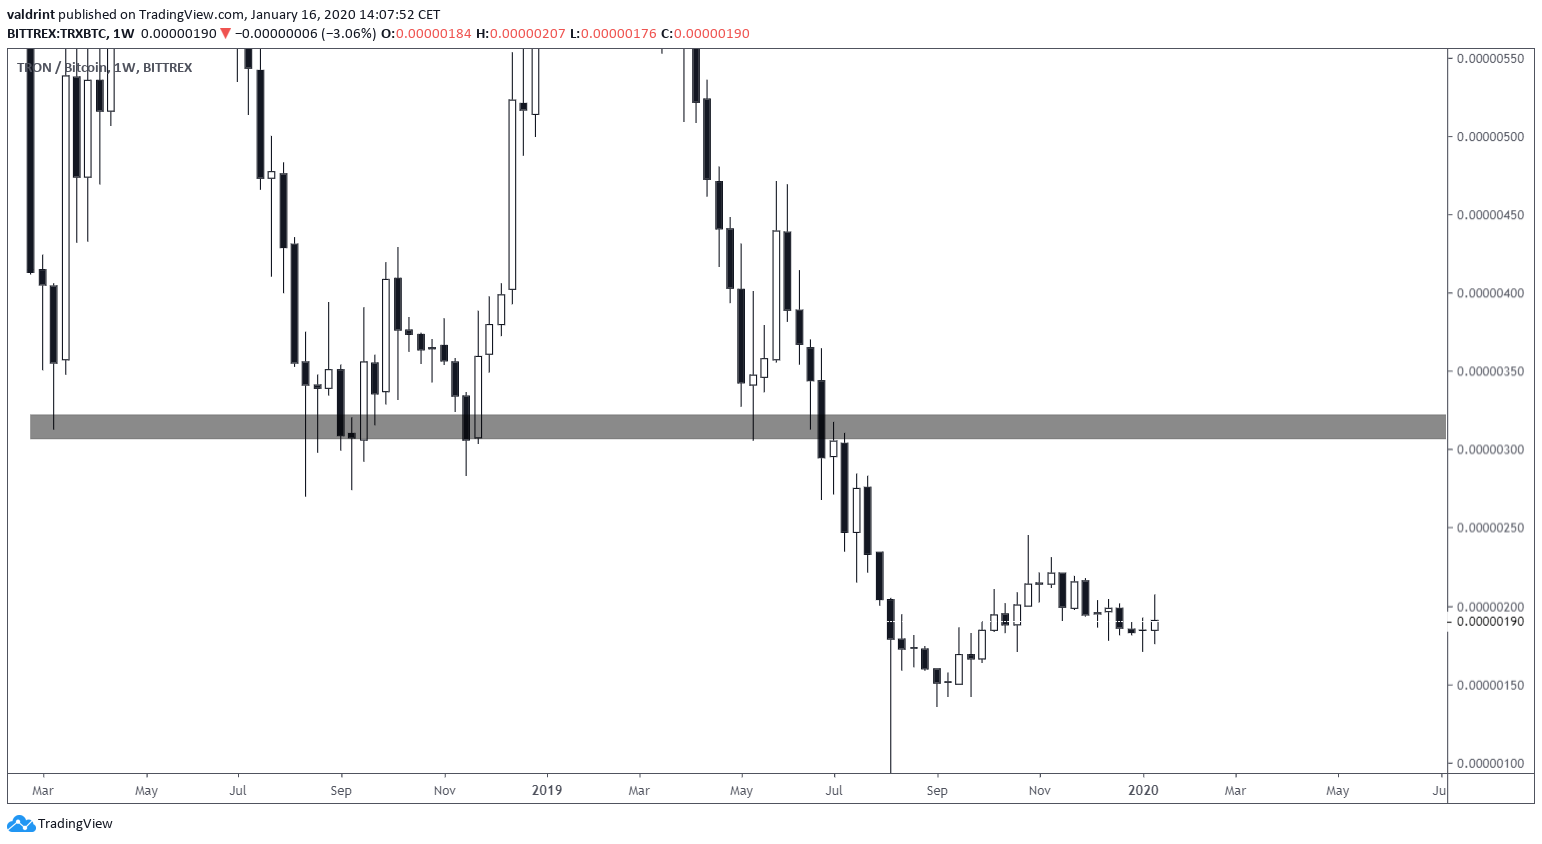
The breakout from the channel could have marked the end of the second wave, which was corrective. A rough outline of a five wave Elliott formation would take the price near 270 satoshis by the end of the third wave before the formation is completed at 320 satoshis. Using the length of the 1st and 2nd waves, targets for the 3-4-5 waves are given on March 11, May 12, and July 14, respectively. The 320 satoshi area holds tremendous importance since it was the previous breakdown level that acted as support throughout the entirety of 2018 until July 2019. As long as the TRON price stays below this level, we can consider the current movement retracements in response to a prior decrease.
Conversely, a price breakout above this level would confirm that a new bullish market cycle has begun.
 To conclude, the TRX breakout above the descending channel could have marked the end of the downward trend in place since October 30. A long-term target for the price is at 320 satoshis, a level that could be reached by July 2020.
Disclaimer
In line with the Trust Project guidelines, this price analysis article is for informational purposes only and should not be considered financial or investment advice. BeInCrypto is committed to accurate, unbiased reporting, but market conditions are subject to change without notice. Always conduct your own research and consult with a professional before making any financial decisions. Please note that our Terms and Conditions, Privacy Policy, and Disclaimers have been updated.

Valdrin Tahiri
Valdrin discovered cryptocurrencies while he was getting his MSc in Financial Markets from the Barcelona School of Economics. Shortly after graduating, he began writing for several different cryptocurrency related websites as a freelancer before eventually taking on the role of BeInCrypto's Senior Analyst.
(I do not have a discord and will not contact you first there. Beware of scammers)
READ FULL BIO
Sponsored
Sponsored

