


The Aptos (APT) price broke down from the $5.70 horizontal area in the middle of August. While it made an attempt at reclaiming it on September 25, it was unsuccessful at doing so.
The reaction to the $5.70 area is crucial for determining the future trend’s direction.
Aptos Fails to Reclaim $5.70 Level
The APT price has fallen under a descending resistance trendline since June. Such lines measure the slope of the decrease and suggest that the trend is bearish until the price breaks out.
More recently, Aptos was rejected by the trendline on August 9 (red icon) and accelerated its fall. This culminated with a low of $4.93 eight days later.
The decrease was important because it caused a breakdown from the $5.70 area, which had provided support since June. After such breakdowns, horizontal support areas provide resistance.
This was the case on September 25, when the resistance area thwarted an attempt at reclaiming the area.
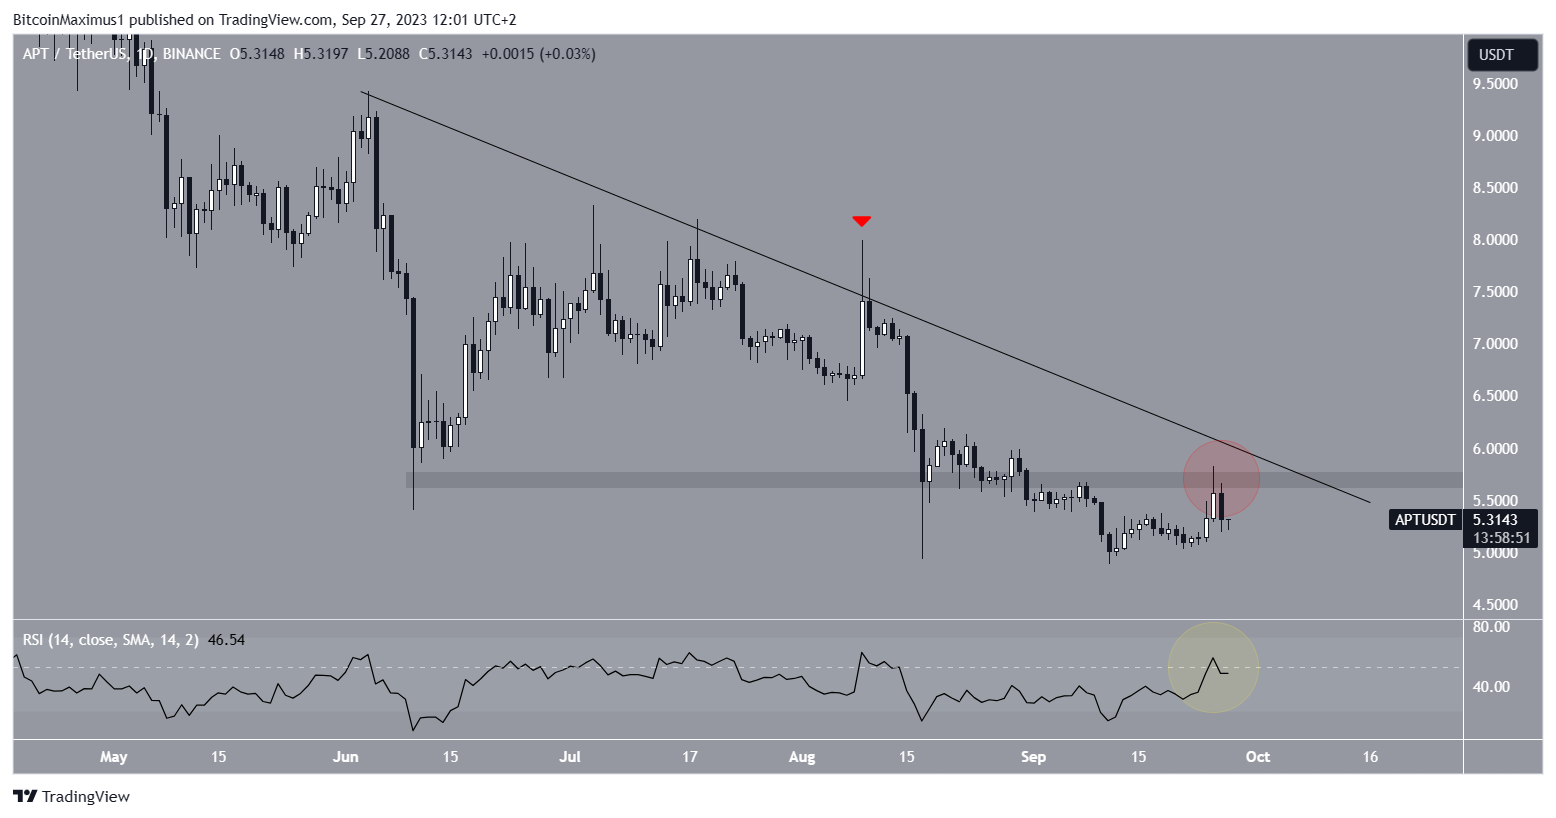
The daily RSI also provides a bearish outlook. The RSI is a momentum indicator used by traders to evaluate whether a market is overbought or oversold and to determine whether to accumulate or sell an asset.
Readings above 50 and an upward trend suggest that bulls still have an advantage, while readings below 50 indicate the opposite. The indicator was rejected at the 50 trendline (yellow circle) and has fallen slightly.
APT Price Prediction: Where to Next?
Since the $5.70 area has been in place for such a long period of time, whether the price reclaims it or falls below it will be key in determining the future trend.
If the altcoin reclaims it, its proximity to the descending resistance trendline will mean that a breakout from the trendline will also be likely. In that case, Aptos will confirm that the correction is complete.
If that happens, the next major resistance will be at $8, 50% above the current price.
On the other hand, failure to reclaim the area will likely lead to a continuing decrease towards the yearly low of $3. This will be a drop of 40%, measuring from the current price.
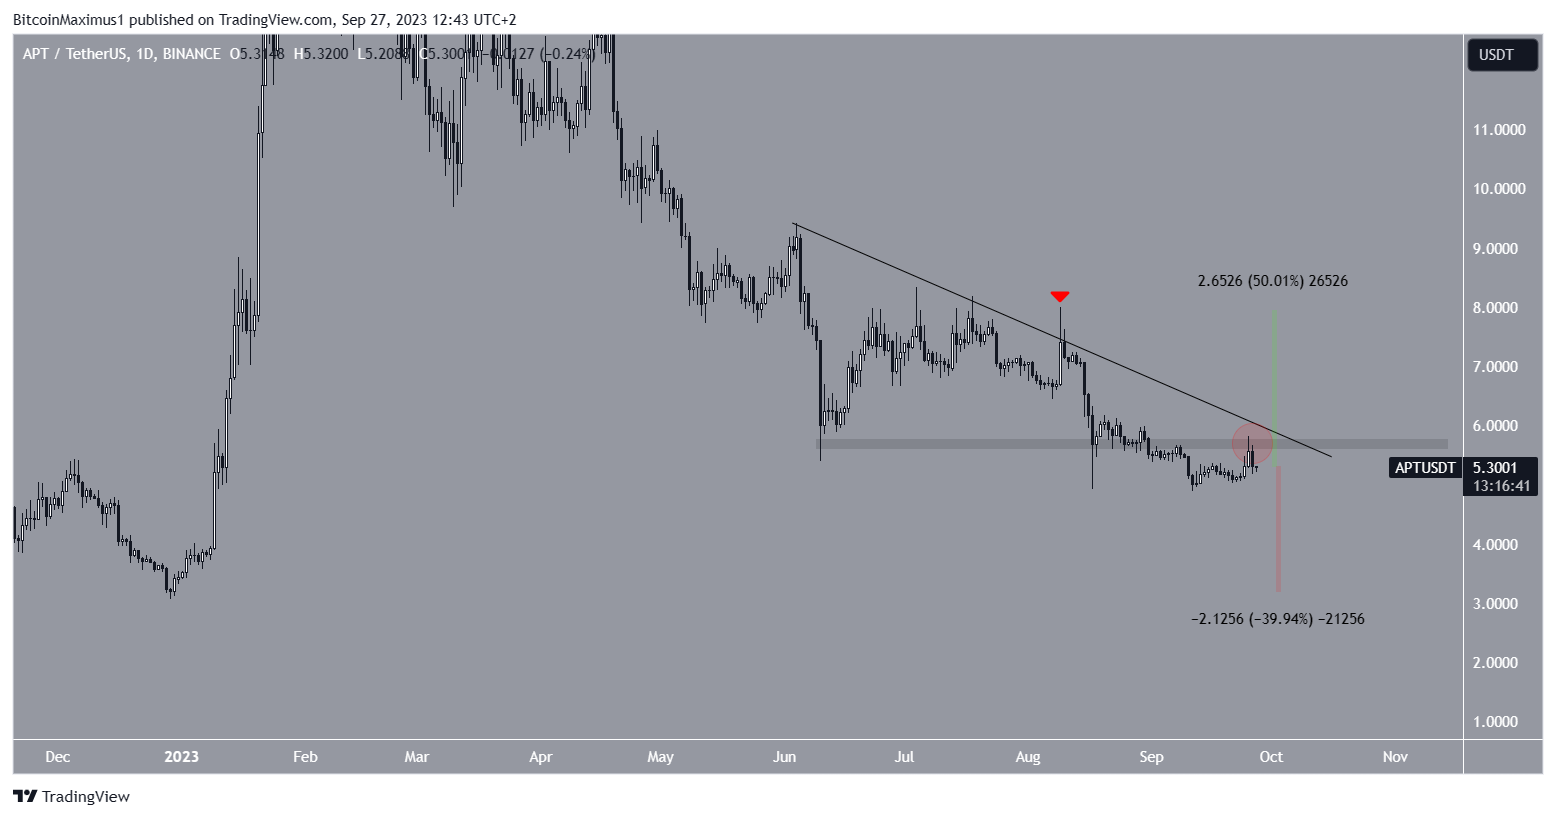
To conclude, the APT price prediction will determine whether the price reclaims the $5.70 area or gets rejected by it once more.
A reclaim can lead to a 50% increase, while a breakdown could lead to a 40% drop.
Read More: Best Crypto Sign-Up Bonuses in 2023
For BeInCrypto’s latest crypto market analysis, click here.


