

BeInCrypto takes a look at the eight altcoins that decreased the most over the past seven days, from April 16 to April 23.
These altcoins are:
- XTZ – 35.47%
- IOST – 34.67%
- GRT – 33.9%
- CHZ – 33.74%
- CRO – 33.71%
- AVAX – 33.69%
- RVN – 33.07%
- ONE – 33.06%
XTZ
XTZ has been decreasing since April 17, when it reached an all-time high price of $7.68. The drop has been sharp, taking XTZ back to the $4.50 support area. The drop was preceded by bearish divergence in the weekly RSI.
Despite the decrease, both the MACD and Stochastic oscillator are still bullish. As long as the token is trading above $4.50, the long-term trend can be still considered bullish.

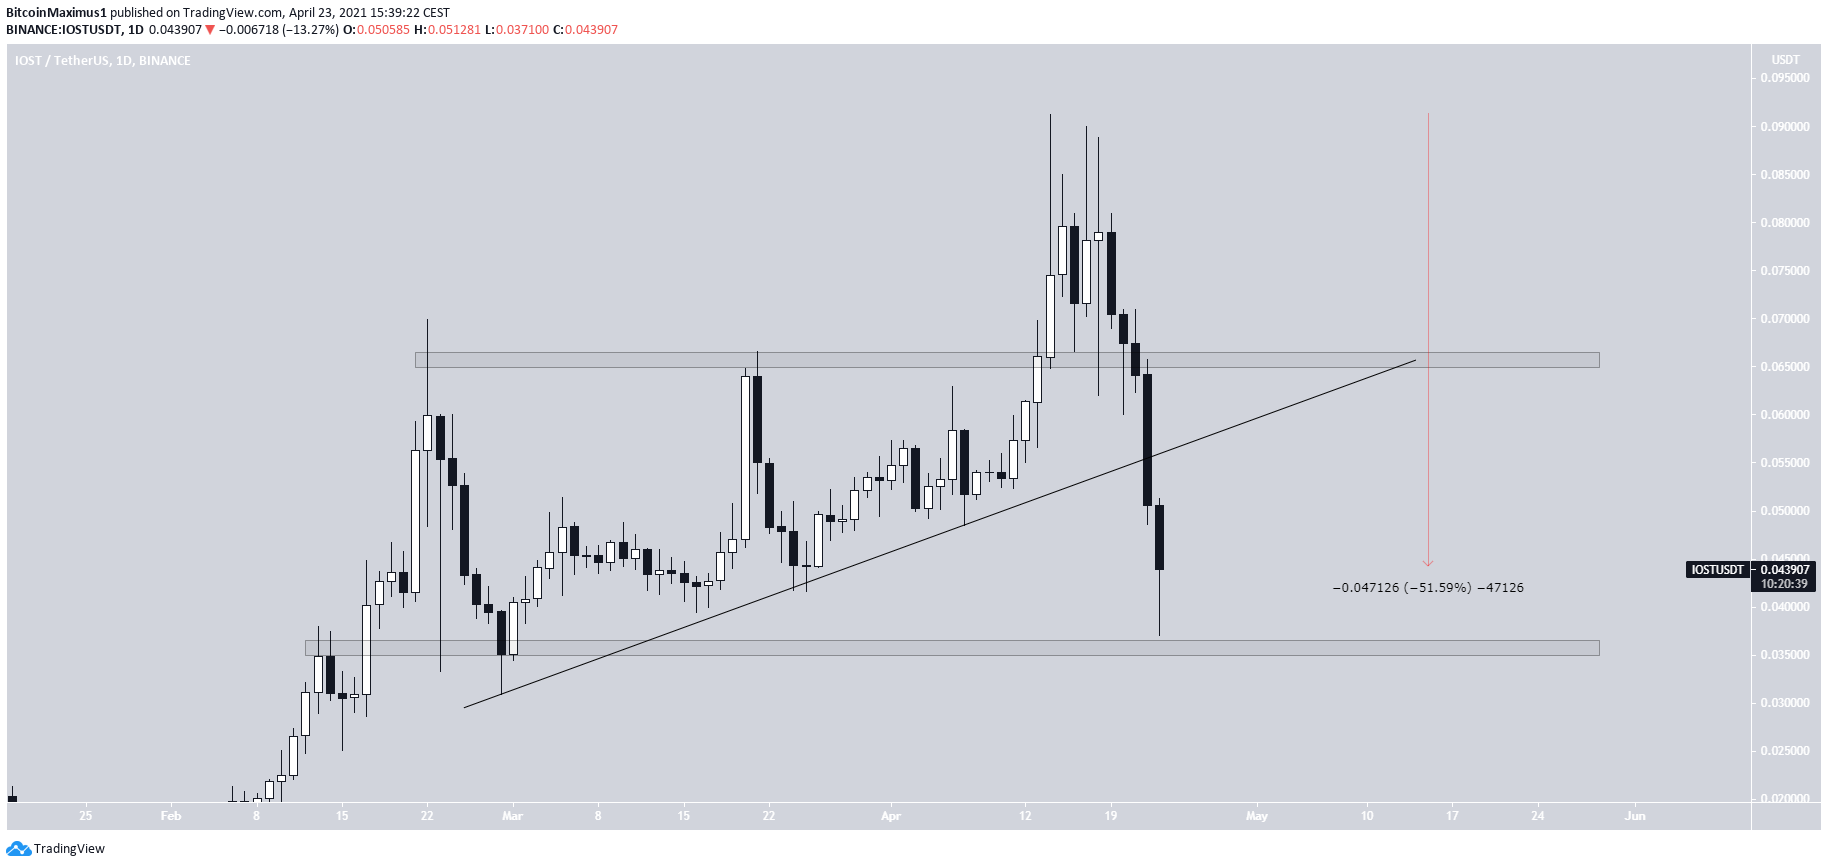
IOST
IOST has been decreasing since April 14, when it had reached a high of $0.091. The drop was sharp, initially causing a breakdown from the $0.065 area. Afterwards, IOST also broke down from an ascending support line. So far, it has decreased by 51.59%.
The closest support area is found at $0.035. The token has reached it and initiated a slight bounce.
Nevertheless, unless this support line and $0.065 area is reclaimed, the trend is considered bearish.
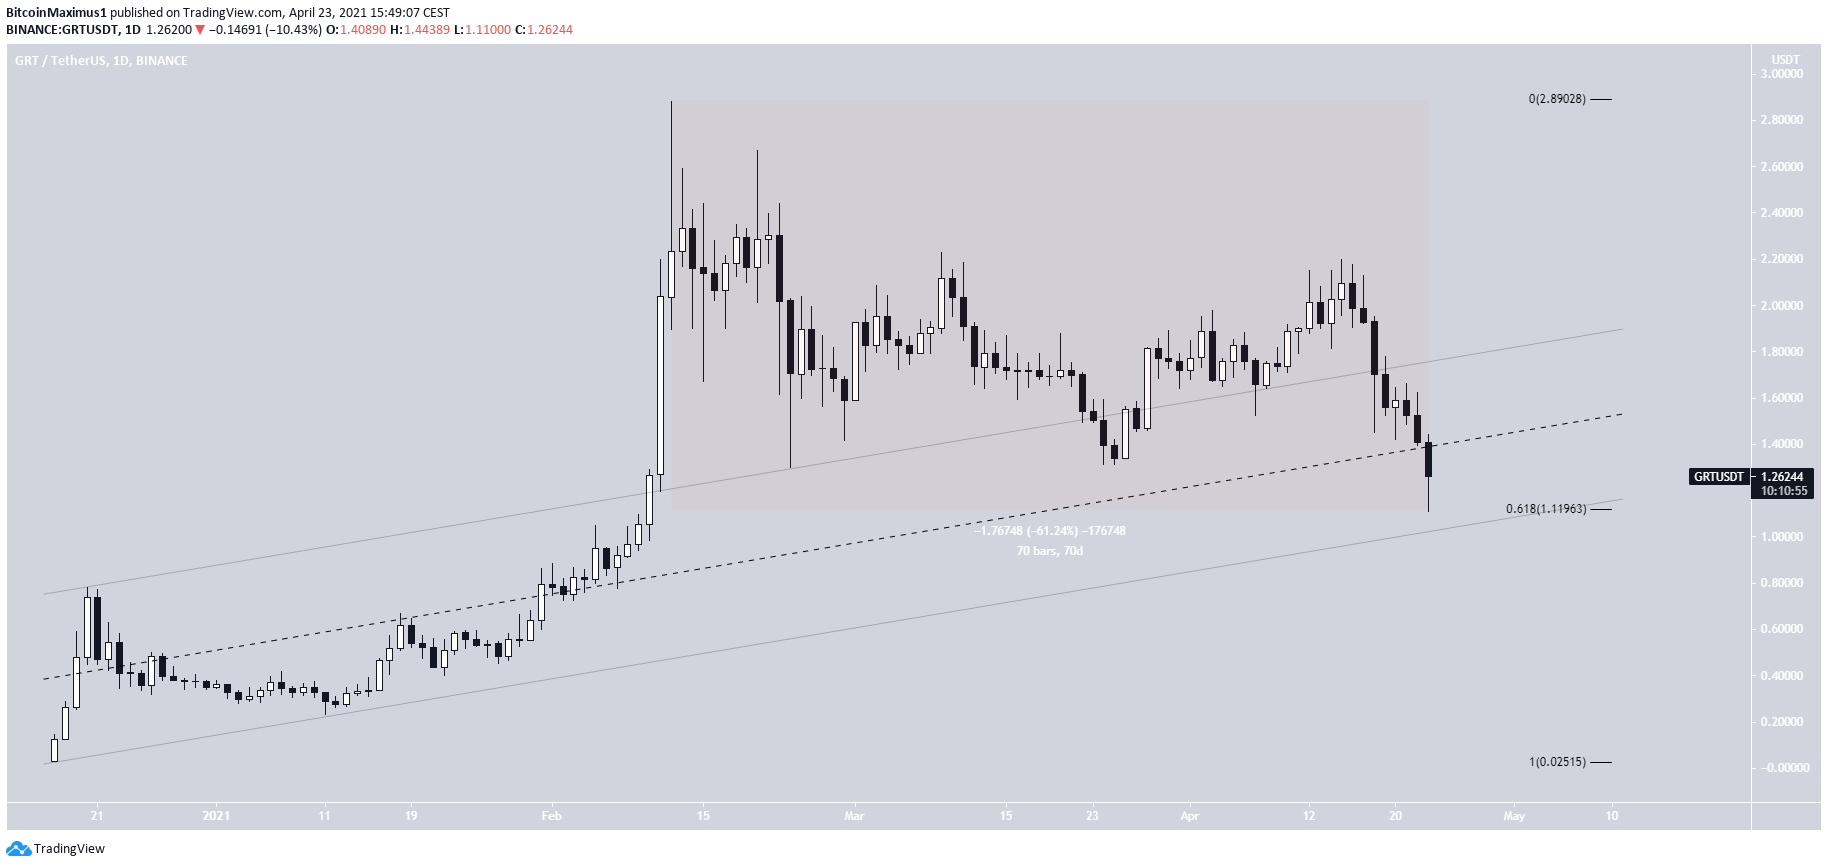
GRT
GRT has been decreasing over the past 70 days, more specifically since it reached an all-time high price of $2.88. While the decrease has been significant, since the token has lost 61.24% of its value, it looks corrective, due to the frequent overlap.
Furthermore, GRT is still trading inside a channel that is created connecting the original two higher lows.
Finally, it has bounced at the 0.618 Fib retracement support level.
Therefore, despite the ongoing decrease, GRT is trading above a number of strong support levels.
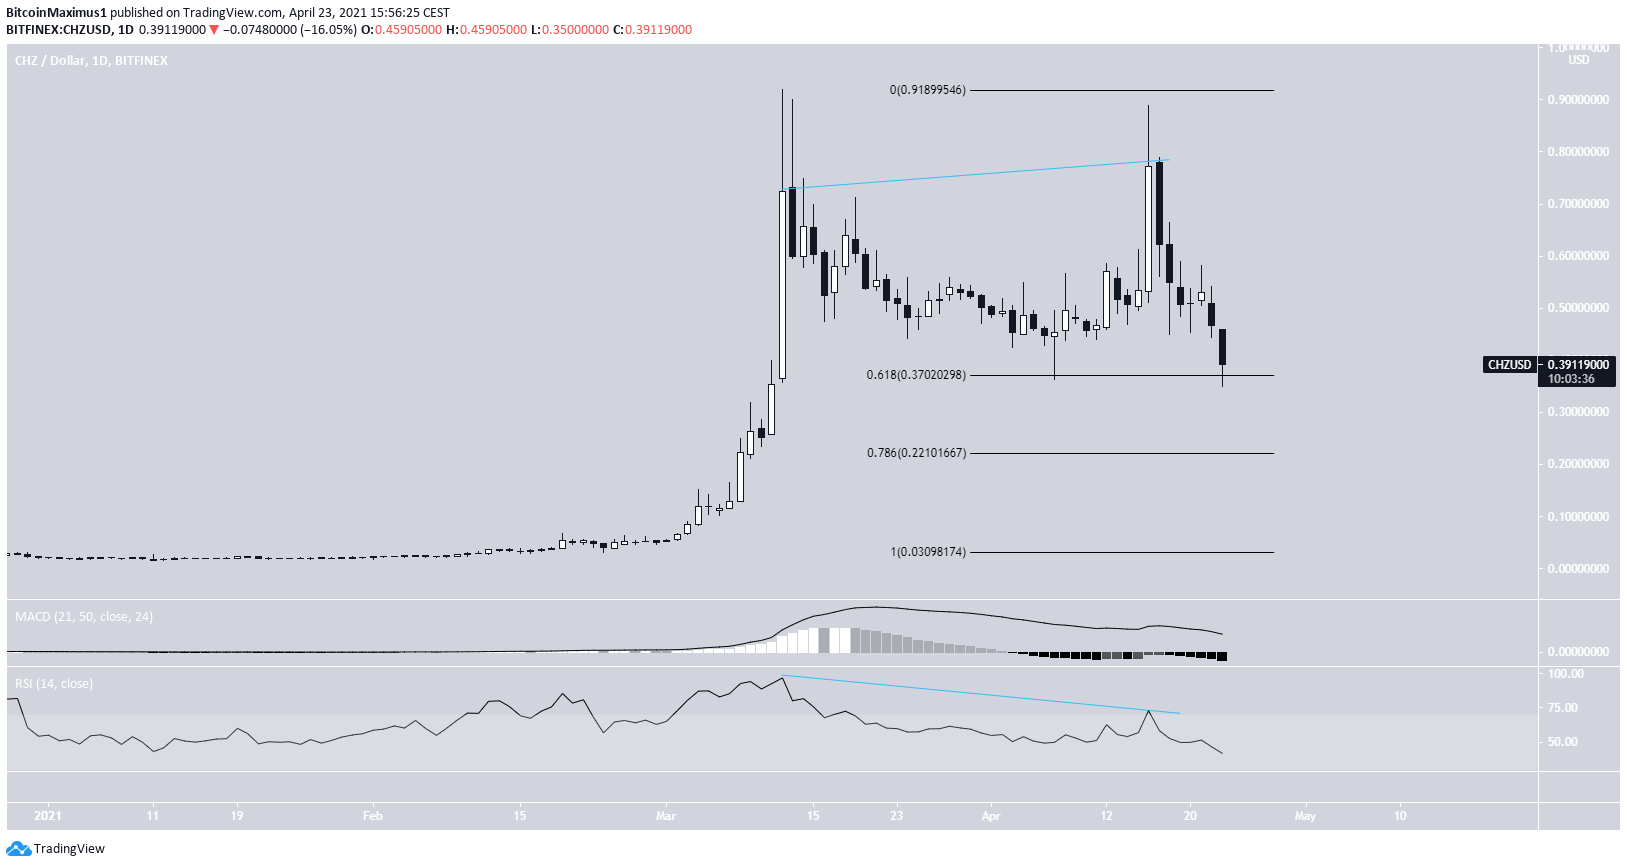
CHZ
On March 12, CHZ reached a new all-time high price of $0.92. However, it began a gradual downward movement afterwards.
The second upward movement was weaker than the first, ending with a high of $0.89, reached on April 16. This created a double top pattern, in which both highs had long upper wicks.
Currently, CHZ is trading just above the 0.618 Fib retracement support level at $0.37. If it breaks down, the next support is found at $0.22.
Technical indicators are bearish, supporting the continuation of the downward movement.
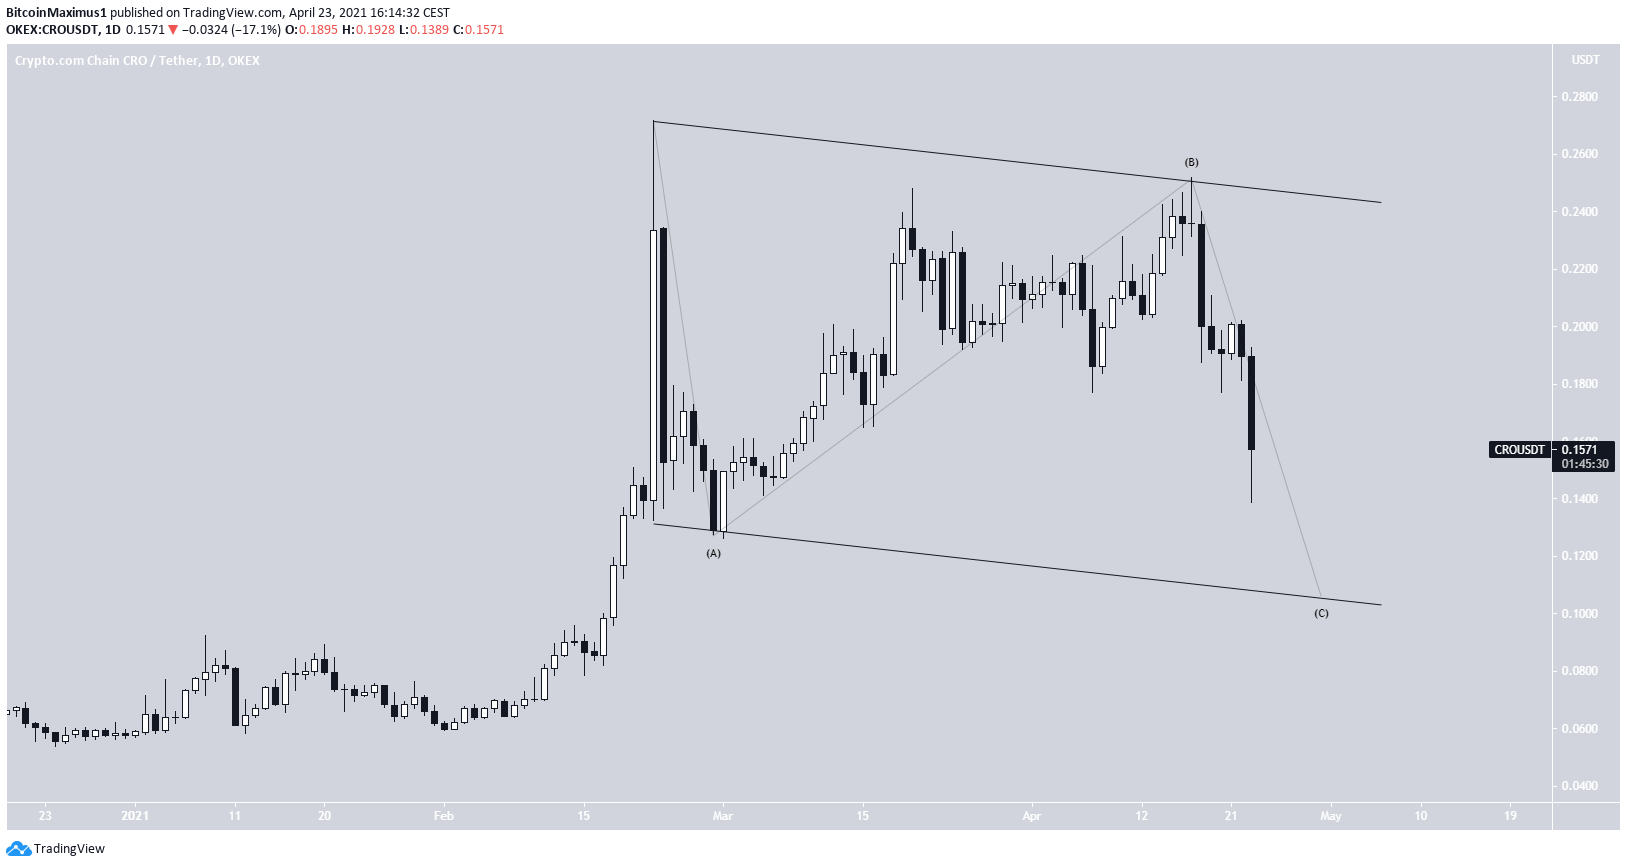
CRO
On Feb. 22, CRO managed to reach a new all-time high price of $0.271. After a sharp drop, it began another upward movement which was weaker.
CRO failed to reach a new high, only managing a high of $0.251, reaching it on April 17.
The entire movement looks like a flat A-B-C corrective structure. If so, CRO could decrease all the way to $0.106, giving waves A:C a 1:1 ratio.
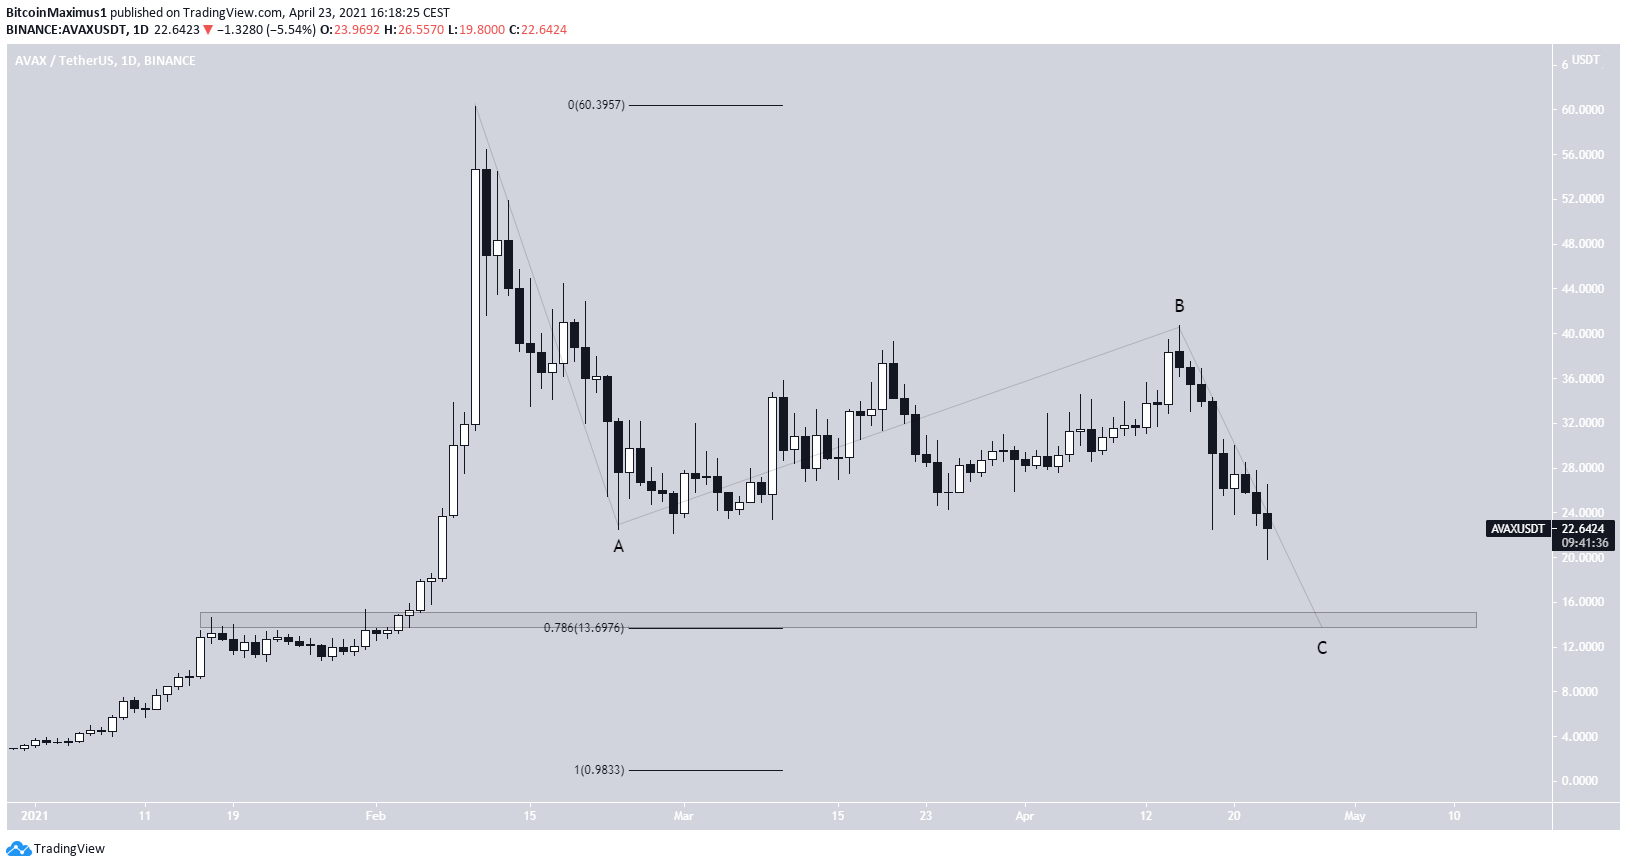
AVAX
AVAX has been moving downwards since reaching an all-time high price of $60.30 on Feb. 10. While it initiated a bounce on Feb. 23, it has been weak so far.
On April 15, it began another downward movement which is still ongoing.
Similarly to CRO, AVAX seems to be completing an A-B-C corrective structure, which would take it down to the $13.70 area, which is the 0.786 Fib retracement level of the entire upward movement.
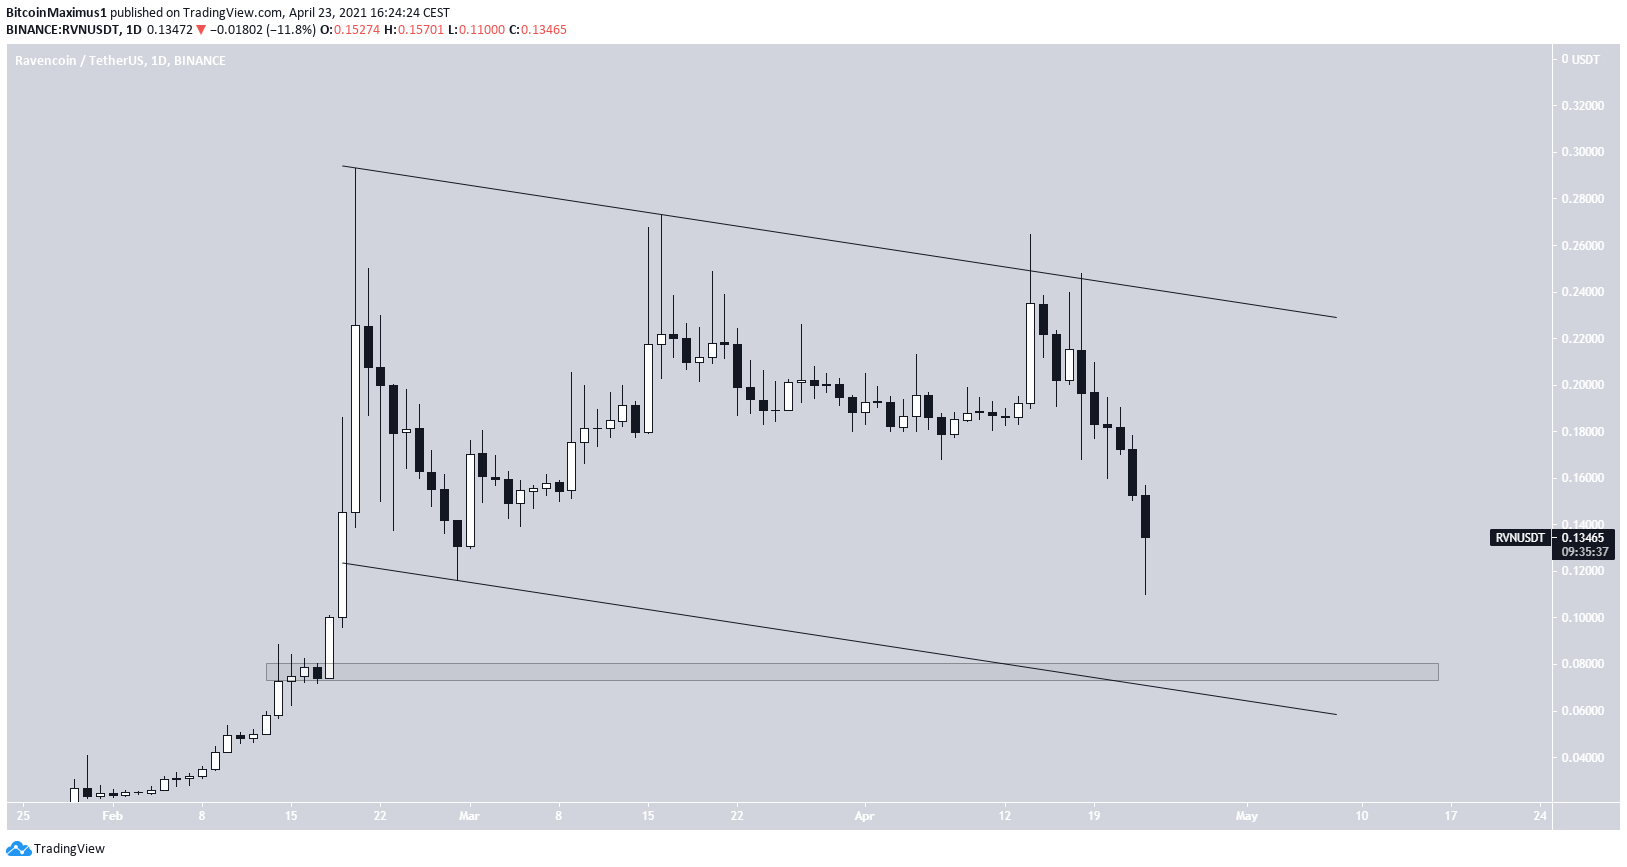
RVN
On Feb. 20, RVN reached an all-time high price of $0.292 before decreasing sharply. The ensuing upward movements were weaker, creating two lower highs in the process.
Since April 14, RVN has been moving downwards at an accelerated rate.
It is possible that the token is trading inside a descending parallel channel, which is often a corrective movement.
The support line of the channel is found at $0.075, also coinciding with a horizontal support area.
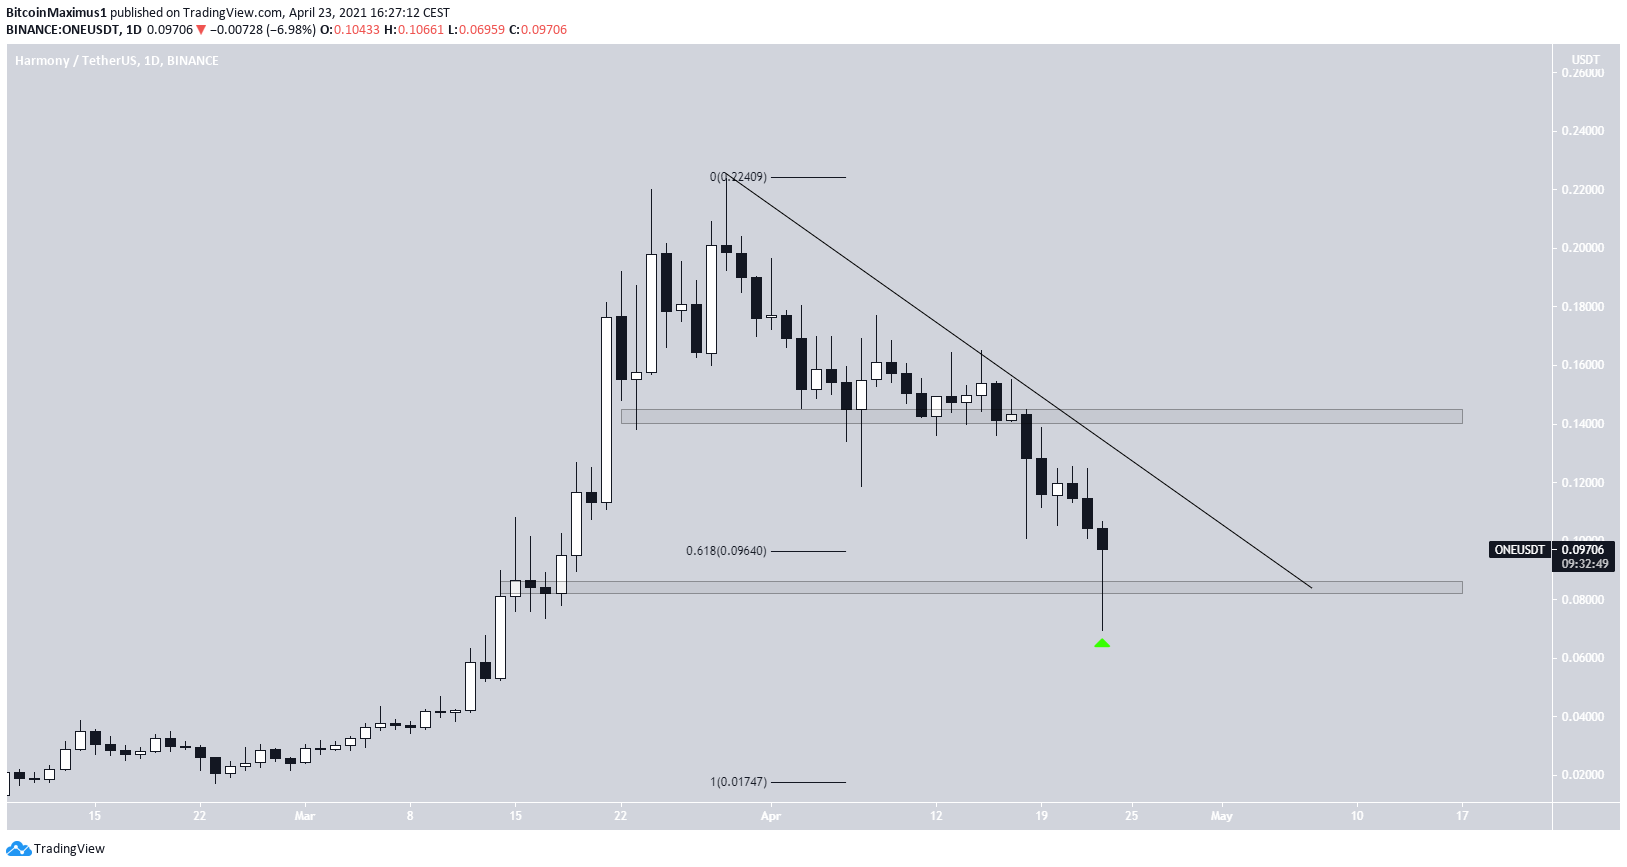
ONE
ONE has been moving downwards since March 29, when it reached an all-time high price of $0.224. The same day, it created a shooting star candlestick.
On April 13, it reached a low of $0.069. It bounced immediately afterwards, creating a long lower wick. Currently, it is trading right at the 0.618 Fib retracement level at $0.096.
Nevertheless, the trend is considered bearish until ONE breaks out from the current descending resistance line. If so, the next resistance area would be found at $0.0142.
For BeInCrypto’s latest bitcoin (BTC) analysis, click here.
Trusted
Disclaimer
In line with the Trust Project guidelines, this price analysis article is for informational purposes only and should not be considered financial or investment advice. BeInCrypto is committed to accurate, unbiased reporting, but market conditions are subject to change without notice. Always conduct your own research and consult with a professional before making any financial decisions. Please note that our Terms and Conditions, Privacy Policy, and Disclaimers have been updated.
