


While most of the cryptocurrency market is in a significant bullish trend, as evidenced by new all-time highs in bitcoin (BTC) and ethereum (ETH), some coins have fallen dramatically over the past week.
In this article, we will look at the eight coins that have decreased the most over the past seven days (Feb 12 – 19).
They are:
- Avalanche (AVAX) – 21.98%
- Curve Dao Token (CRV) – 21.88%
- Synthetix (SNX) – 16.2%
- Dogecoin (DOGE) – 15.71%
- Aave (AAVE) – 14.92%
- 0x (ZRX) – 14.42%
- 1inch (1INCH) – 14.36%
- The Graph (GRT) – 14.31%
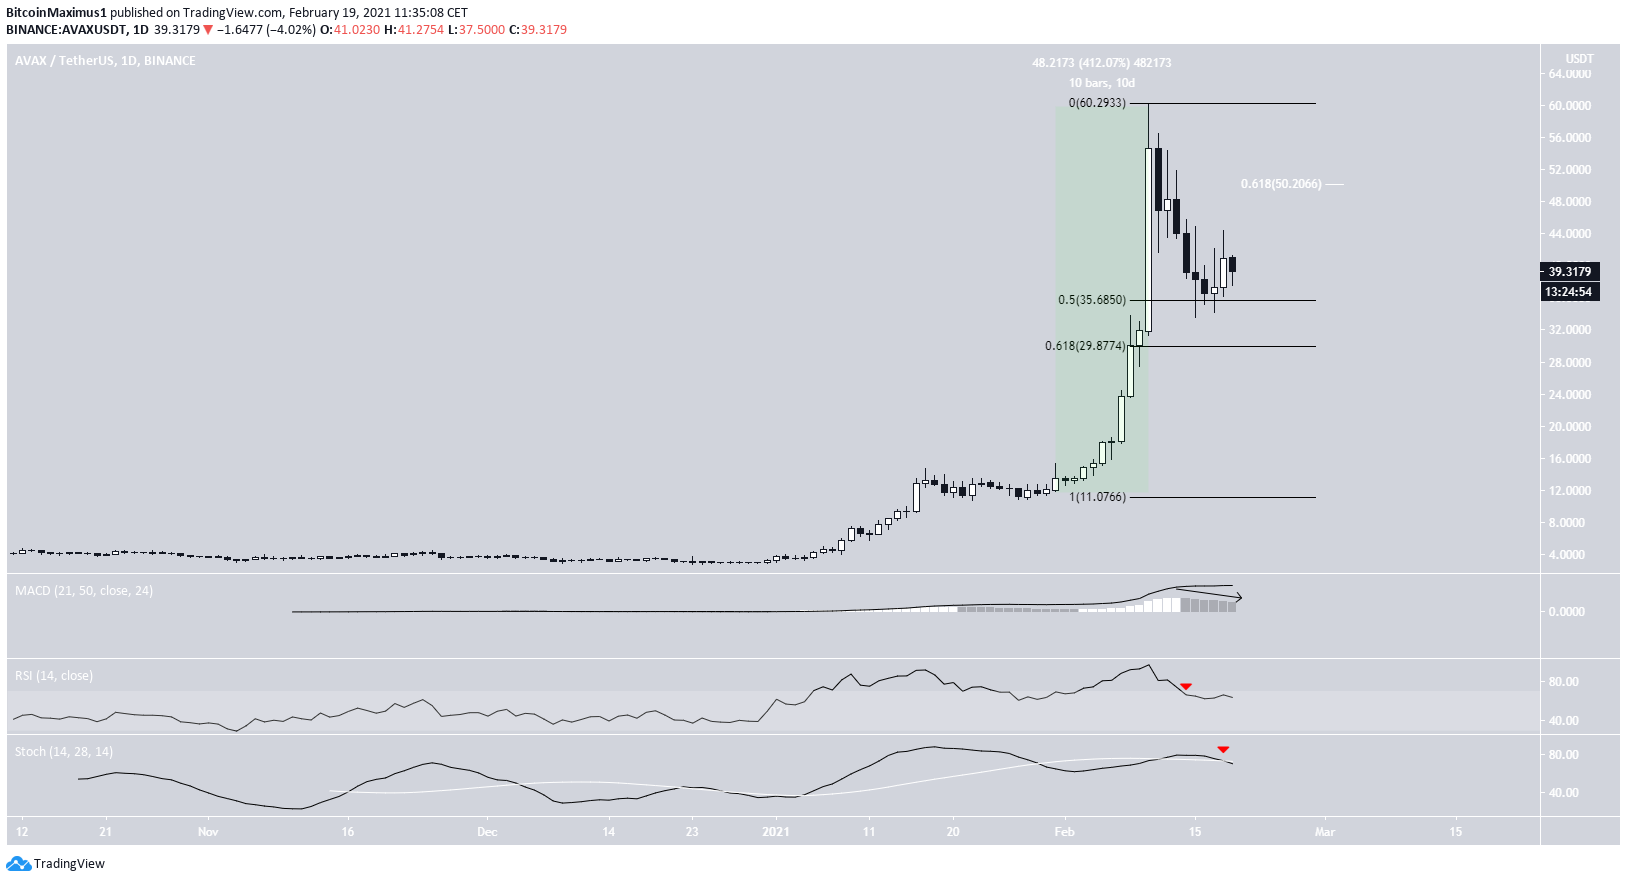
1. Avalanche (AVAX)
AVAX had been moving upwards rapidly since Jan. 31, increasing by 412% and reaching an all-time high of $60.29 in the process.
However, it has been falling since, dropping all the way to the 0.5 Fib retracement level at $35. It bounced after this, but the bounce has been weak so far, with AVAX failing to reach the 0.618 Fib (white) level of the decrease.
Technical indicators are bearish, evident by the RSI cross below 70 and the bearish cross in the Stochastic oscillator. If AVAX were to continue falling, the next closest support area would be $29.90, the 0.618 Fib retracement level of the most recent upward move.
Setting the charts aside, AVAX announced a partnership with Injective Protocol (INJ) on Feb. 18, in a move that could be seen as positive news by potential investors.
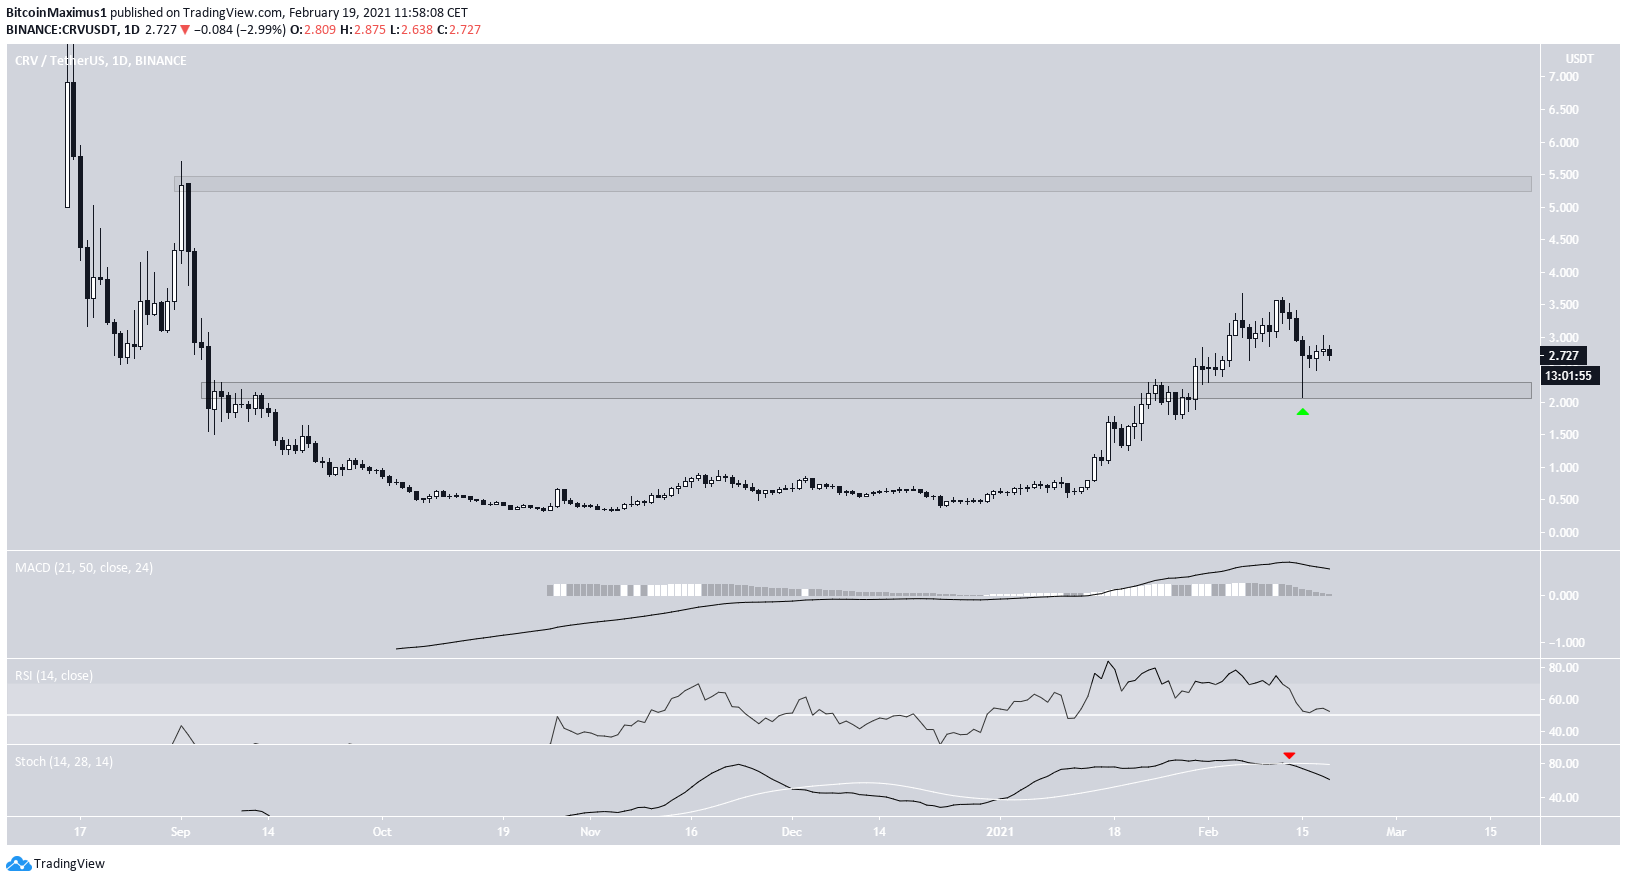
2. Curve Dao Token (CRV)
CRV has been decreasing since Feb. 12, when it reached a high of $3.61. The decrease continued until Feb. 15, when it reached a low of $2.08 (green arrow).
However, this served to validate the $2.10 area as support, a level that previously acted as resistance until CRV managed to break out. Furthermore, the retest left a long lower wick in its wake, a sign of buying pressure.
While technical indicators are bearish, as evidenced by the bearish cross in the Stochastic oscillator and the MACD moving towards negative territory, the price action can be considered bullish as long as CRV is trading above $2.10.
If CRV manages to bounce, the next resistance area would be at $5.40.
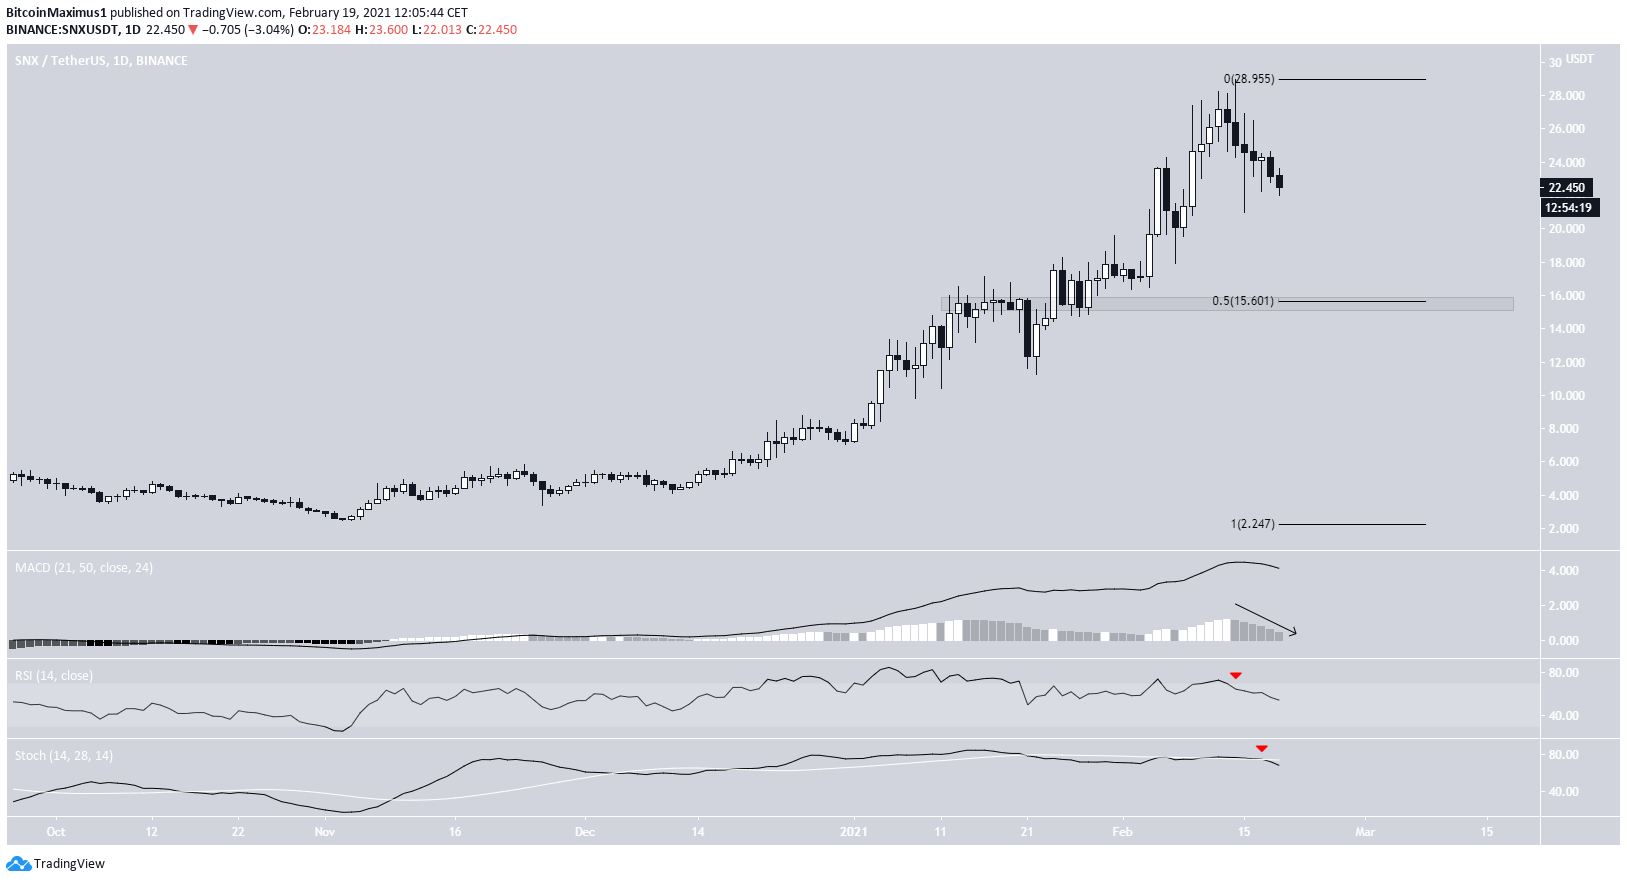
3. Synthetix (SNX)
SNX has been decreasing since reaching an all-time high price of $28.98 on Feb. 14. The decline has been swift, and SNX is currently trading at $22.45. The closest support area is at $15.60, both a horizontal support area and the 0.5 Fib retracement level of the most recent upward movement.
Technical indicators are bearish, as evidenced by the bearish cross in the Stochastic oscillator and the RSI cross below 70. Therefore, it’s likely that SNX continues falling until it reaches this support level.
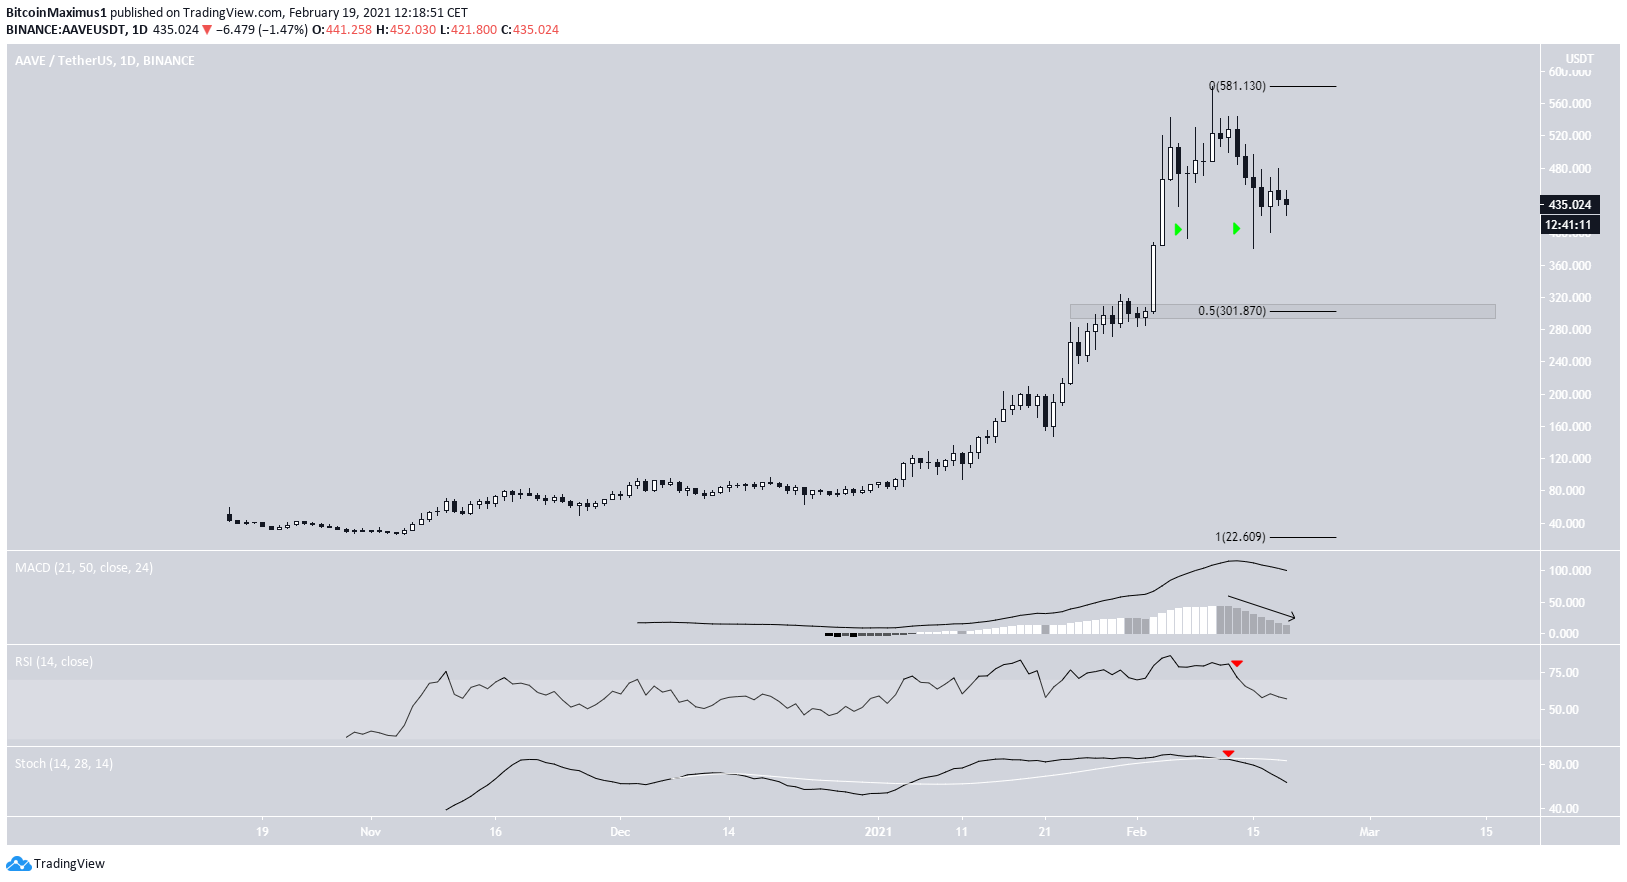
4. Aave (AAVE)
AAVE has been moving downwards since reaching an all-time high price of $581 on Feb. 10. It reached a low of $380 on Feb. 15. While AAVE has undergone a slight bounce since then, it has been weak, and technical indicators are bearish.
The RSI has crossed below 70 and is close to dropping below 50. The Stochastic oscillator has made a bearish cross, and the MACD has nearly crossed into negative territory.
Therefore, AAVE should continue decreasing towards $310, both a horizontal support level and the 0.5 Fib retracement of the most recent upward movement, which has become parabolic.
Despite the price decrease, there was positive news for AAVE last week (Feb 8 – 12) due to a partnership with EnigmaMPC. Their goal is to bring secret contracts to decentralized lending.
5. Dogecoin (DOGE)
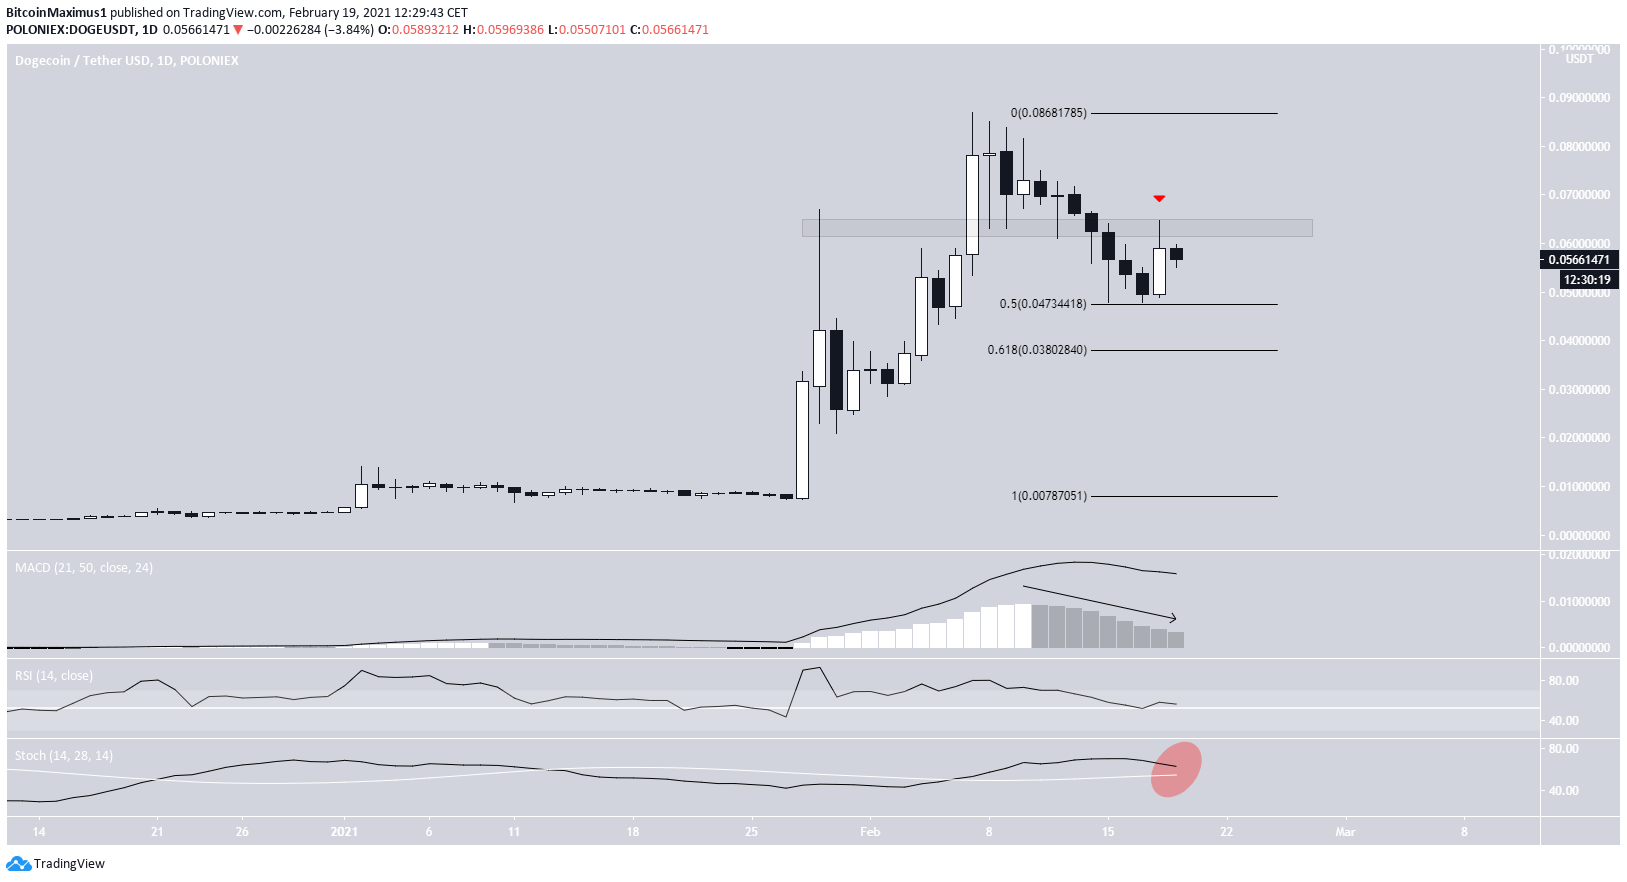
DOGE has been moving downwards since Feb. 7, when it reached a high of $0.086. The drop has taken DOGE to a low of $0.047, doing so on Feb. 15.
It’s possible that this tweet from Elon Musk, criticizing the centralized nature of the cryptocurrency, had a negative impact on its price. While DOGE has bounced since, it has failed to clear the previous support area at $0.065, which should now act as resistance.
Despite the RSI bounce at the 50 line, technical indicators are bearish, and a bearish cross in the Stochastic Oscillator would confirm the bearish trend. If DOGE breaks down below the $0.047 support area, the next one would be at $0.037.
6. 0x (ZRX)
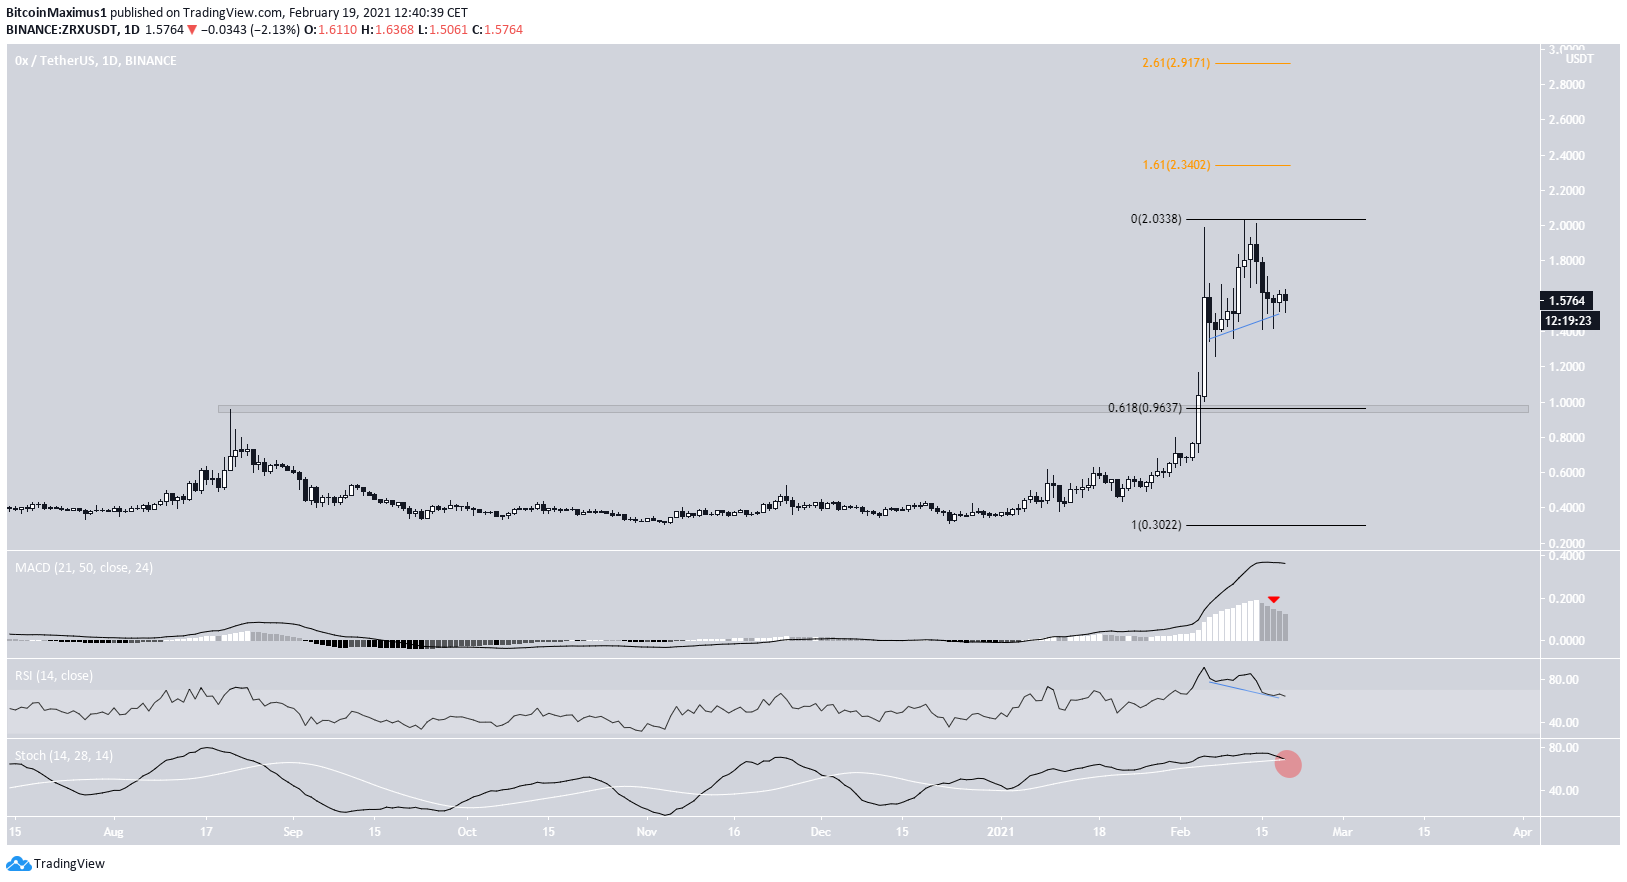
ZRX has been decreasing since Feb. 12, when it reached a high of $2.03. Despite the decline, trading volume throughout the 0x protocol has been steadily increasing. If ZRX were to continue falling, the next resistance area would be at $0.96, the 0.618 Fib retracement level of the most recent rally, and a horizontal support area.
However, technical indicators are not entirely bearish. While the Stochastic oscillator is close to making a bearish cross, it has not yet done so, allowing for a possible cross rejection. In that case, ZRX would likely bounce afterward.
Furthermore, there is considerable hidden bullish divergence in the RSI, a sign of trend continuation.
Thus the movement in Feb. may have been a part of a running flat correction, after which ZRX should increase. If so, the next closest resistance areas would be at $2.34 and $2.91, respectively.
7. 1Inch (1INCH)
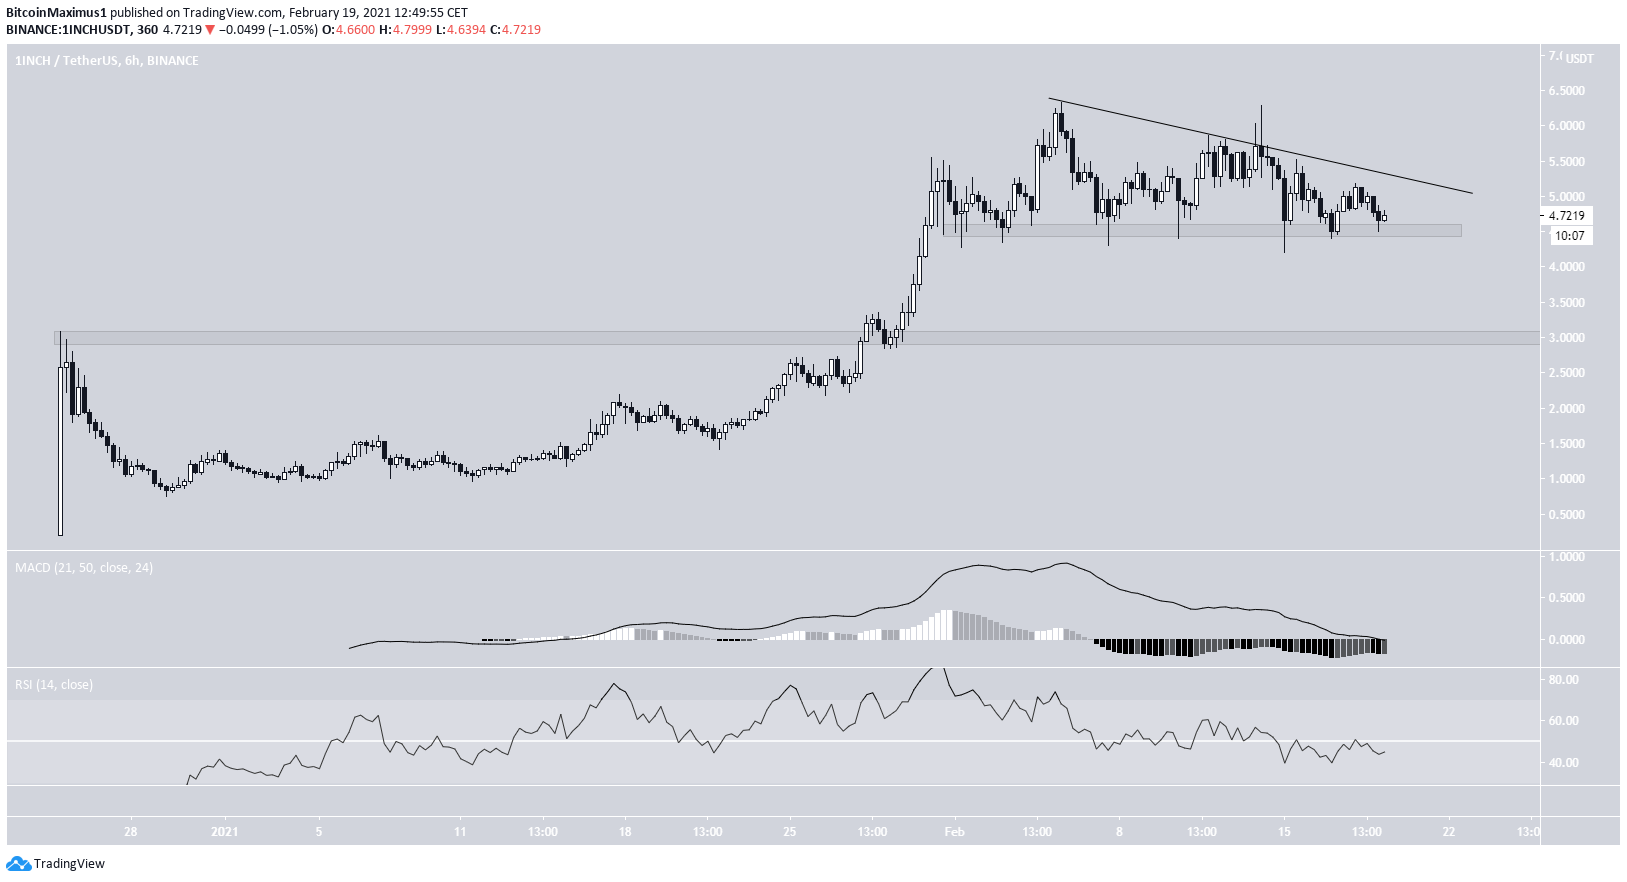
1INCH has been moving downwards since Feb. 5, when it reached an all-time high price of $6.33. 1INCH is currently resting just above the $4.50 support area, potentially trading inside a descending triangle.
Technical indicators are neutral/bearish, and when considering that the descending triangle is a bearish pattern, the most likely move from here would be a breakdown. If one occurs, the closest support area would be at $3.00.
Nevertheless, the lack of price data before 2021 makes it difficult to hypothesize a future price movement.
8. The Graph (GRT)
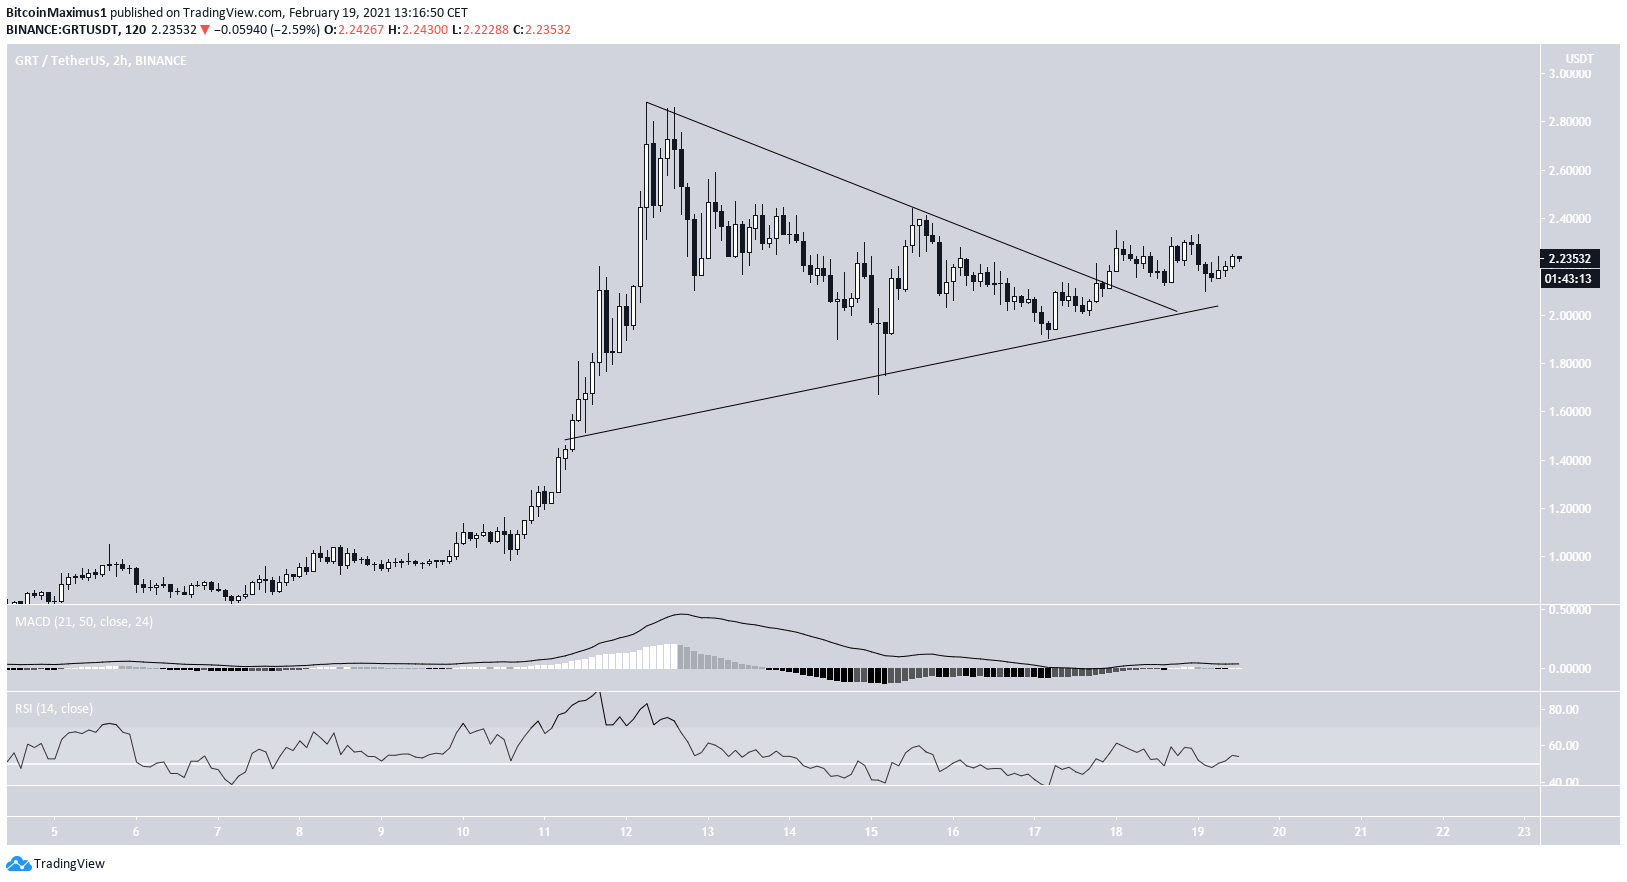
GRT has been moving downwards since it reached an all-time high of $2.88 on Feb. 12. Throughout the decline, GRT has been trading inside a symmetrical triangle, from which it broke out on Feb. 17.
Technical indicators are relatively bullish, suggesting that the GRT price is likely to rally and make another attempt at a new all-time high. GRT news is also positive. On Feb. 18, it announced an integration with Solana (SOL).
For BeInCrypto’s latest Bitcoin (BTC) analysis, click here.


