


BeInCrypto breaks down some of the biggest altcoin movers and shakers from the previous week. Will their momentum continue?
During the week of April 12 to April 19, the five biggest altcoin gainers were:
- Dogecoin (DOGE) – 408.08%
- Neo (NEO) – 95.36%
- VeChain (VET) – 91.04%
- Ethereum Classic (ETC) – 83.27%
- Digibyte (DGB) – 81.28%
DOGE
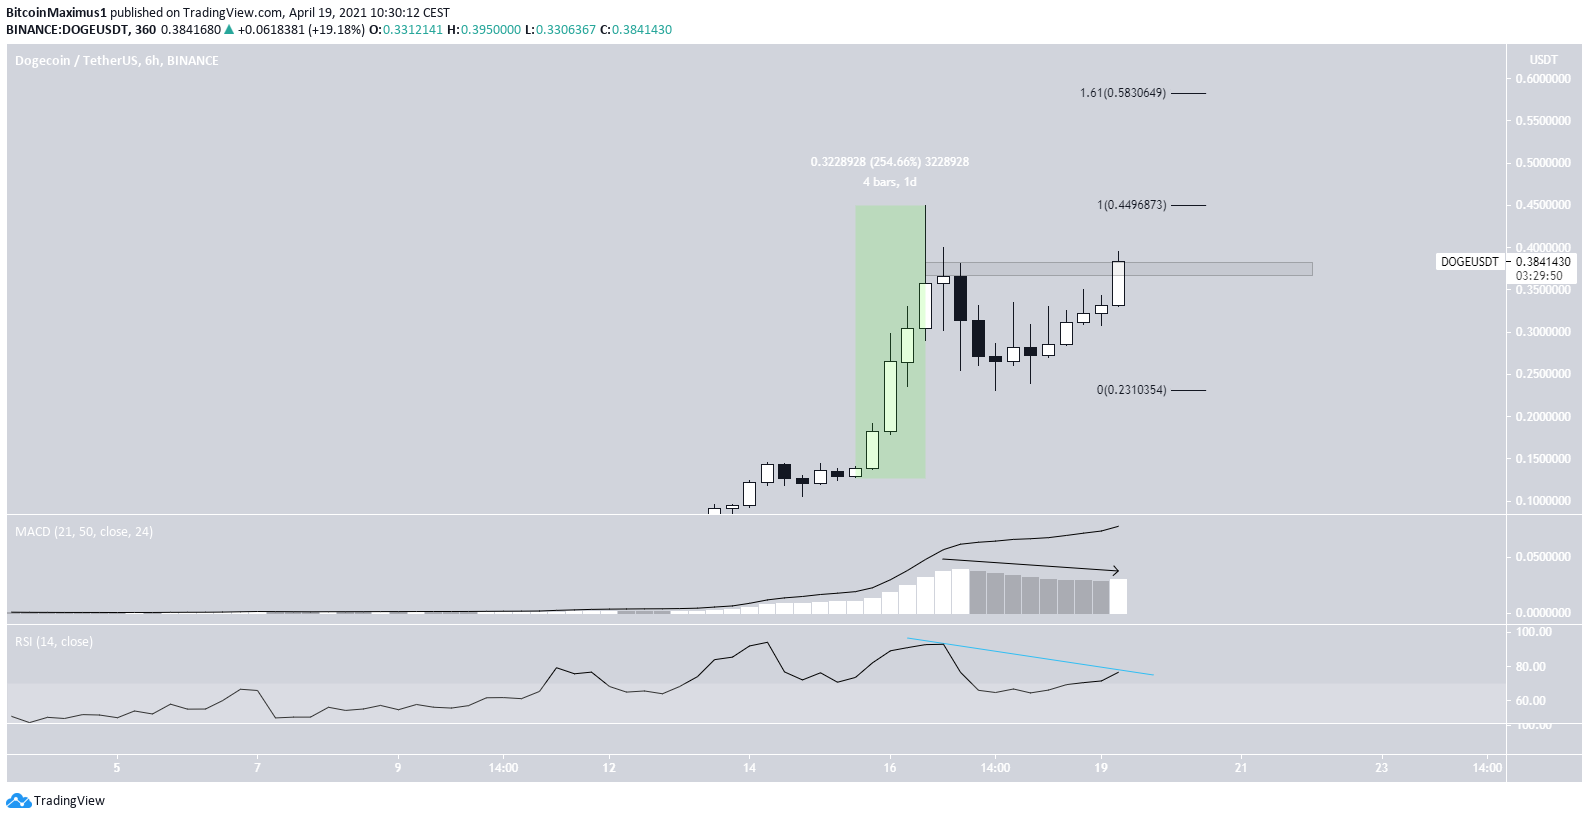
DOGE was the subject of a massive increase between April 15-16. In a span of roughly 24 hours, it increased by 254%. This led to an all-time high of $0.45 being reached on April 16.
After a considerable drop, DOGE has begun another upward movement.
Currently, it’s trading inside the $0.28 resistance area, potentially creating a double-top pattern. There are also bearish divergences in place.
Whether DOGE breaks out or gets rejected from this area will likely determine the direction of the future trend. A breakout could take it towards the next resistance at $0.583.
NEO
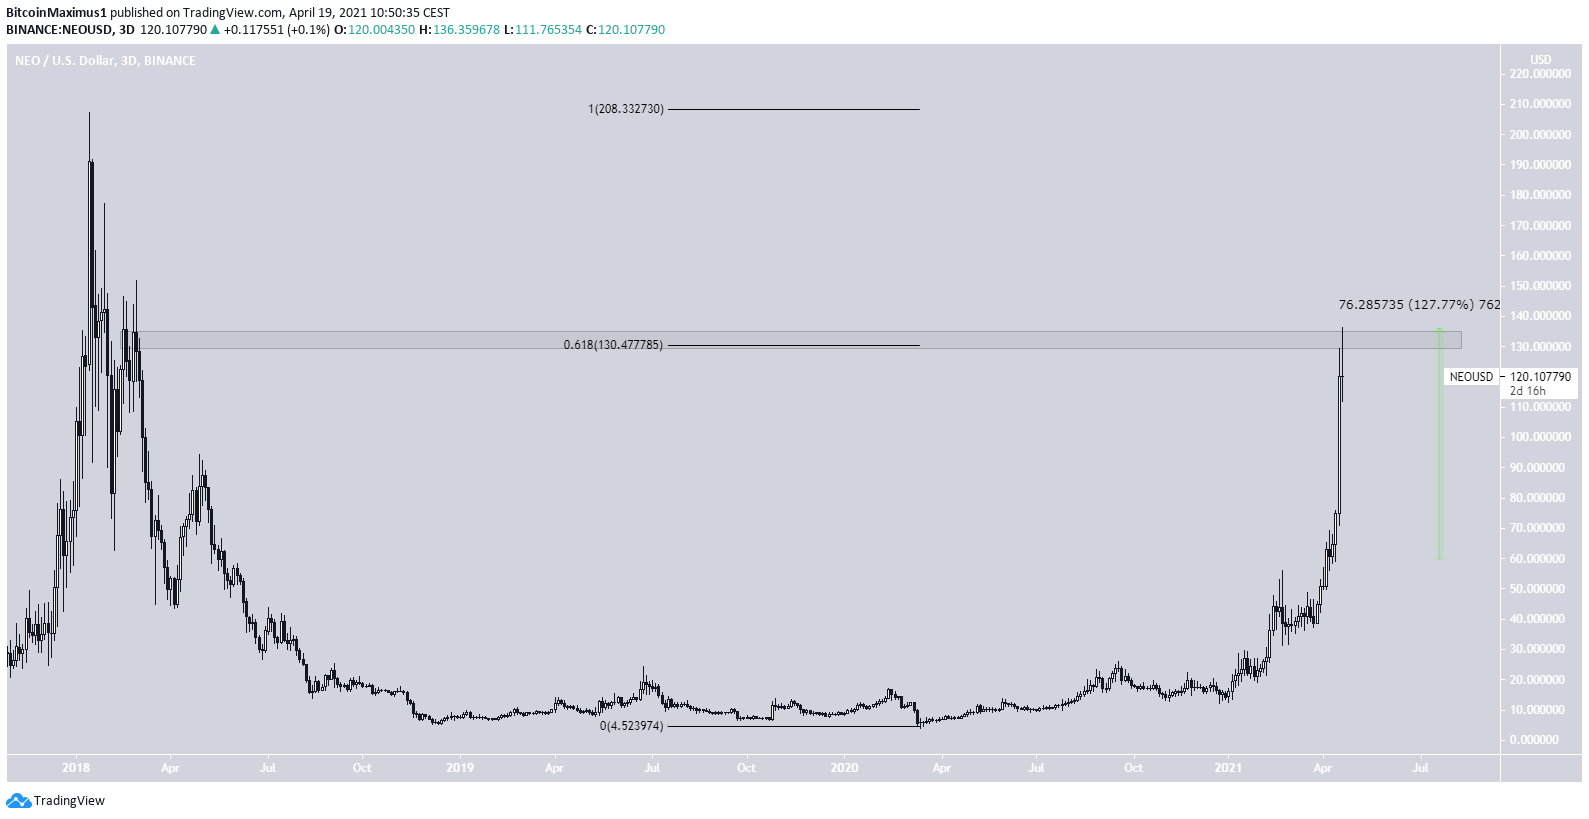
NEO has been increasing rapidly since trading at $59 on April 12. On April 19, it reached a local high of $136.35 — an increase of 127%.
The high was made right at the 0.618 Fib retracement level of the entire downward movement measuring from the all-time high price. There is resistance is at $130.
It currently appears to be creating a doji candlestick, which could eventually develop into a shooting star.
If it breaks out, the next resistance area would be found at the all-time high price of $207.
VET
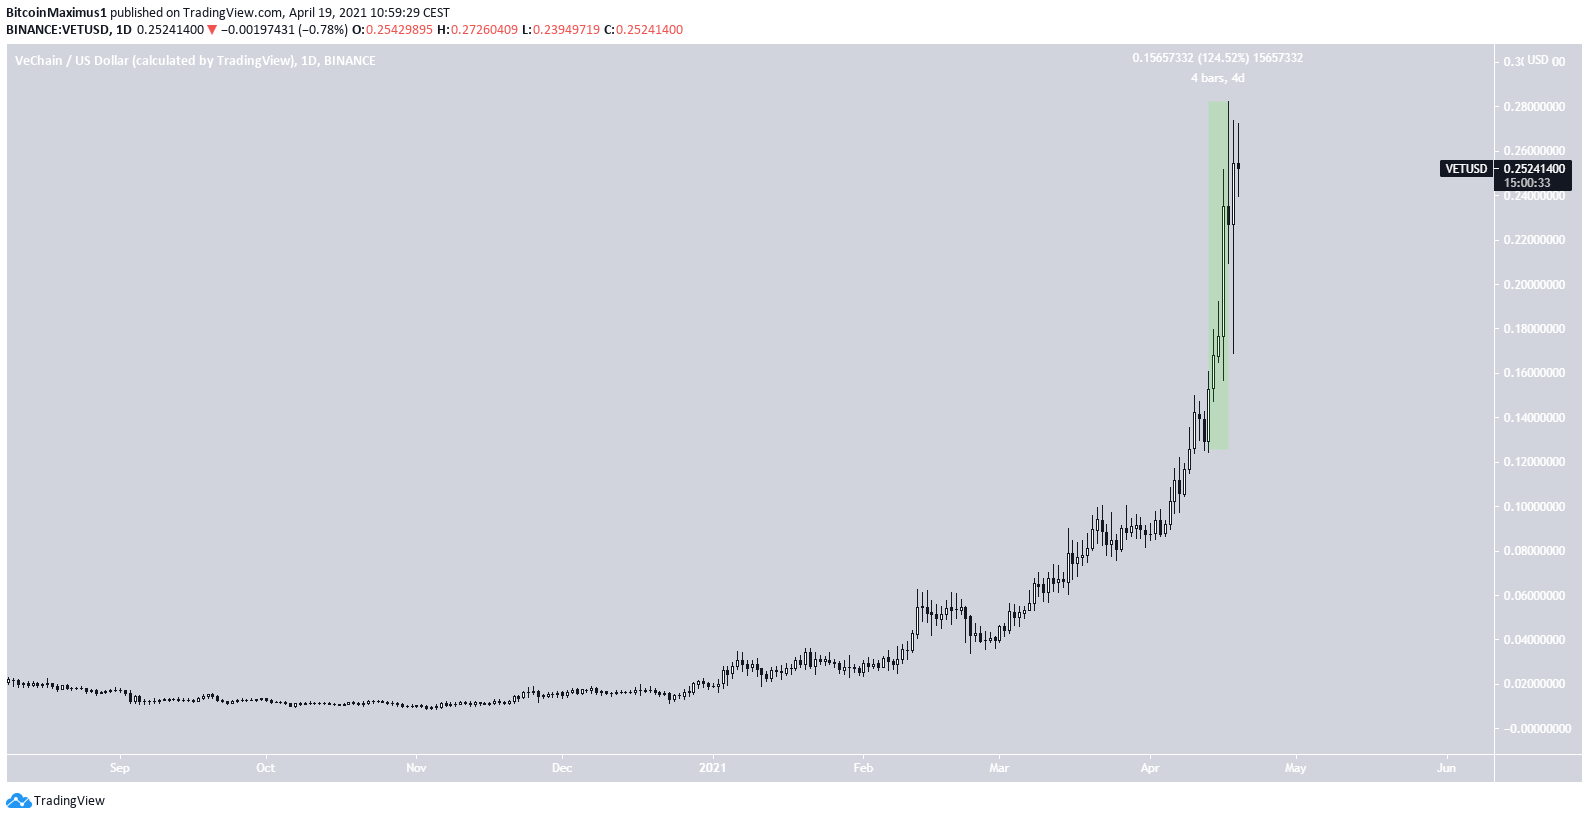
VET has been increasing rapidly since April 13. In a span of only four days, it moved upwards by 124.52%, reaching an all-time high price of $0.282 on April 17.
This created a shooting star candlestick, but VET followed it up with another bullish candlestick.
Similar to DOGE, the increase for VET is completely parabolic.
ETC
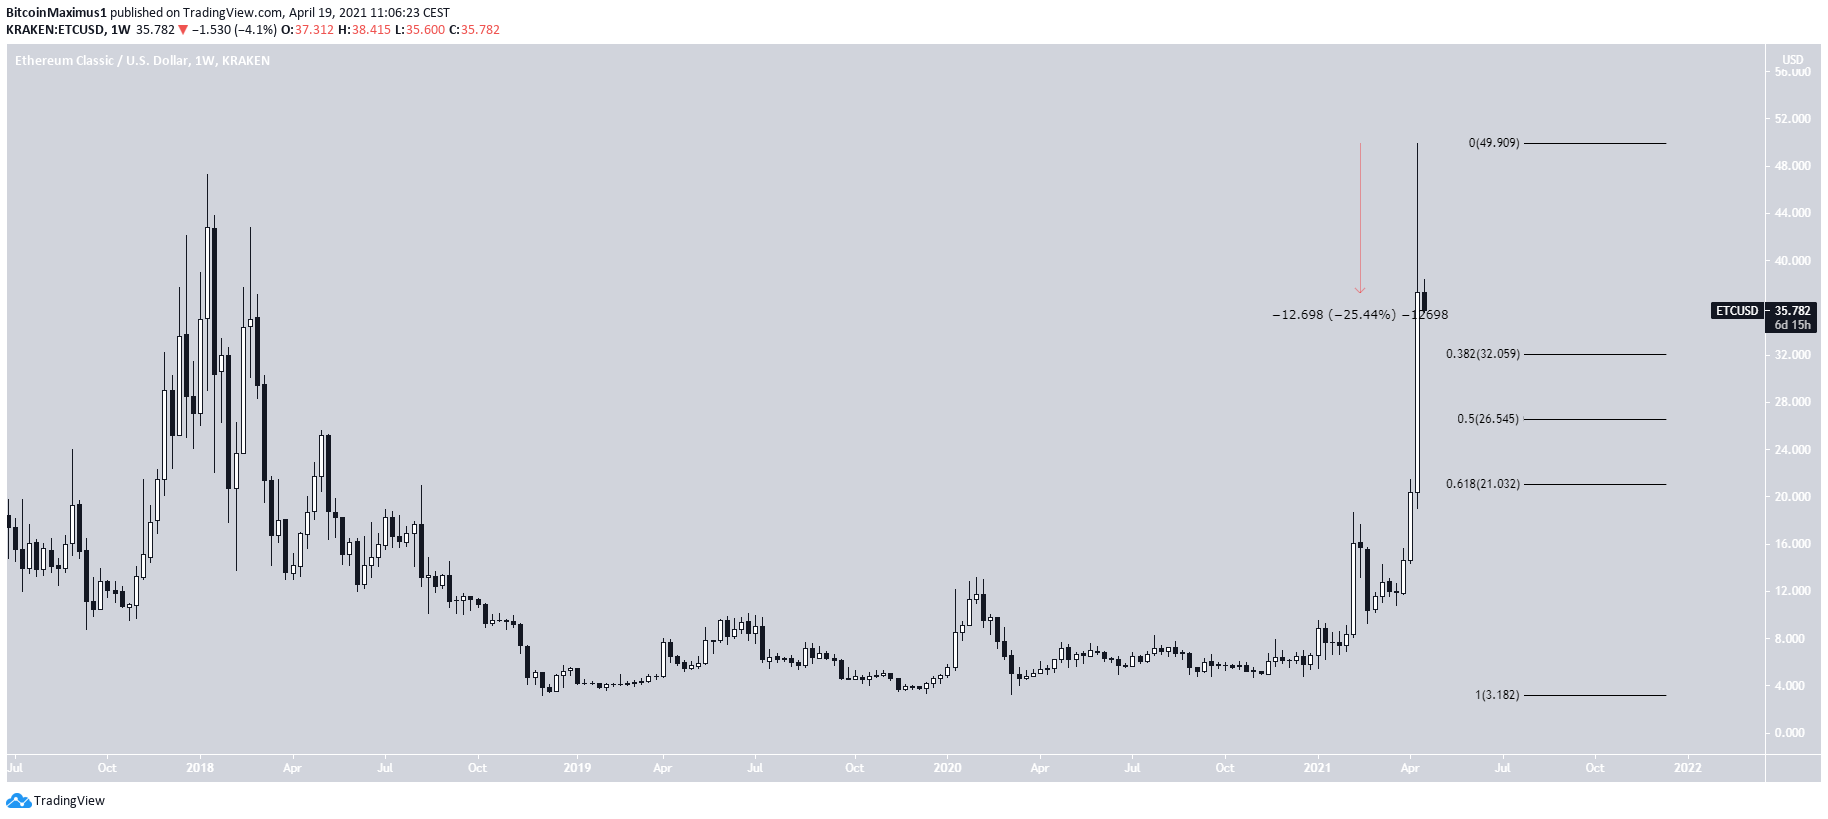
ETC has been increasing considerably over the past three weeks. On April 17, it reached an all-time high price of $49.09.
Since then, it has decreased by roughly 33%, creating a very long upper wick. This is normally considered a sign of selling pressure.
The closest support levels are found at $32, $26.50, and $21.
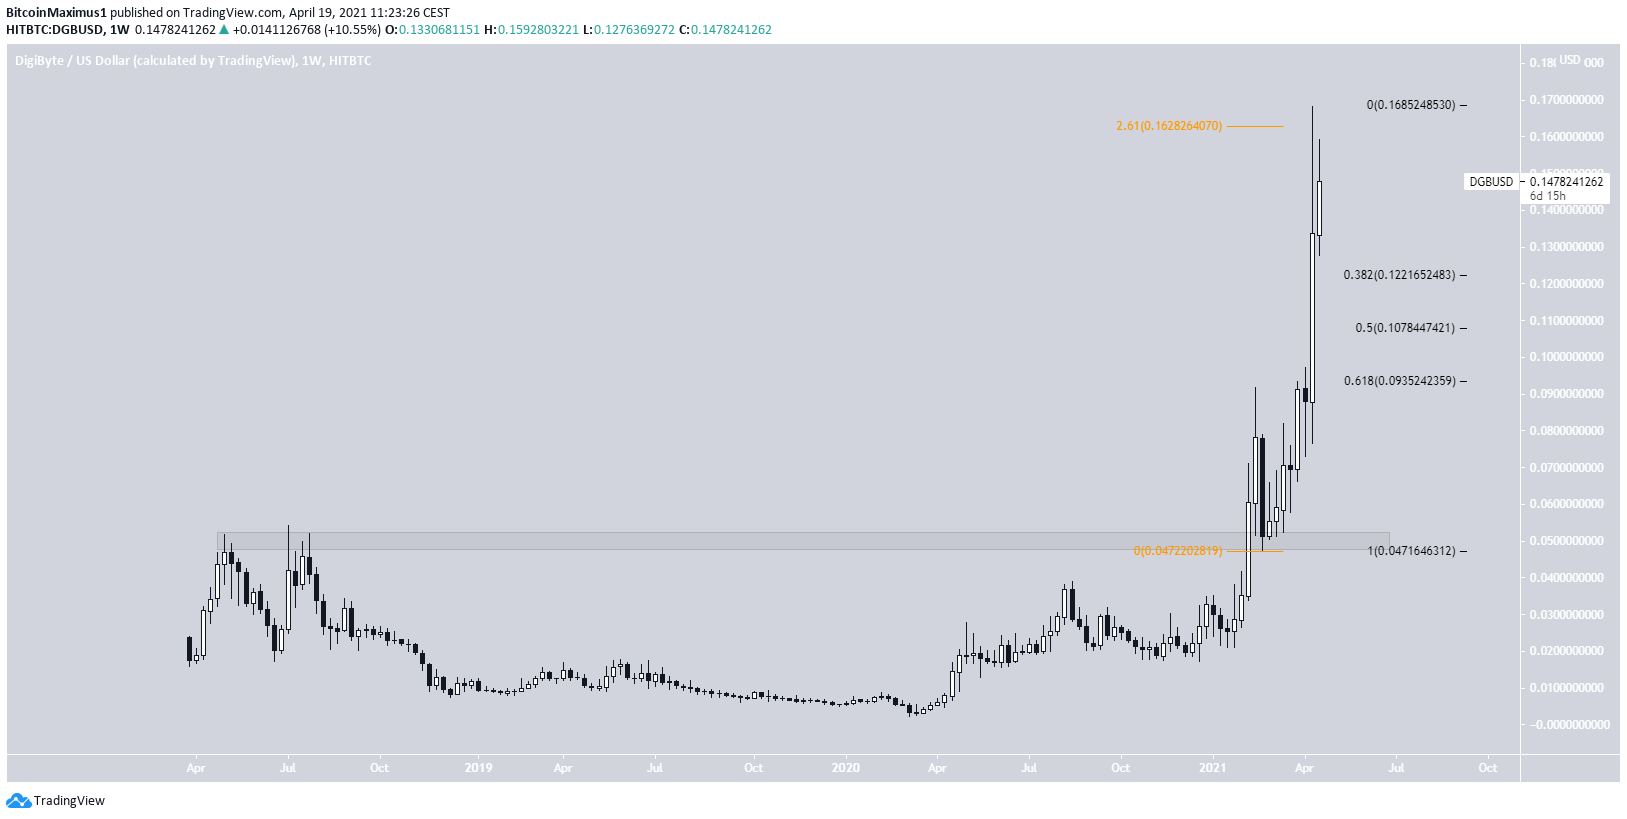
DGB
DGB has been moving upwards since retesting the $0.05 level at the beginning of March.
The rate of increase further accelerated on April 14. Three days, later, DGB managed to reach an all-high price of $0.168.
However, it was rejected by the 2.61 external Fib retracement level (orange). The closest support levels are found at $0.122, $0.107, and $0.093.
For BeInCrypto’s latest bitcoin (BTC) analysis, click here.


