


The SUI price bounced sharply on January 22, breaking out from a short-term resistance trend line.
Despite the breakout, SUI trades inside a horizontal and Fib resistance area. Will it break out or get rejected?
SUI Falls Before All-Time High
The SUI price has fallen since January 15 (red icon), when it just reached a high of $1.45 (red icon). This was only below the all-time high of May. The ensuing drop led to a low of $1 on January 22.
The SUI price has increased since, validating the 0.382 Fib retracement support level (green icon) and creating a bullish candlestick the next day.
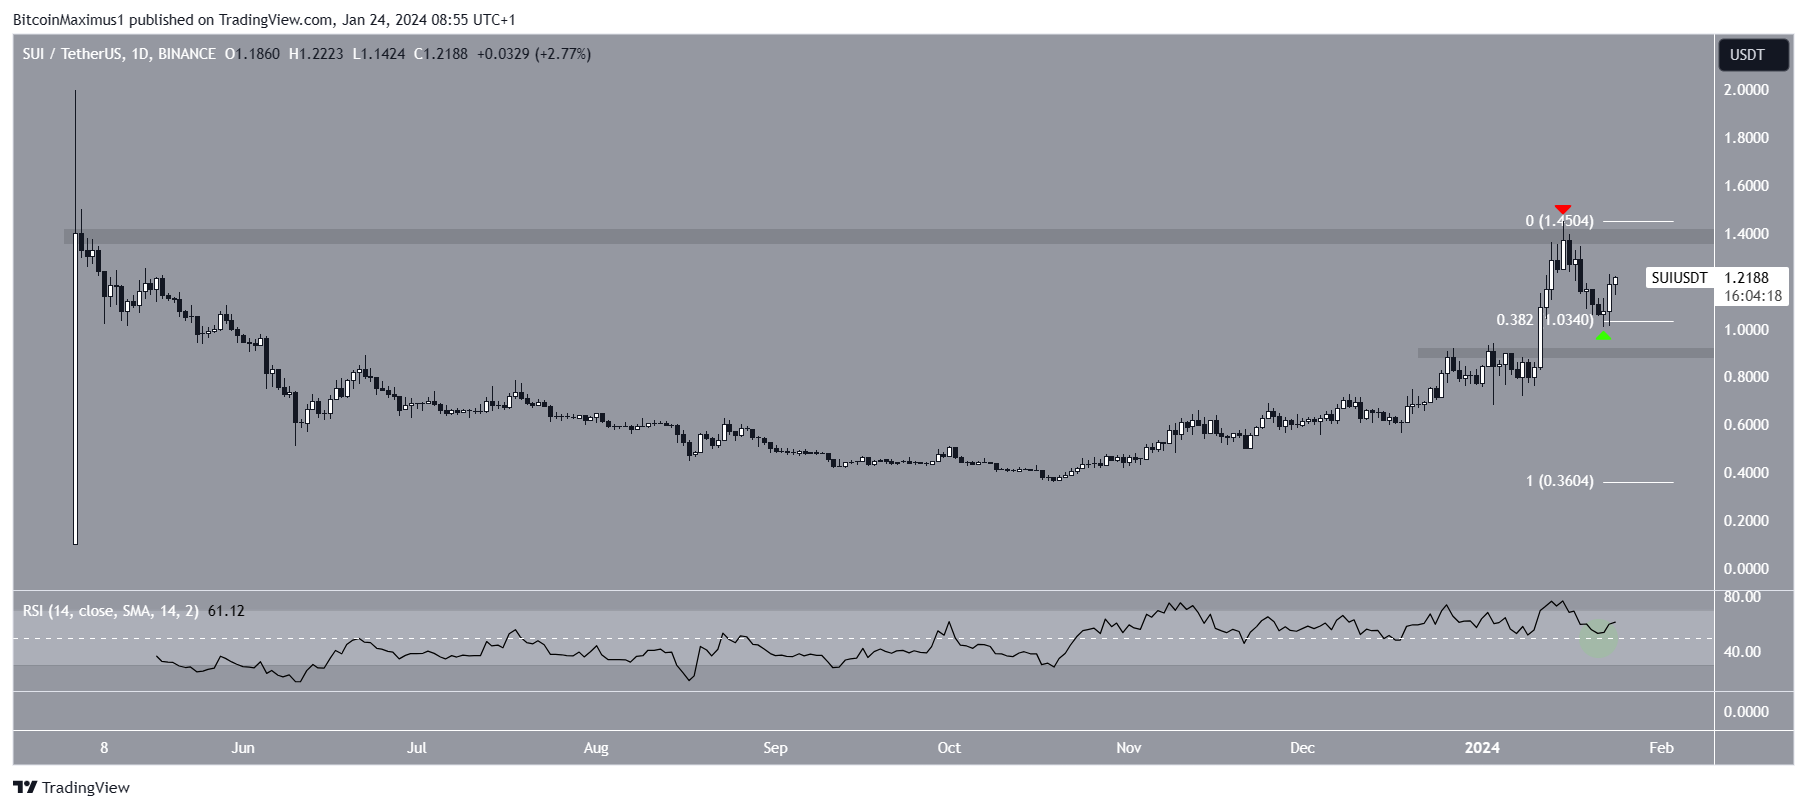
The daily Relative Strength Index (RSI) supports the bounce. When evaluating market conditions, traders use the RSI as a momentum indicator to determine whether a market is overbought or oversold and whether to accumulate or sell an asset.
If the RSI reading is above 50 and the trend is upward, bulls still have an advantage, but if the reading is below 50, the opposite is true. The RSI bounced at 50 simultaneously with the SUI price, legitimizing the movement.
What Are Analysts Saying?
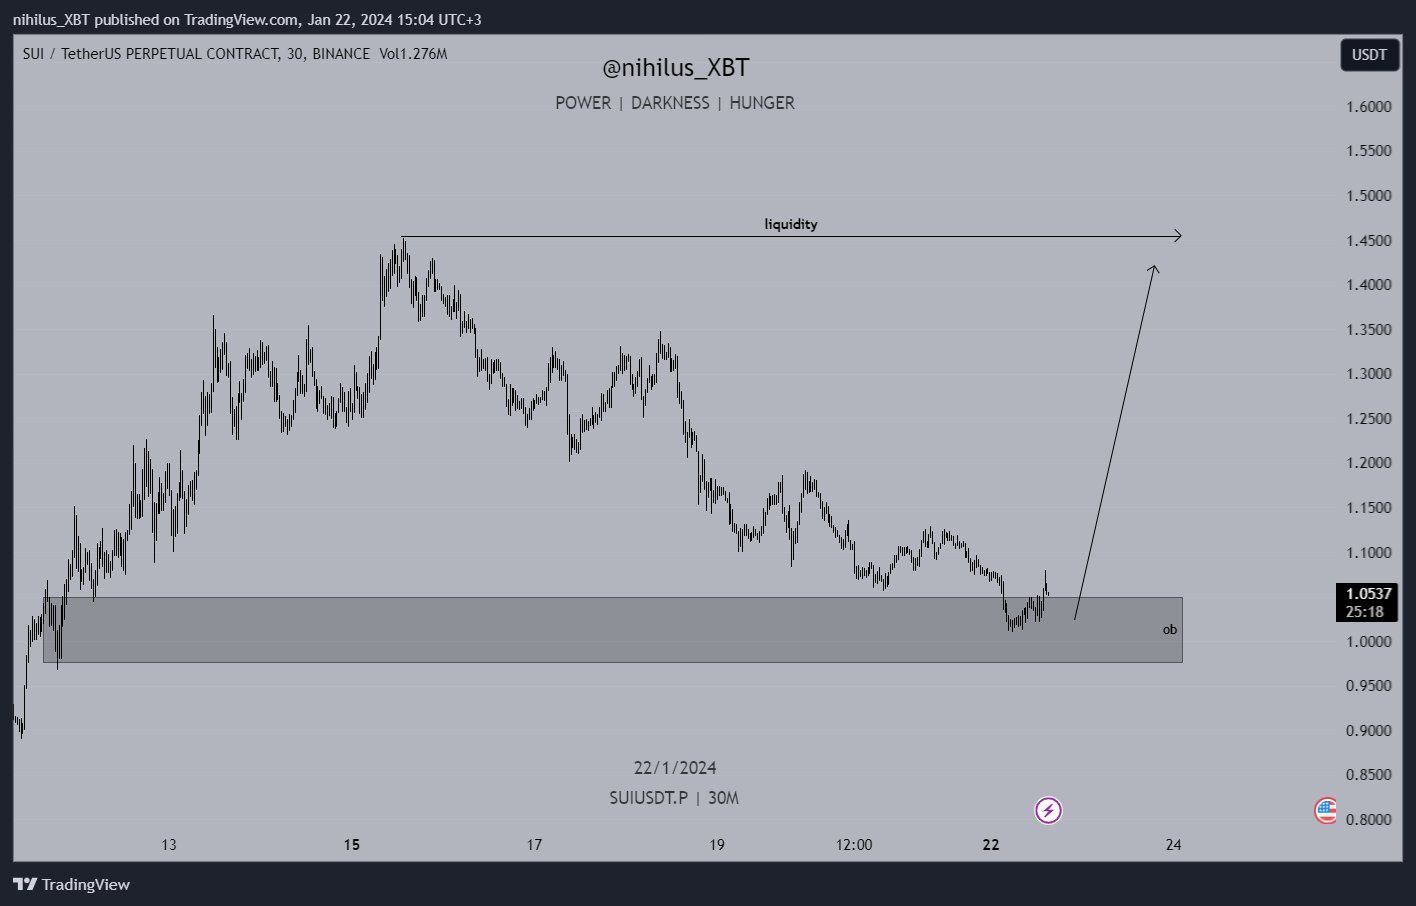
Cryptocurrency traders and analysts on X are predominantly bullish on the future SUI trend. Nihilus believes the price will bounce and reach $1.50.
KriyaDEX is bullish on the ecosystem, tweeting:
Sui DeFi is thriving. From lending to LSDs to DEXs, there’s an array of opportunities – anticipated airdrops, points, $SUI emissions and much more!
SUI Price Prediction: Where to Next?
The technical analysis of the six-hour time frame does not confirm the trend’s direction. The chart shows that SUI broke out from a descending resistance trend line in place since the high mentioned above.
However, SUI trades inside a confluence of resistances at $1.23, created by the 0.5 Fib retracement resistance level and a horizontal resistance area.
The six-hour RSI supports the breakout since it moved above 50 (green icon). Nevertheless, the SUI trend’s direction cannot be determined until the price reacts to the confluence of resistances.
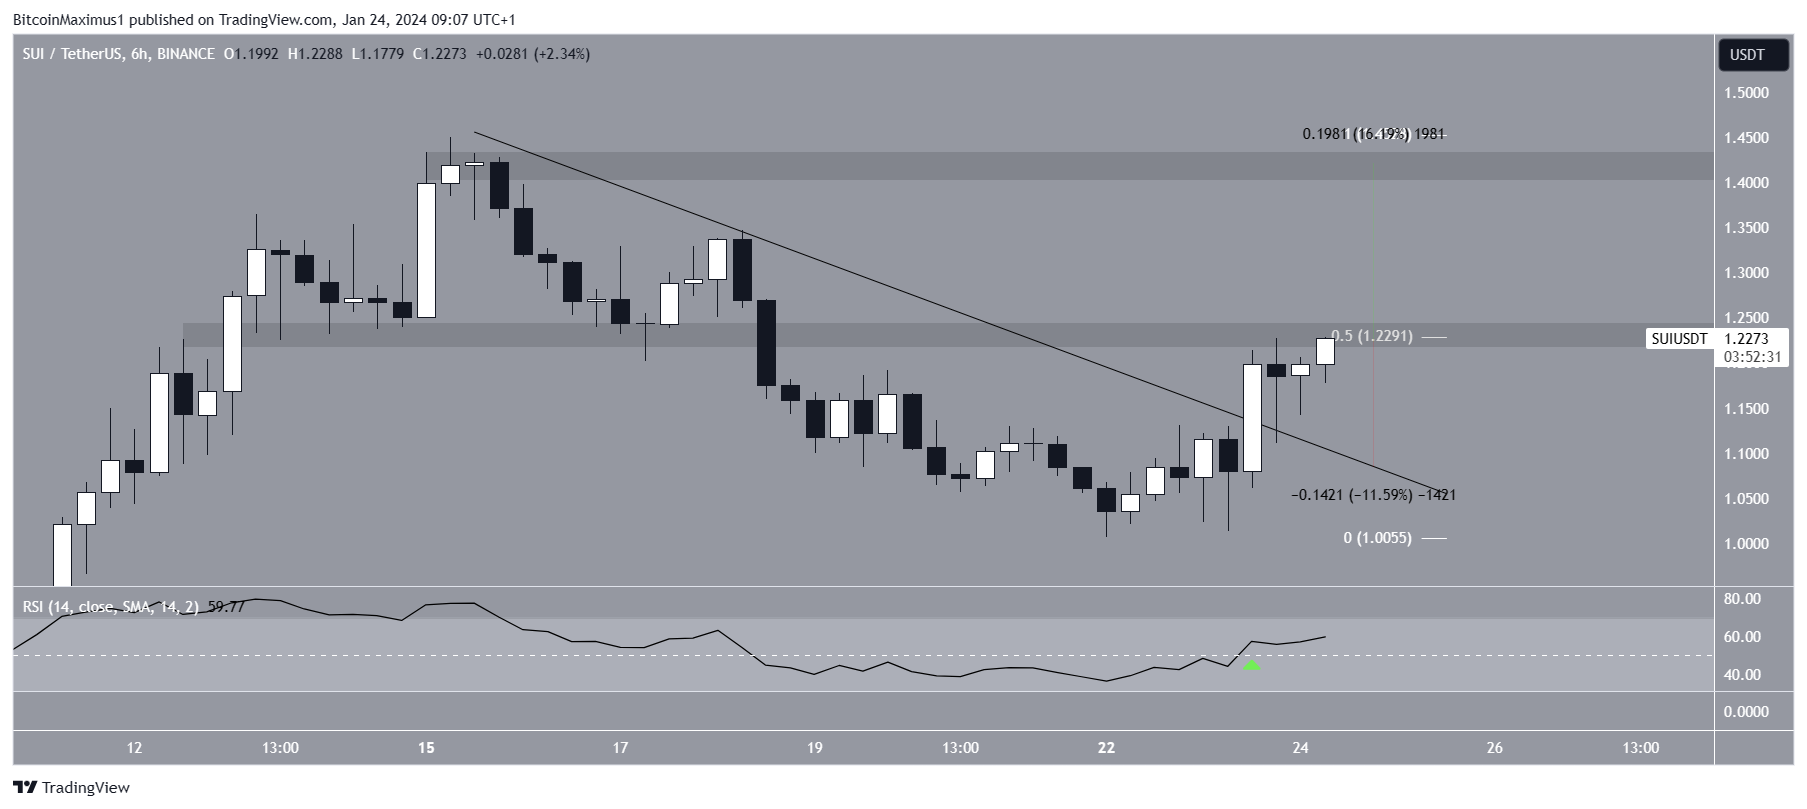
A successful breakout from the $1.23 resistance can trigger a 15% increase to the next resistance at $1.42. Conversely, a rejection can cause a 12% drop to the resistance trend line at $1.10.
For BeInCrypto’s latest crypto market analysis, click here


