


The Stellar (XLM) price broke down from a long-term ascending support line but has increased since June 15.
It is unclear if the upward movement is part of a bullish trend reversal or if it is just a relief rally in response to the prior drop. The reaction to the resistance line of the short-term pattern will be crucial in determining the direction of the future price trend.
Stellar Price Loses Critical Support
The daily time frame technical analysis provides a bearish XLM price outlook. It shows that the price has fallen since its yearly high of $0.115 on April 1.
On June 10, it broke down from an ascending support line that had been in place for 163 days. Breakdowns from such long-term structures often lead to sharp downward movements.
The downward movement led to a low of $0.075 on June 15, validating the $0.077 horizontal area as support (green icon).
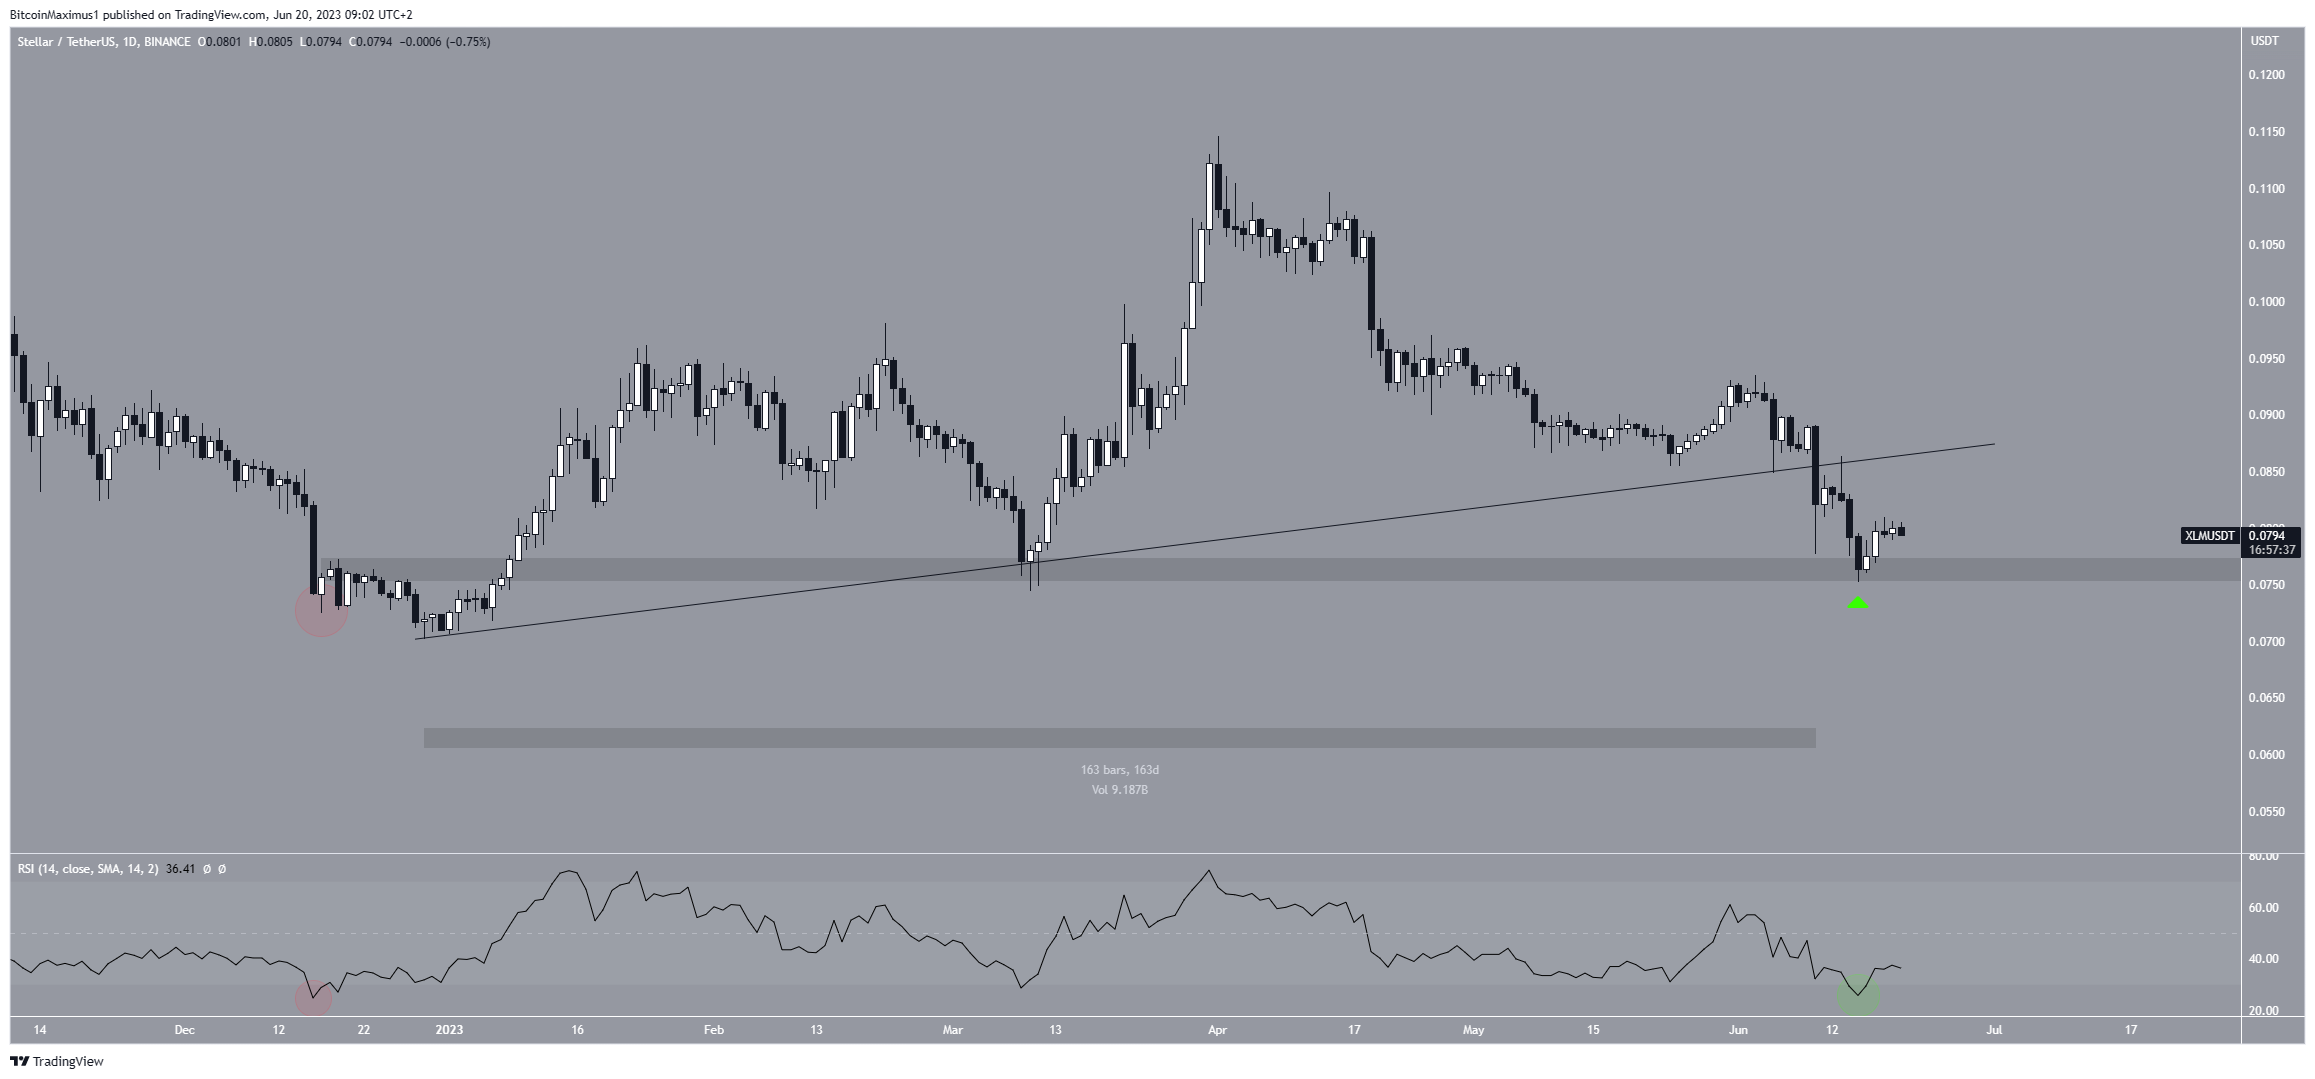
The Relative Strength Index (RSI) gives conflicting readings. Traders utilize the RSI as a momentum indicator to assess whether a market is overbought or oversold and to determine whether to accumulate or sell an asset.
If the RSI reading is above 50 and the trend is upward, bulls still have an advantage, but if the reading is below 50, the opposite is true. While the indicator is decreasing and below 50, it just moved outside its oversold region (green circle).
The previous time this occurred (red circle) preceded the entire upward movement that led to the yearly high.
More From BeInCrypto: Crypto signals: What Are They and How to Use Them
XLM Price Prediction: What Does the Wave Count Say?
The Elliott Wave count from the six-hour time frame shows a completed five-wave downward movement, likely a diagonal due to its expanding wedge shape. However, it is not yet clear how this fits with the longer-term count.
If the decrease is part of a larger downward movement, the XLM price will likely get rejected at the 0.618 Fib retracement resistance level at $0.087. If this occurs, the Stellar lumens price will likely fall to at least $0.070, reaching a new yearly low in the process.
On the other hand, if the XLM price moves above $0.094 (red line), this will mean that the move marks the end of the correction. In that case, the price will likely reclaim the long-term ascending support line and increase to $0.115.
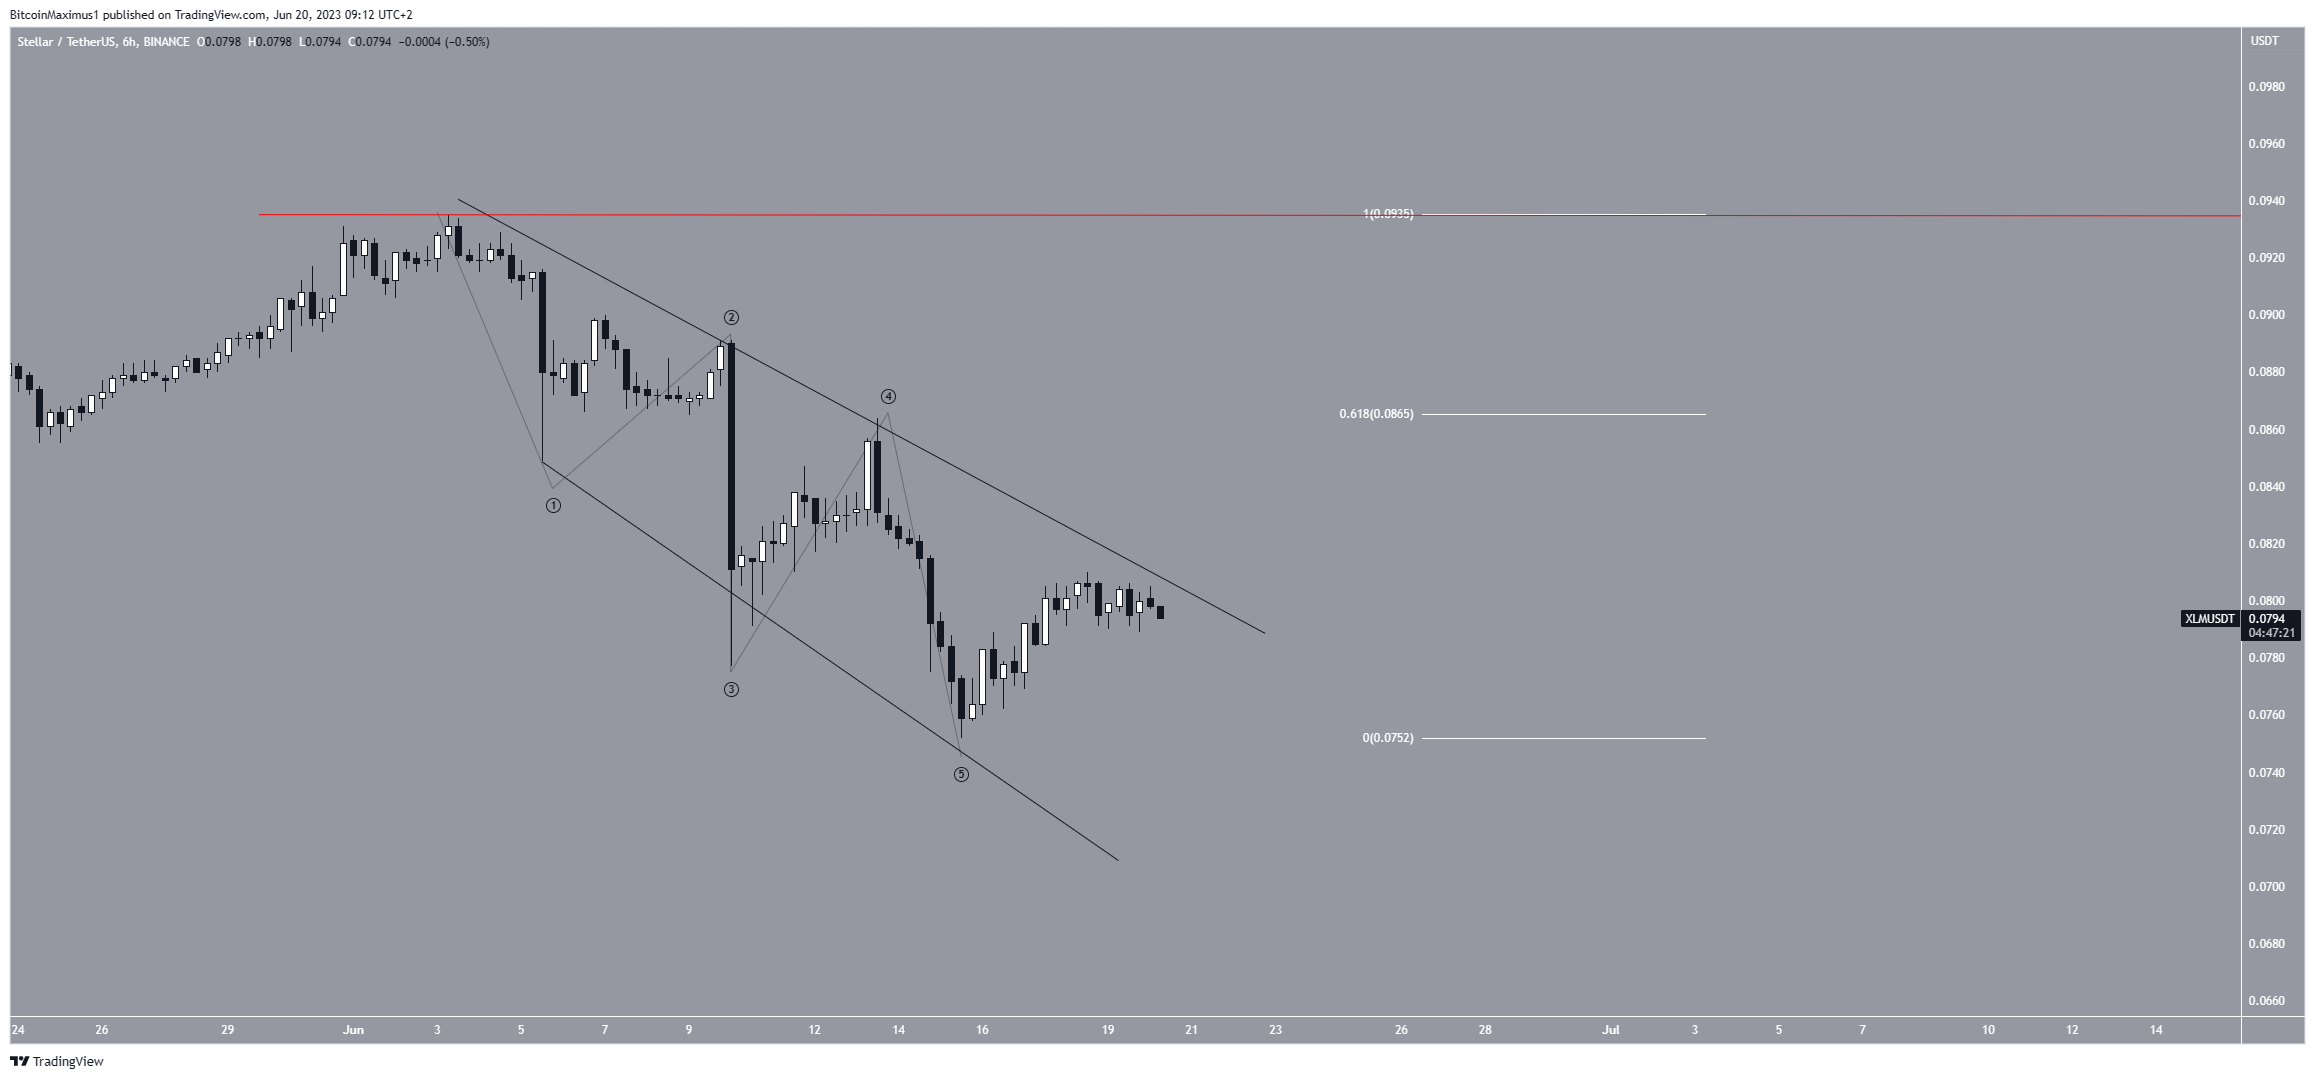
Even though the short-term XLM price prediction is bullish, failure to break out from the wedge and a drop to $0.075 will mean that the trend is bearish.
In that case, an immediate fall to $0.070 and a possible breakdown to $0.050 will be the most likely scenario.
More From BeInCrypto: 9 Best AI Crypto Trading Bots to Maximize Your Profits
For BeInCrypto’s latest crypto market analysis, click here.



