The Stellar (XLM) price has been moving in a sideways range for months now. Nonetheless, certain technical developments have placed the coin on a certain analyst’s buy list.
In a recent Tweet, renowned analyst and swing trader Crypto Capo told his nearly 555,000 followers on Twitter that he was bullish on Stellar (XLM) and Ethereum (ETH).
Capo also mentioned that he was HODLing Reserve Rights (RSR), LIT token, and STEPN (GMT).
His bullishness on ETH could stem from its recent 2% gain, but why the analyst was long on XLM was still a matter of confusion for many of his followers.
Thus, here’s a breakdown of XLM technical indicators to discover why he is long Stellar (XLM).
Stellar (XLM) price flashing a buy signal?
At the time of press, Stellar (XLM) was trading at $0.113 — flat on the daily and hourly charts. In the weekly time frame, the XLM price was down by 6.52%.
Nonetheless, the TD sequential indicator (a turning point indicator) is showing a buy signal on the monthly chart. Notably, the last time the TD presented a buy signal in the form of a red nine candlestick, it actually predicted the bottom.
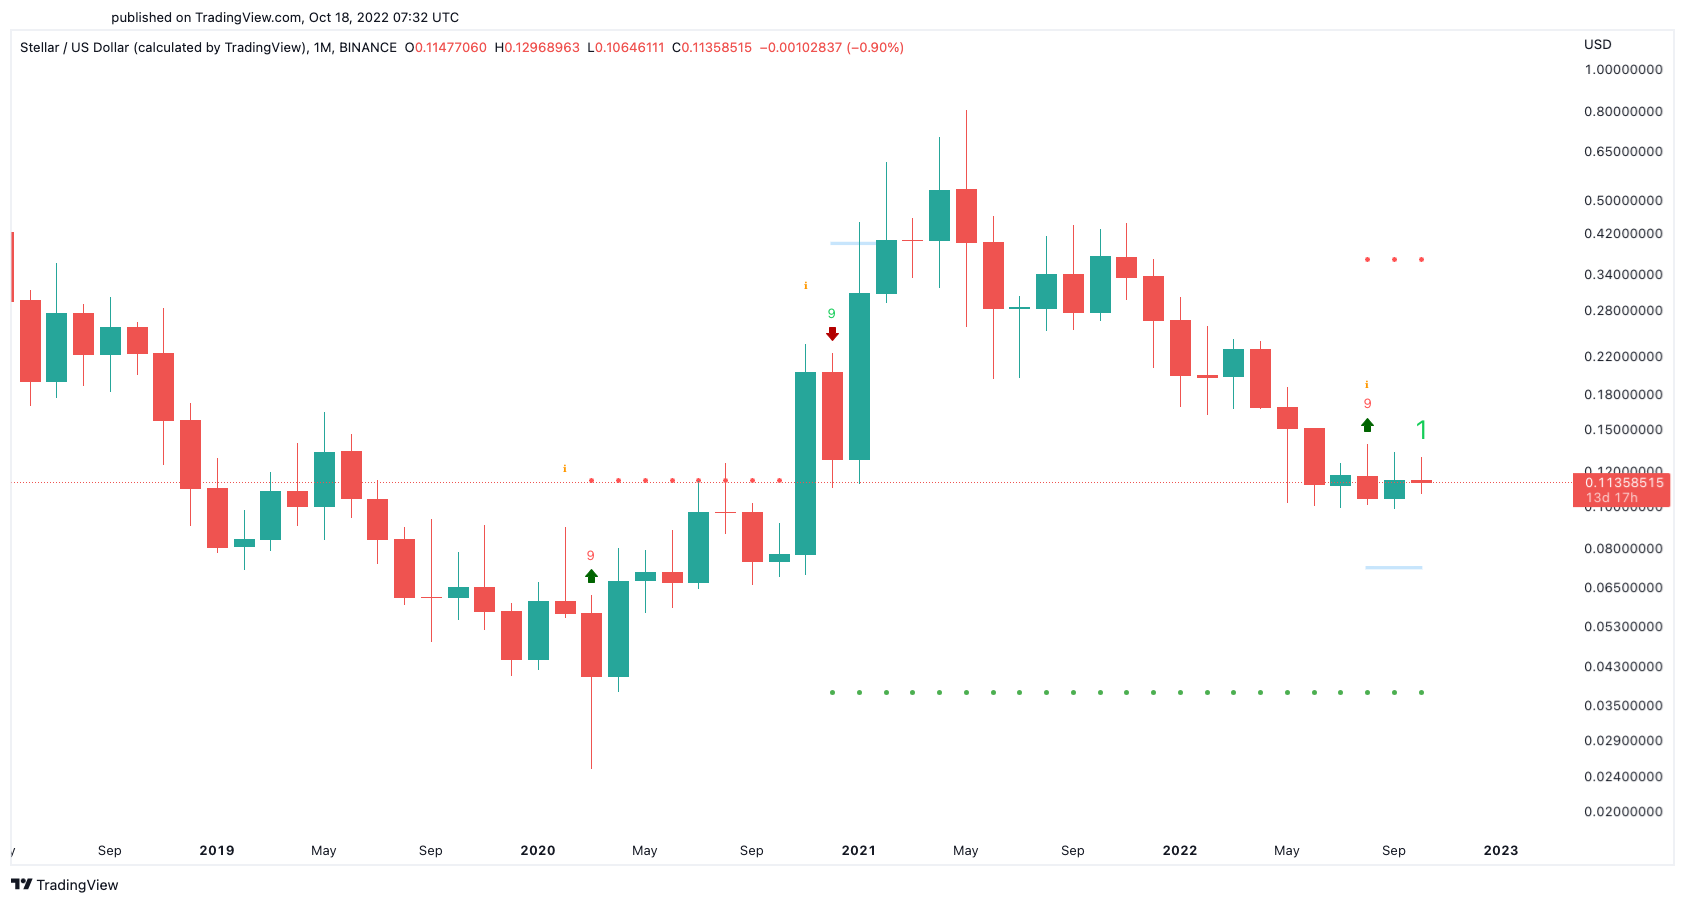
The TD sequential indicator shows changes in price trends, and since it’s been changing trends on a monthly basis, it could indicate a long-term reversal. However, whether bulls could make it happen is something only time will tell.
Another bullish turn that Capo could have noticed was the tightening of Bollinger bands which could mean that a breakout is in store. The analyst could be expecting a bullish break out because the Bollinger bands are squeezing on the 3-day chart.
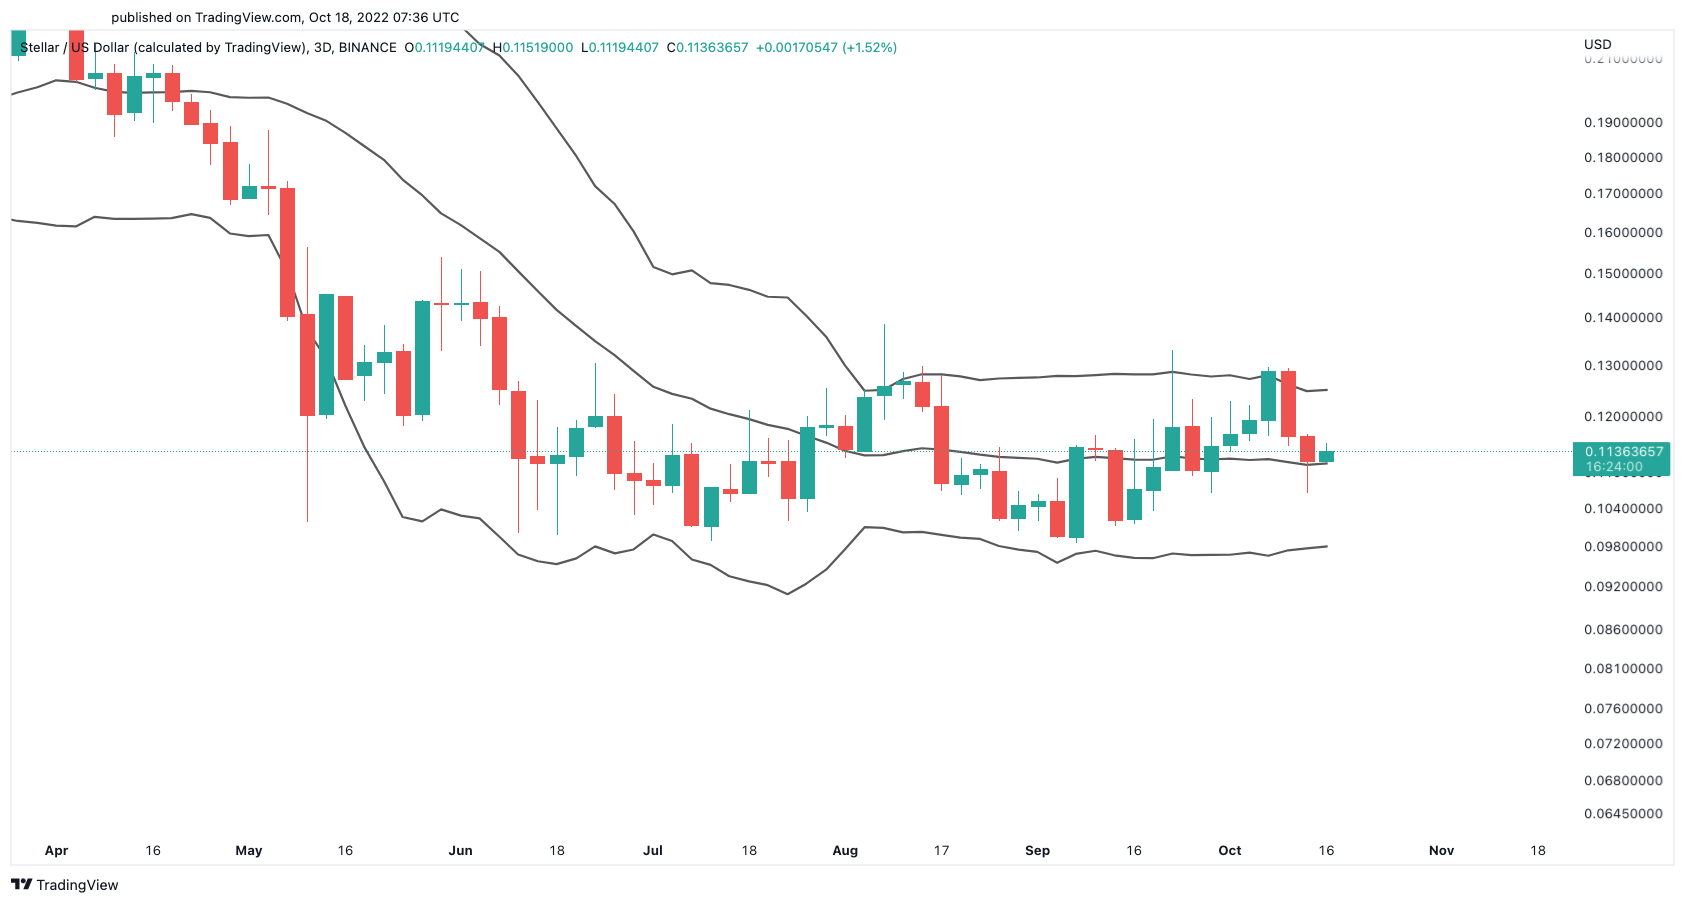
The tightening of Bollinger Bands normally suggests that a stagnation period is coming to an end and that a spike in volatility could follow.
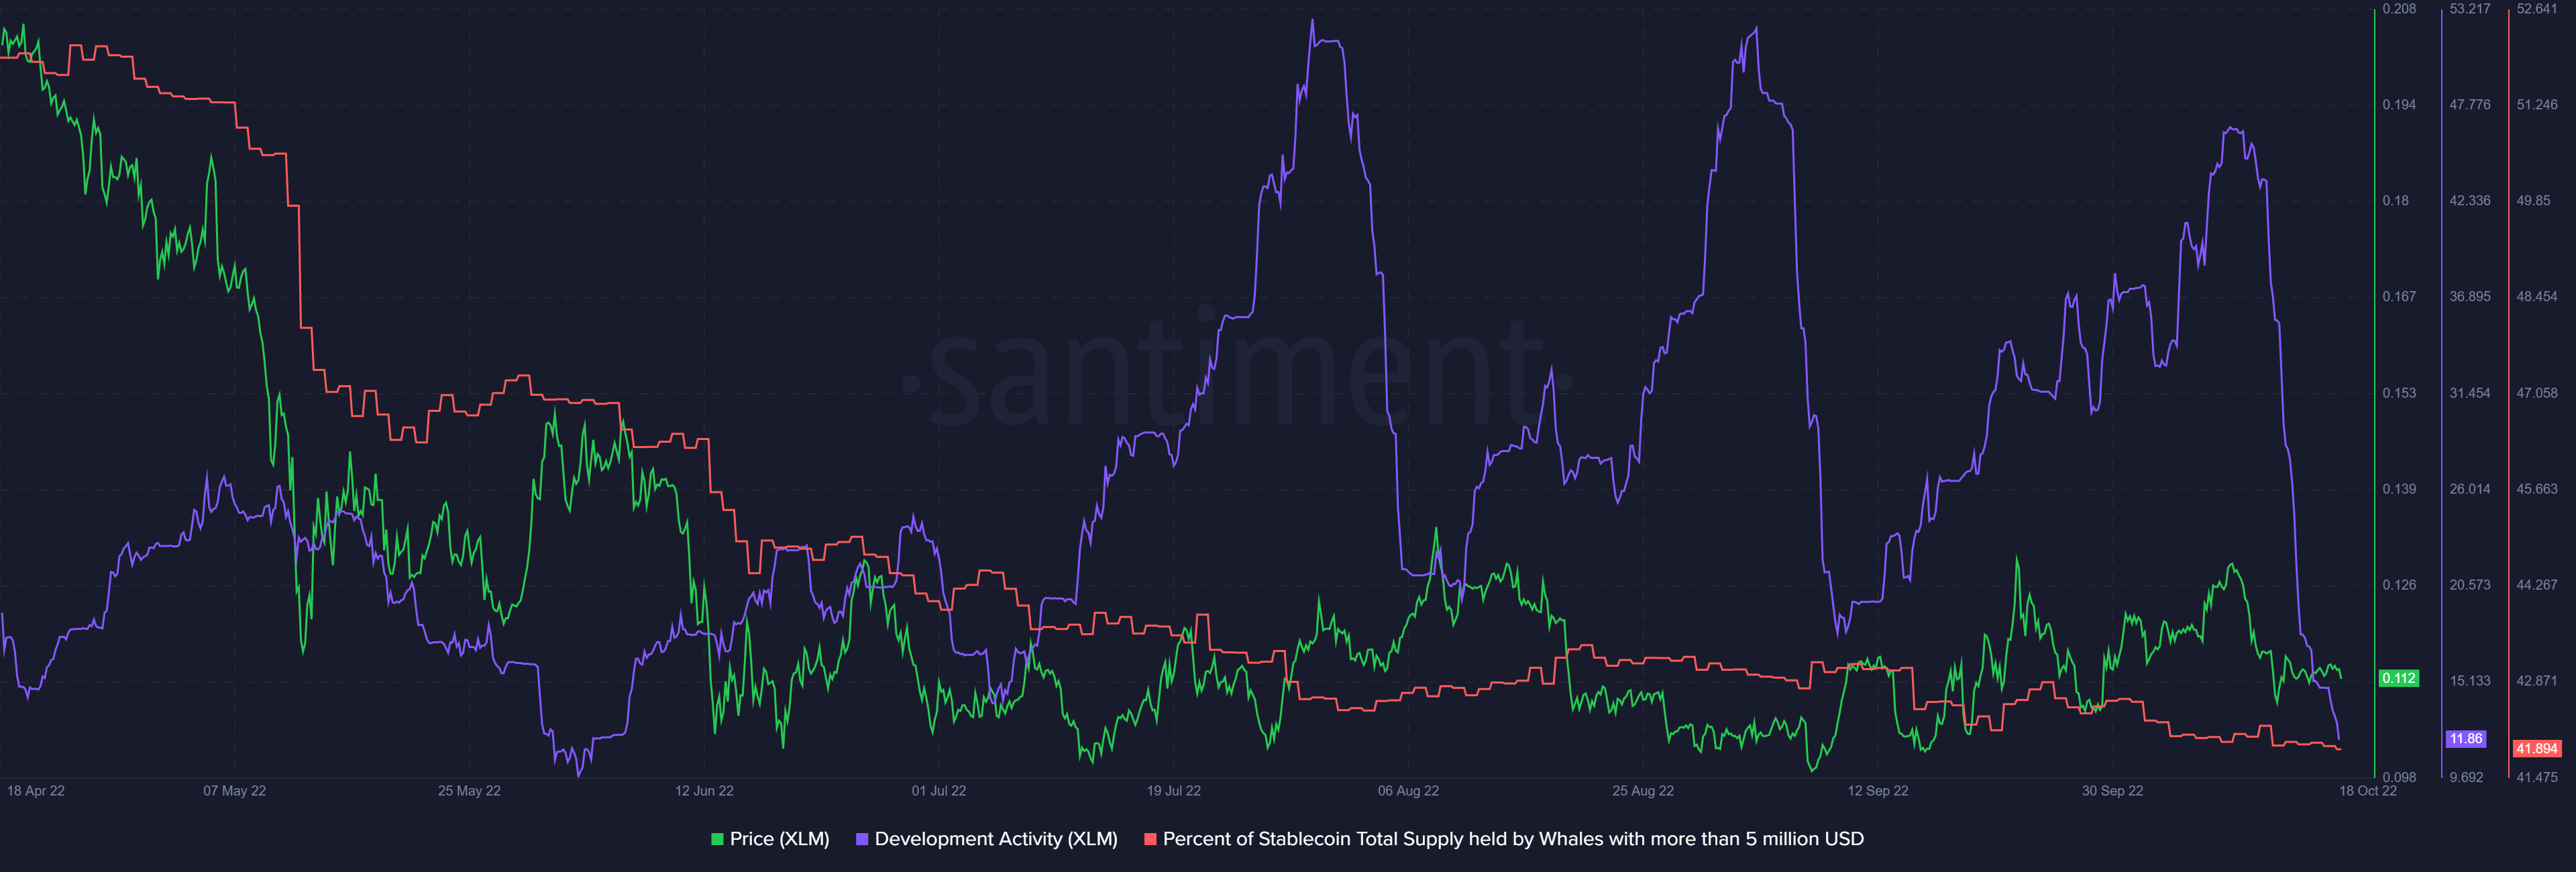
Falling social metrics
At the moment, the XLM social perception is negative, as seen in the weighted sentiment indicator treading into the negative territory while social volumes are drastically decreasing.
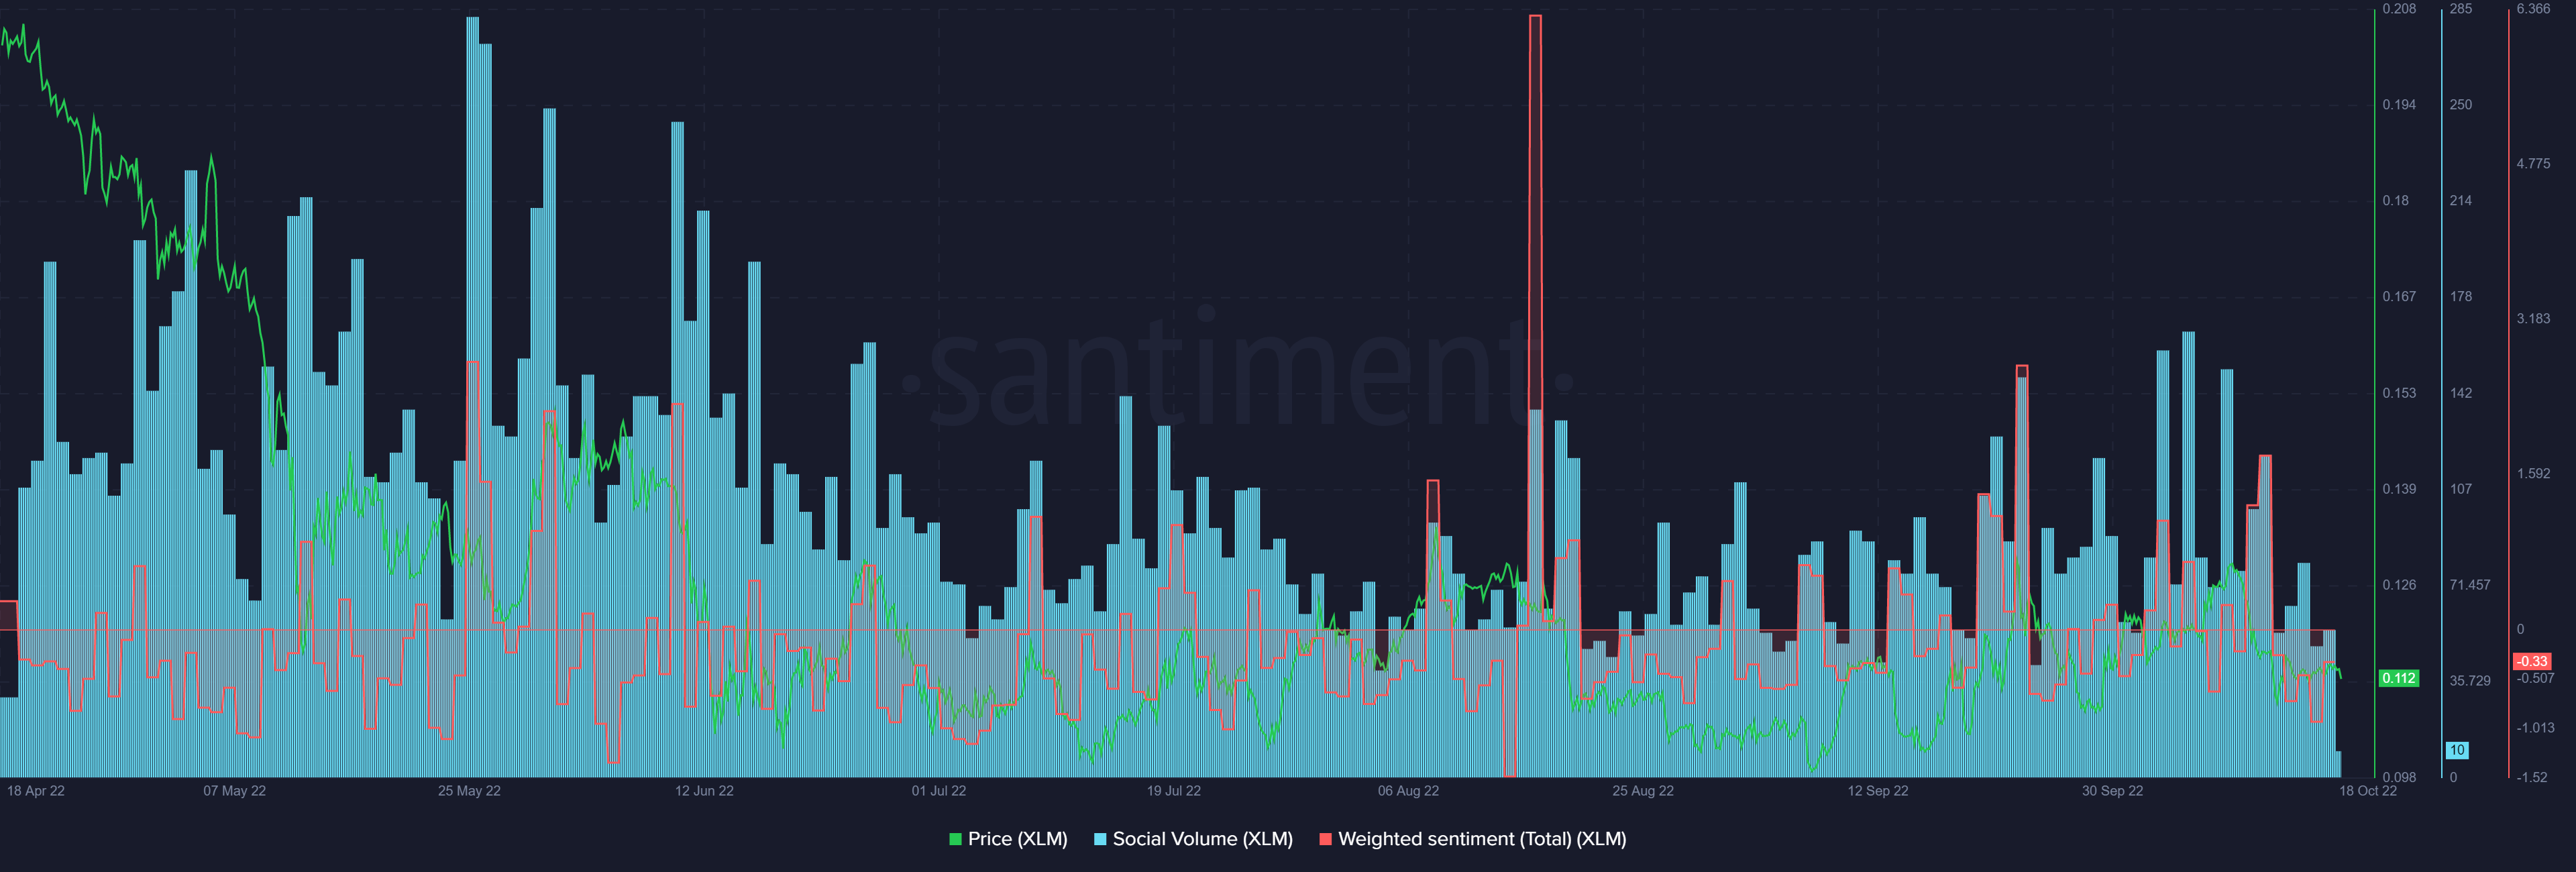
Since the social sentiment is low, Capo could be doing the opposite of the herd, basically adhering to the principle of ‘buy fear and sell greed’
However, looking at the major drop in development activity and the low number of whales in the network, if an XLM breakout takes place from an on-chain perspective, maintaining a bullish price momentum could be tough.