


Both XRP and Stellar lumens (XLM) have both initiated rapid upward moves recently. However, after reaching their respective resistance areas, swift reversals ensued.
It appears that both are in the process of dropping to their respective support lines. However, XLM and XRP are trading in distinct trading patterns, and the rate of any possible decreases may differ. By analyzing technical indicators, we predict future short-term movements.
Will XLM and XRP continue falling or jump back to the resistance line? Let’s find out!
Stellar Lumens in a Symmetrical Triangle
The price of XLM reached a low of $0.115 on May 15. A rapid increase ensued and the price reached a high of $0.162 on May 16.
Since then, XLM/USD has since been trading inside the symmetrical triangle outlined below:
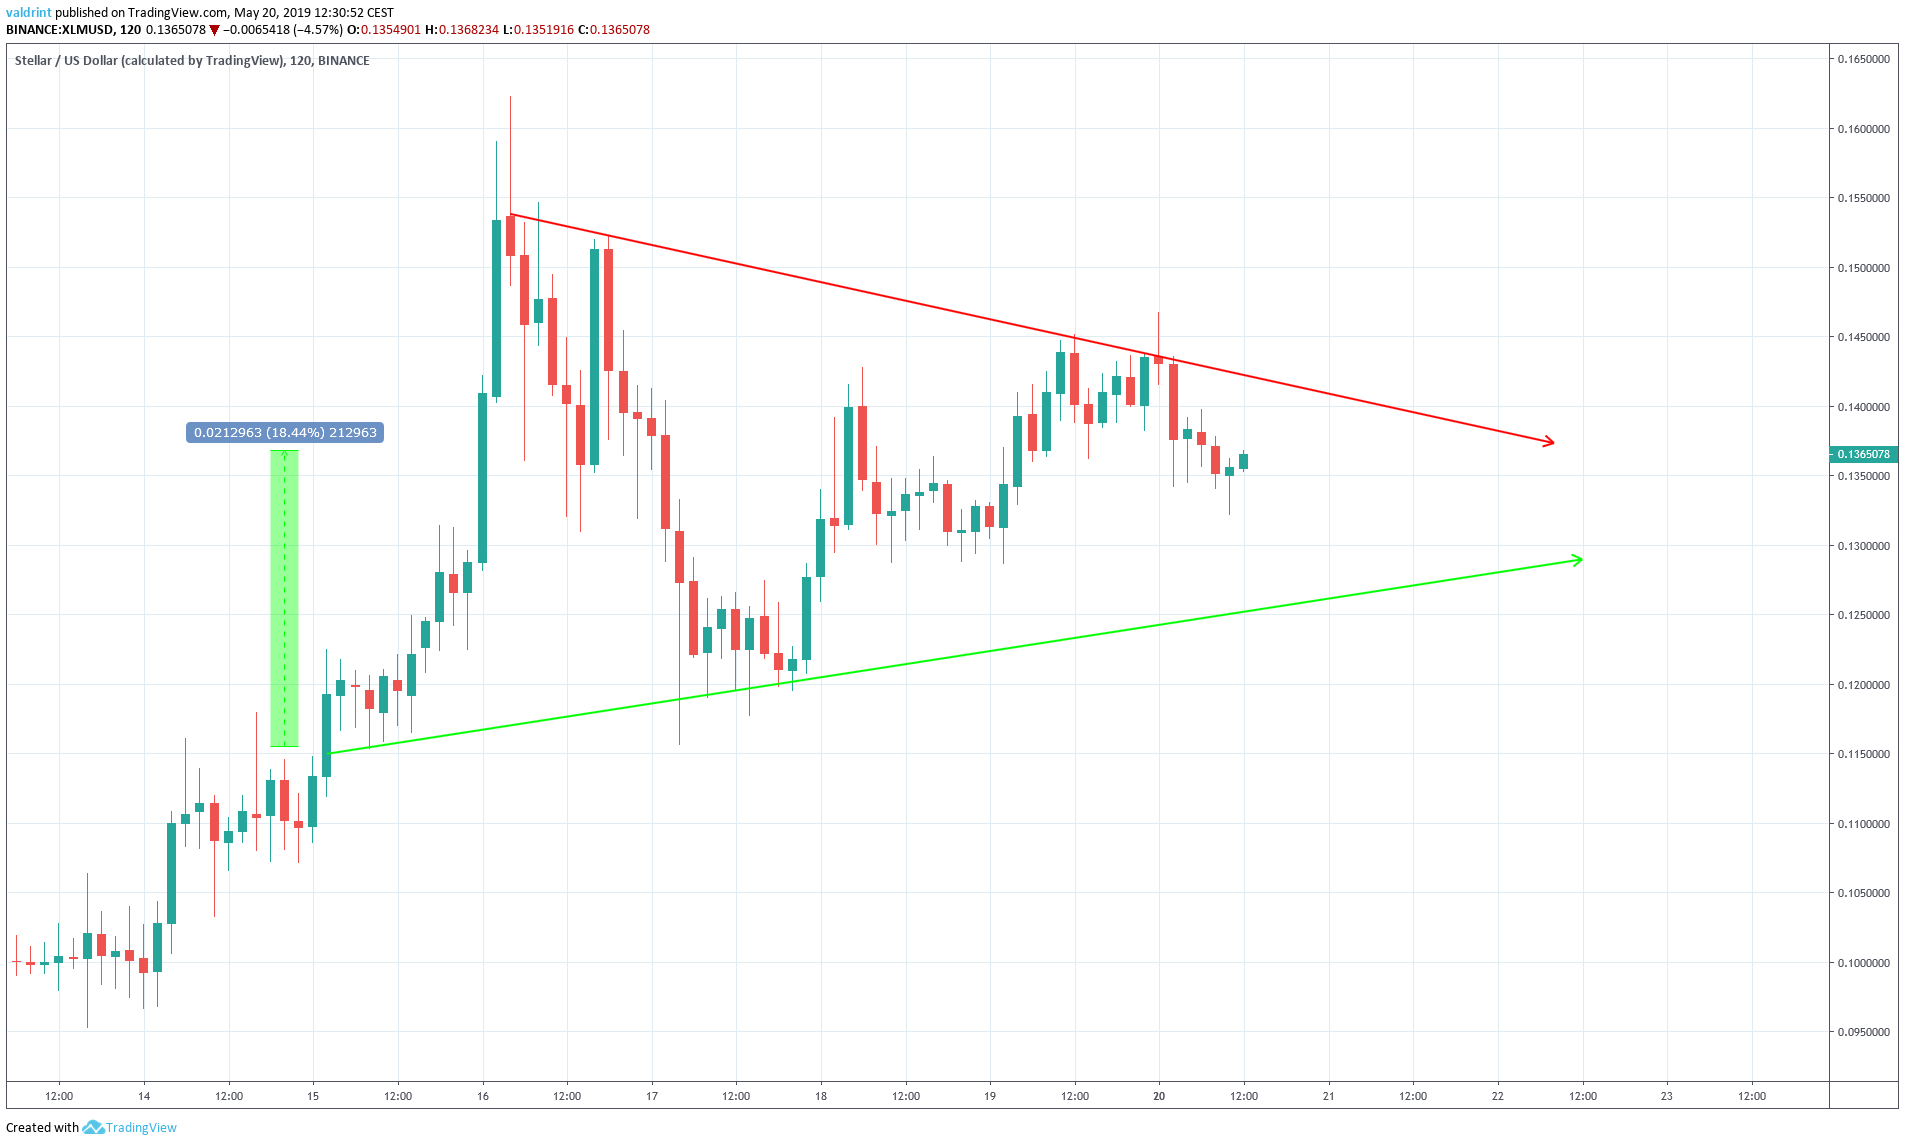
Since the beginning of the triangle, the price has increased by 18.344%. The price reached the resistance line on May 19 and then dropped slightly. It rebounded back to the line the following day and has since fallen slightly.
Will the price break out? In order to determine that, a look at technical indicators is required.
Back to the Resistance?
 On May 19, the price reached a high of $0.145. It continued to increase and reached a higher high of $0.146 the next day. Similarly, the RSI made the first high on May 19. However, it has continued to generate lower values since.
This bearish divergence suggests that the price of XLM is likely to continue falling to the support line. Whether or not it will reach the support before rebounding is uncertain.
XRP Inside a Descending Triangle
The price of XRP/USD made a low of $0.366 on May 14. A rapid increase followed and XRP pushed upward reached $0.478 on May 16.
It has been decreasing since inside a descending triangle since:
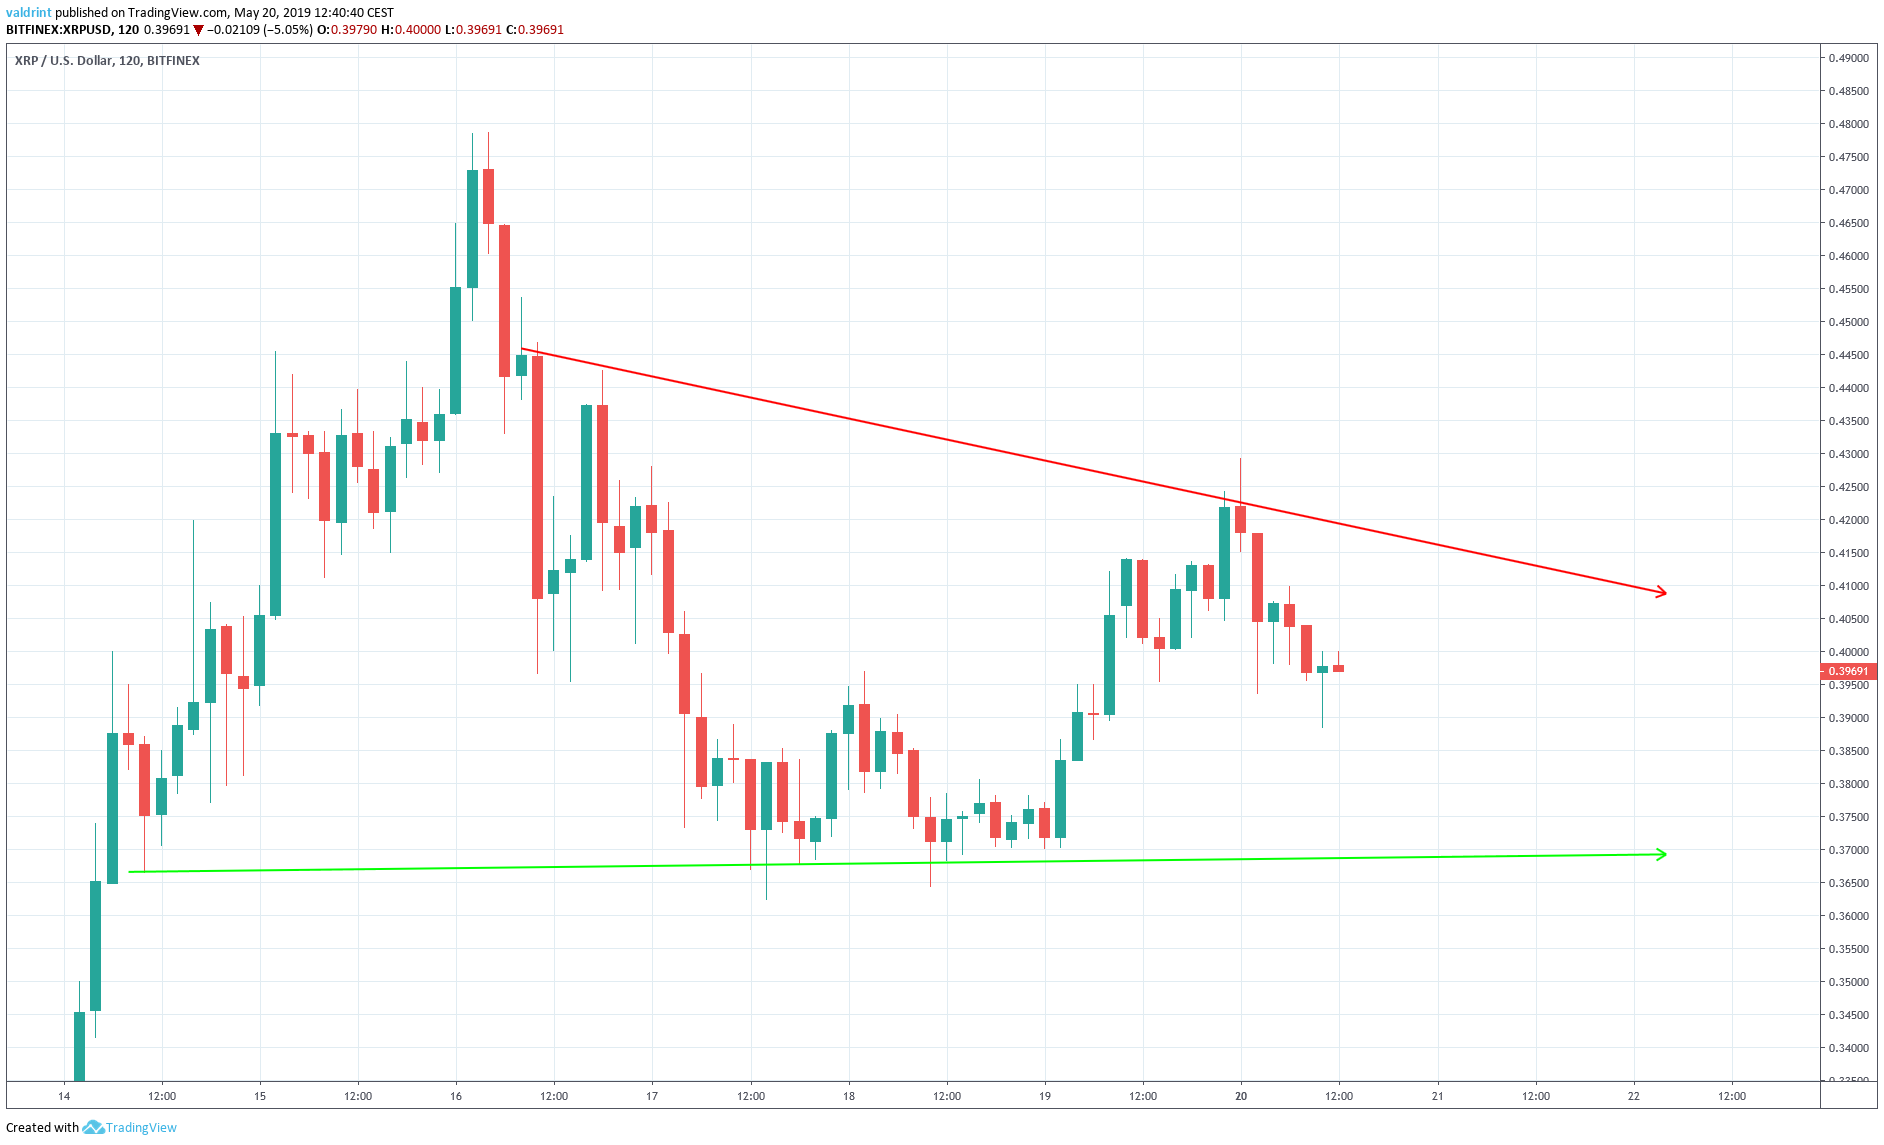
On May 17, the price reached the support line, rebounded, and then fell back to reach the line on 18. Price then rose to touch the resistance line on May 20.
Since then, the price has decreased. At the time of writing, XRP was trading near the middle of the triangle. Because this is a bearish pattern, we might expect future price decreases.
To better asses this possibility, XRP is analyzed at two-hour intervals alongside the RSI below:
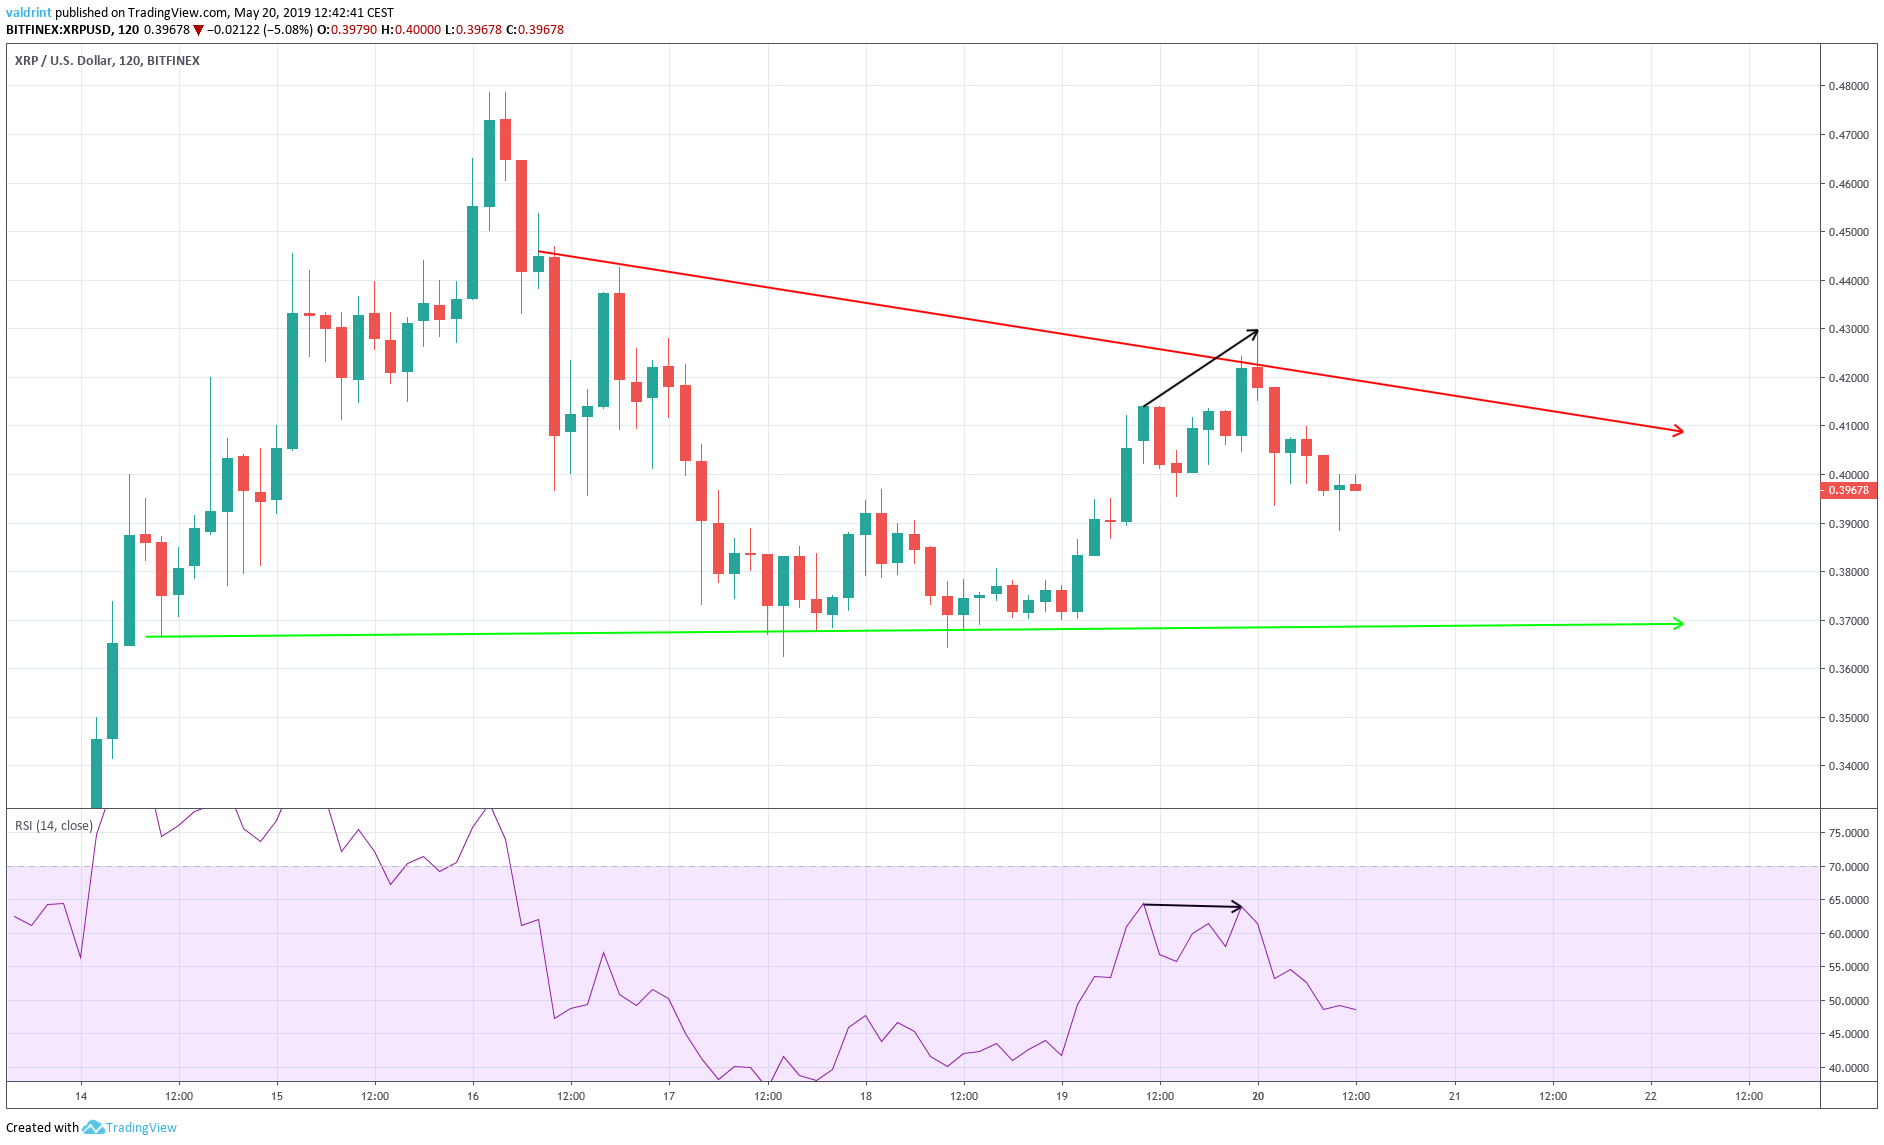
On May 19, the price reached a high of $0.414. It continued to increase and reached a higher high of $0.429 the next day. Similarly, the RSI made the first high on May 19. However, it has continued to generate lower values since.
Like XLM, XRP is exhibiting bearish divergence in the RSI. Both coins are likely to fall farther toward their respective support lines.
Conclusion
To conclude, both XLM and XRP are trading inside triangle patterns; a neutral symmetrical triangle for XLM and a bearish descending one for XRP.
Furthermore, both of them have created a bearish divergence in the RSI. However, the divergence is only present in short-term timeframes and did not occur in the MACD. It is worth noting that Bitcoin (BTC) and many altcoins including Ethereum (ETH) and Ethereum Classic (ETC) also recently generated bearish divergence.
While further decreases appear likely for both XRP and XLM, we believe the outlook is a bit worse for XRP. Since the descending triangle is a bearish pattern, we believe price losses will be more significant for XRP than XLM.
A summary of our findings is presented in the table below:
Do you think the price of Stellar lumens will drop towards the support line? Will XRP breakdown from the triangle?
Disclaimer: This article is not trading advice and should not be construed as such. Always consult a trained financial professional before investing in cryptocurrencies, as the market is particularly volatile.


