


On May 16, the price of Ethereum (ETH) spiked to a high over $260 while Ethereum Classic (ETC) spiked to highs near $8.5 on May 16. Both have been decreasing since.
In this analysis, we assess the current trading patterns and technical indicators of ETH and ETC in attempt to determine if these price decreases will continue. This part of a continuing series of price analyses on the two coins.
Ethereum In a Broadening Wedge
ETH/USD reached a low of $227.2 on May 20. An increase took it to $244.02 the same day. The price has been trading inside a broadening ascending wedge since.
Price movements are traced in the graph below:
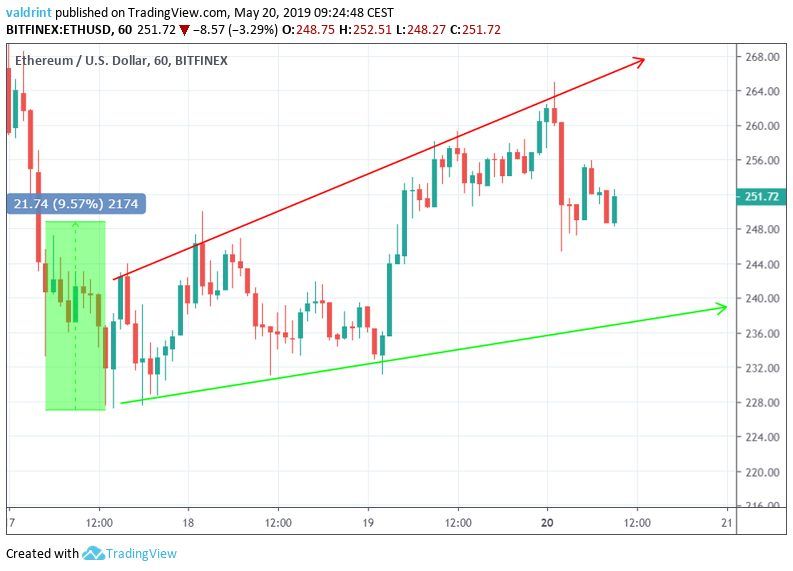
While inside the wedge, the price has increased by 9.57%. At the time of writing it is trading in the middle of the wedge. In order to figure out future price movements, a look at technical indicators is required.
The price of Ethereum is analyzed alongside the RSI and the MACD below: 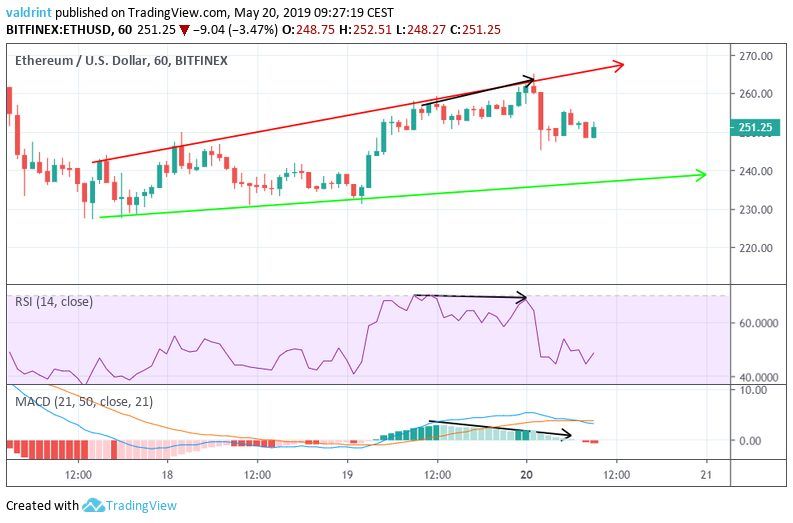
Similarly, the RSI and the MACD reached the first high on May 19. However, they have continued to generate lower values since. This bearish divergence often precedes price decreases. Thus, we believe that the price of ETH will decrease towards the support line of the wedge.
Ethereum Classic Inside An Ascending Wedge
ETC/USD reached a low of $6.21 on May 14. A rapid increase was followed by a decrease. The price made a high of $7.79 on May 19. It has been trading inside an ascending wedge since.
Price movements are outlined below:
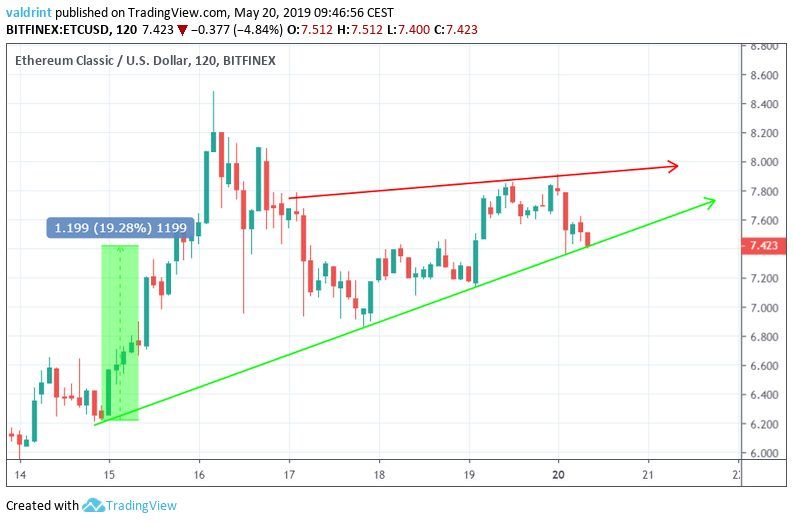
While inside the wedge, the price has increased by 19.3%. It is currently trading right at the support line of the wedge. In order to figure out whether a breakdown is imminent, ETC is analyzed on a longer timeframe alongside the RSI and the MACD below:
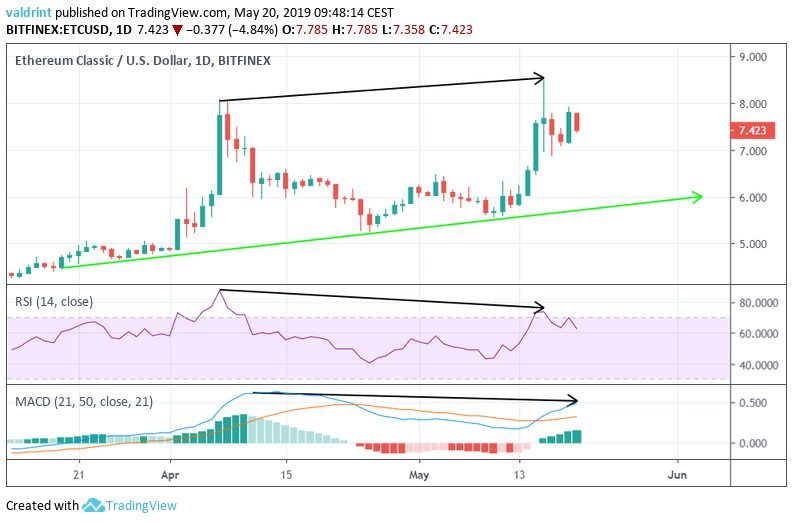
On Apr 7 the price made a high of $8.08. A gradual decrease was followed by an increase. The price made a higher high of $8.48 on May 16.
Similarly, the RSI and the MACD made the first high on Apr 7. However, they have continued to generate lower values since.
Both ETH and ETC, thus, have developed bearish divergence. We believe that ETC is likely to drop towards the support line near $6.
Conclusion
In the short term, ETH is trading inside a broadening wedge while ETC’s price is moving within an ascending wedge. Both of them have also generated short-term bearish divergence in the RSI and the MACD.
ETC has also generated long-term divergence whereas ETH has not. Therefore, while we believe that price decreases are in store for both ETH and ETC, we believe that they will be more significant for ETC.
It is worth noting that Bitcoin (BTC), Litecoin (LTC), and Bitcoin Cash (BCH) have also generated bearish divergence recently.
A summary is presented in the table below:
Do you think the price of ETC will break down? What about ETH? Let us know in the comments below:
Disclaimer: This article is not trading advice and should not be construed as such. Always consult a trained financial professional before investing in cryptocurrencies, as the market is particularly volatile.


