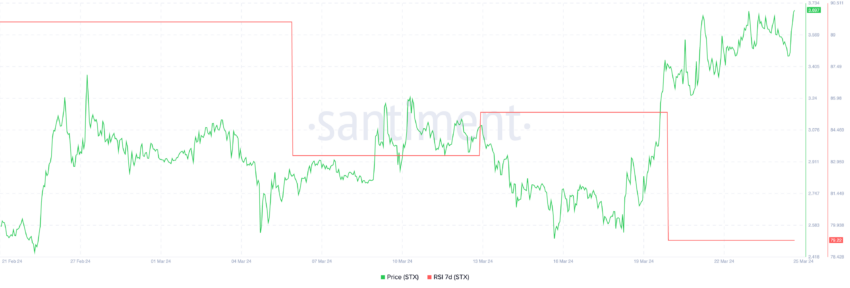
Stacks (STX) price is drawing attention after reaching a new all-time high. Its 7-day Relative Strength Index (RSI) dipped from 83 last week to its current level of 79. While this still suggests an overbought condition, the decline hints at a possible shift in momentum.
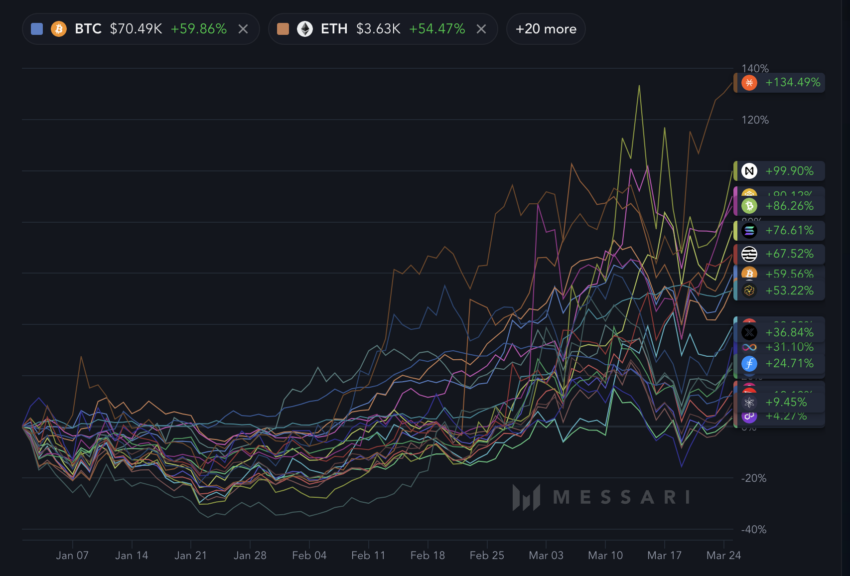
It’s important to note that despite this, STX remained the outperformer compared to the top 21 biggest coins in the market yesterday. Additionally, the current Exponential Moving Averages (EMA) lines paint a bullish picture, all sitting below the current price line. This technical indicator suggests that continued upward momentum could be in play.
RSI Hits 79, Overbought Territory
The recent dip in Stacks (STX) 7-day Relative Strength Index (RSI) has traders on alert. The RSI, a gauge of buying and selling pressure, has fallen from a lofty 83 last week to its current reading of 79. This four-point descent hints at a potential shift in momentum.

An RSI above 70 generally indicates an overbought condition, where the price might be ripe for a correction. While STX’s RSI remains in this zone, the recent decline suggests a possible cooling-off period. This doesn’t guarantee an immediate price drop, but it’s a signal to watch.
If the RSI continues its downward trend and dips below 70 into the neutral territory (between 40 and 70), it could signify waning bullish sentiment and a potential price decline. On the other hand, a rebound and climb above 80 would suggest a return of strong buying pressure, potentially leading to further price increases.
Read More: How To Buy Bitcoin (BTC) on eToro: A Step-by-Step Guide
STX Is The Winner Among Top Coins
Analyzing STX’s year-to-date growth in 2024 shows that the coin has been on a tear, surging more than 130%. On January 1, its price was a mere $1.59, and it now trades well above $3.60.
When compared against the top 21 coins by market capitalization, excluding stablecoins and memecoins, Stacks reigns supreme. It has significantly outperformed NEAR (99%), BNB (90%), SOL (76%), and even BTC (59%).

This strong momentum and exceptional growth in 2024 could be indicative of even greater things to come for STX. As the Stacks ecosystem continues to develop and gain traction, the value of the coin could see further increases.
The rise of decentralized applications on Stacks and a new all-time high for BTC are all positive signs that could fuel additional growth for STX.
STX Price Prediction: Will The Bull Run Continue?
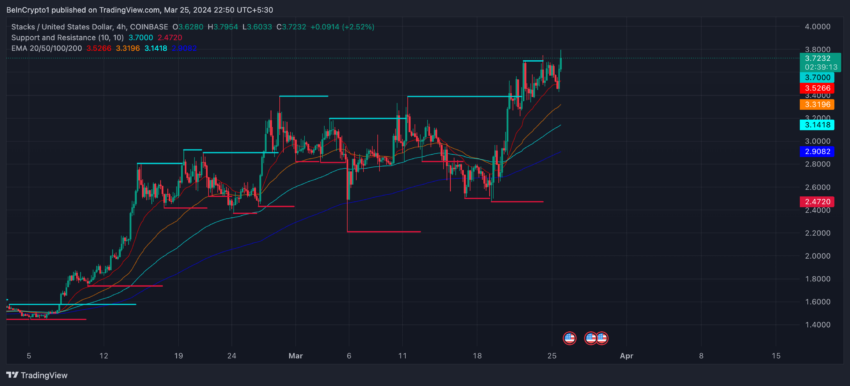
The recent behavior of the Stacks (STX) price suggests a bullish market sentiment. Highlighting this optimism is the golden cross observed approximately three days ago, where the short-term Exponential Moving Averages (EMAs) crossed above the long-term EMAs. This classic bullish signal often precedes a sustained upward price movement.
EMAs serve to smoothen price data to identify the trend direction more clearly. By assigning more weight to recent price action, EMAs adapt more quickly than Simple Moving Averages to changing market conditions.

The positioning of the EMA lines indicates a healthy uptrend, with the 20 and 50-period EMAs situated above the 100 and 200-period EMAs. Such alignment supports the prospect of a continuing rise in STX prices. Since STX recently reached a new all-time high, if the uptrend continues, STX price may reach a new all-time high soon.
Conversely, should the price retract, the support zones at approximately $2.47 and $2.20 are likely areas where the price could stabilize.
Read More: Who Owns the Most Bitcoin in 2024?
Considering the favorable alignment of the EMA lines and the recent golden cross, there is a reasonable expectation that STX could extend its gains. However, as with all market analyses, this optimistic outlook remains contingent on the asset maintaining its momentum above crucial support levels.
A drop below these supports could invalidate the bullish scenario and lead to a reassessment of the short to medium-term price trajectory for STX.
Disclaimer
In line with the Trust Project guidelines, this price analysis article is for informational purposes only and should not be considered financial or investment advice. BeInCrypto is committed to accurate, unbiased reporting, but market conditions are subject to change without notice. Always conduct your own research and consult with a professional before making any financial decisions. Please note that our Terms and Conditions, Privacy Policy, and Disclaimers have been updated.


