


Solana’s price has hit a critical golden ratio support at $20. Will this lead to a bearish break for SOL?
The daily chart exhibits a death cross formation in the EMAs, validating the trend’s bearish trajectory in the near to medium term.
Solana Price Corrects to Golden Ratio Support at $20
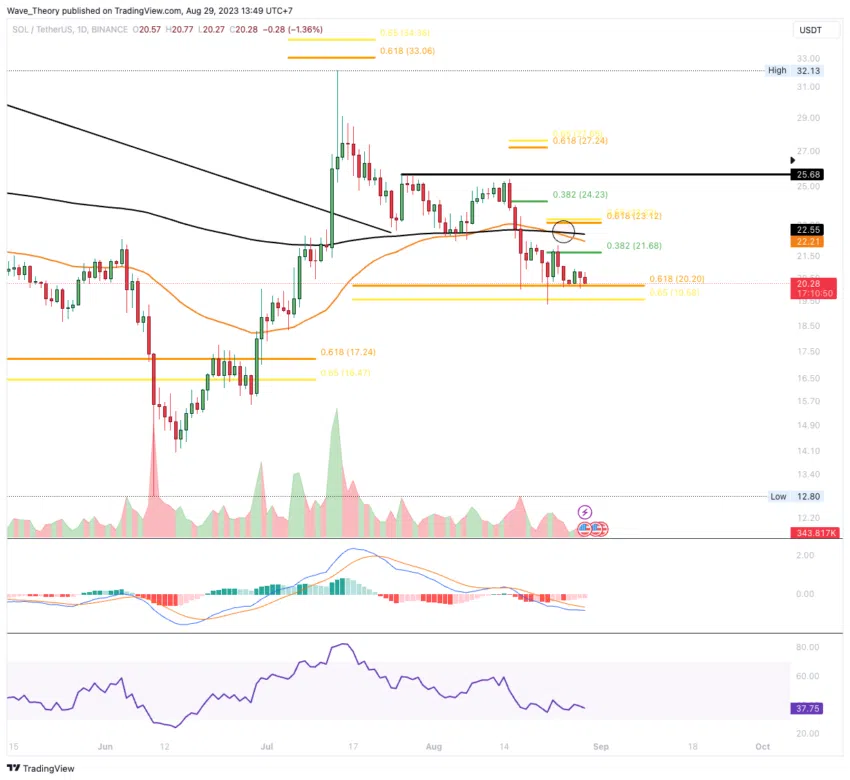
Notably, Solana’s price has recently descended from approximately $32 to roughly $20. At the $20 mark, the cryptocurrency is currently engaging with substantial golden ratio support.
Upon reaching this level, Solana demonstrated a bullish rebound; however, it encountered bearish rejection at the 0.382 Fibonacci level, approximately at $21.70. Nevertheless, Solana has a potential opportunity to experience another bullish rebound.
The MACD histogram has displayed bullish movement over the past few days, indicating the potential for a bullish crossover of the MACD lines on the daily chart. At the same time, the RSI is hovering in neutral territory.
Solana 4H Chart Shows Formation of Death Cross
A death cross has emerged in both the 4-hour (4H) and daily charts, reinforcing the bearish short-term trend. Moreover, the MACD histogram is declining bearish, possibly leading to a bearish crossover of the MACD lines.
The RSI is currently situated in neutral territory, offering no distinct signals.
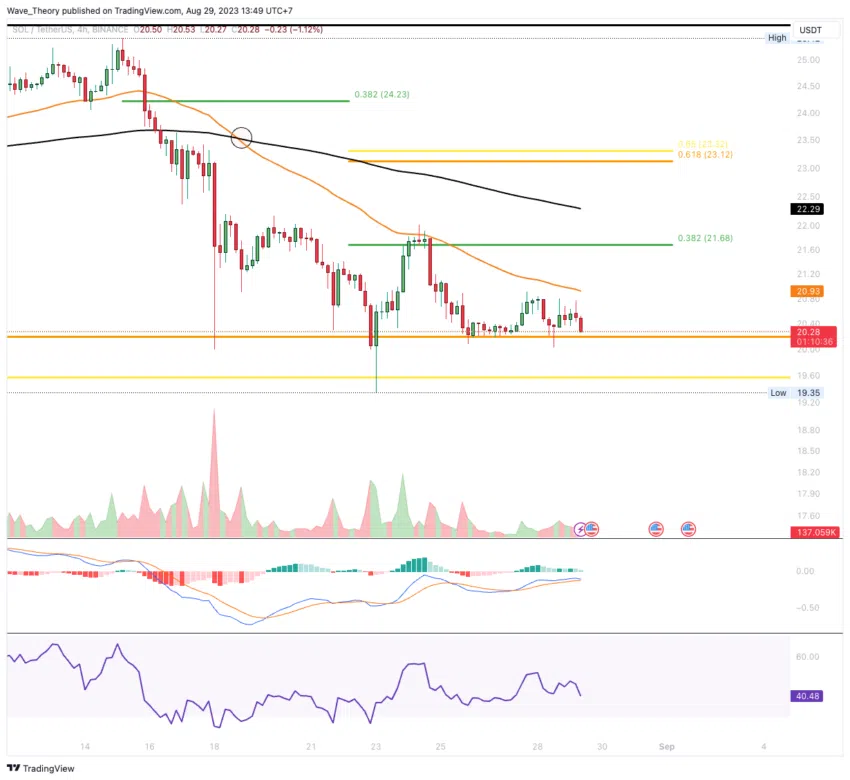
Solana experienced a bearish rejection at the 50-4H-EMA resistance level near $21.70, indicating a bearish sentiment. Unless Solana surpasses the 0.382 Fib resistance at approximately $21.70, it won’t be able to aim for the golden ratio level around $23.30.
Moreover, the 50-4H EMA is a notable obstacle at roughly $20.90 before reaching those levels.
Solana Price Weekly Chart: Bearish MACD Cross Raises Concerns
The continuity of Solana’s corrective movement persists unless it successfully breaches the bullish level of the golden ratio at approximately $27.50, which the 50-week EMA further accompanies as an added resistance.
Conversely, a crucial Fibonacci support remains at $17 on the downside. Maintaining Solana above this golden ratio mark at around $17 will preserve the bullish upward trend initiated at the start of the year.
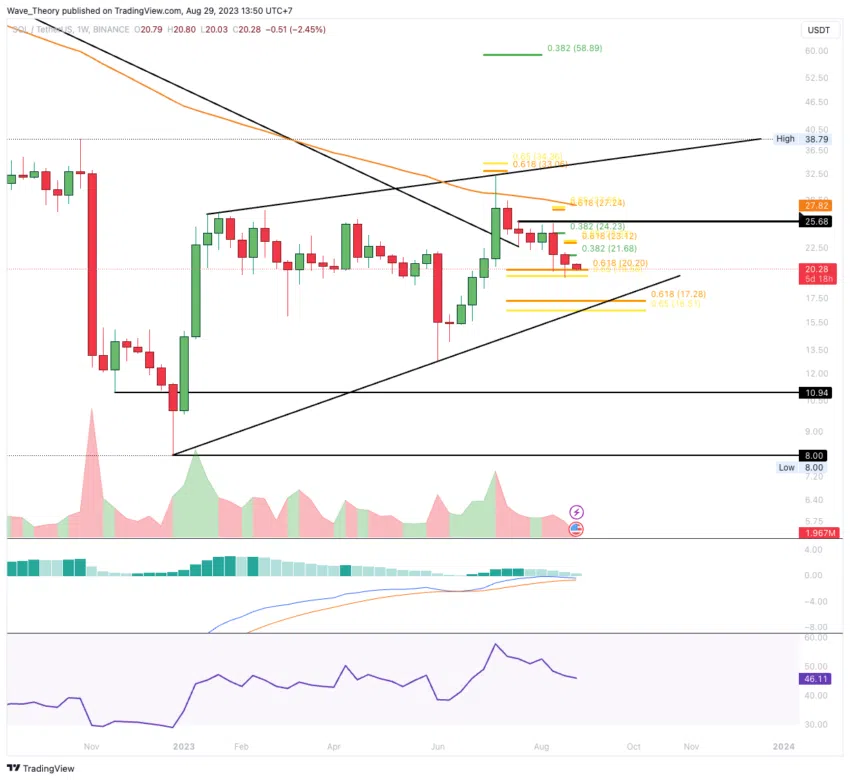
The outlook remains bearish, as indicated by the MACD histogram’s consistent downward trend over the past few weeks, potentially leading to an impending bearish cross of the MACD lines.
The RSI, although situated in the neutral region, doesn’t provide definitive signals at this point.
Solana Price Analysis: Key Fibonacci Support at $17
Should Solana undergo a bearish break of the crucial golden ratio support at $17, it would reenter a downtrend.
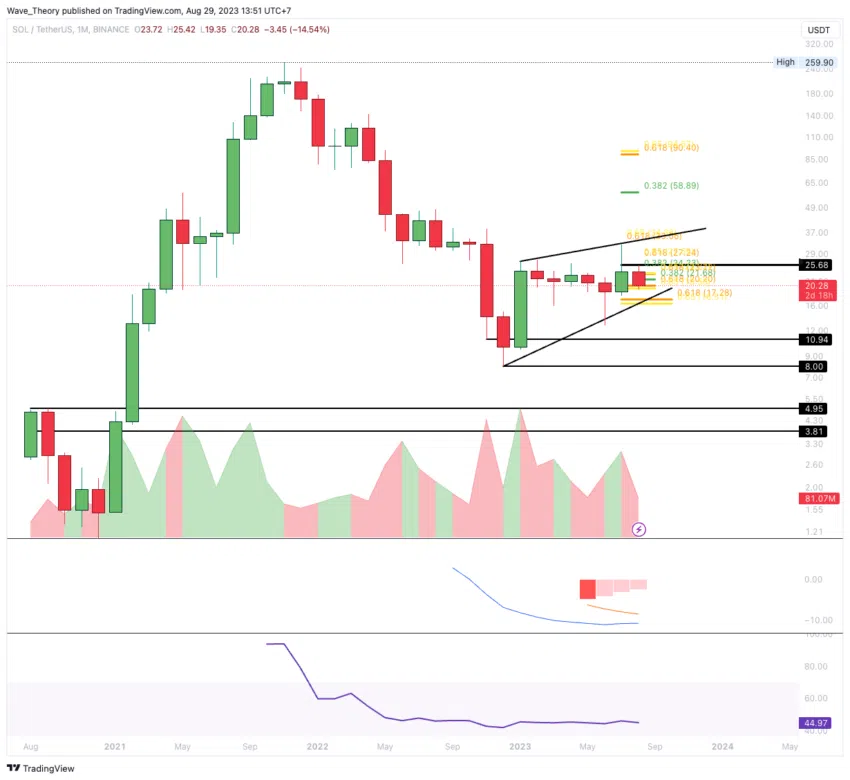
In this scenario, the price might retrace towards the horizontal support region between approximately $8 and $11.
Solana Price vs. BTC: Potential Correction to Golden Ratio Support
In its pairing against BTC, the SOL price has broken the 0.382 Fib support at 0.0008227 BTC, potentially leading to a retracement to the golden ratio support at around 0.000695 BTC.
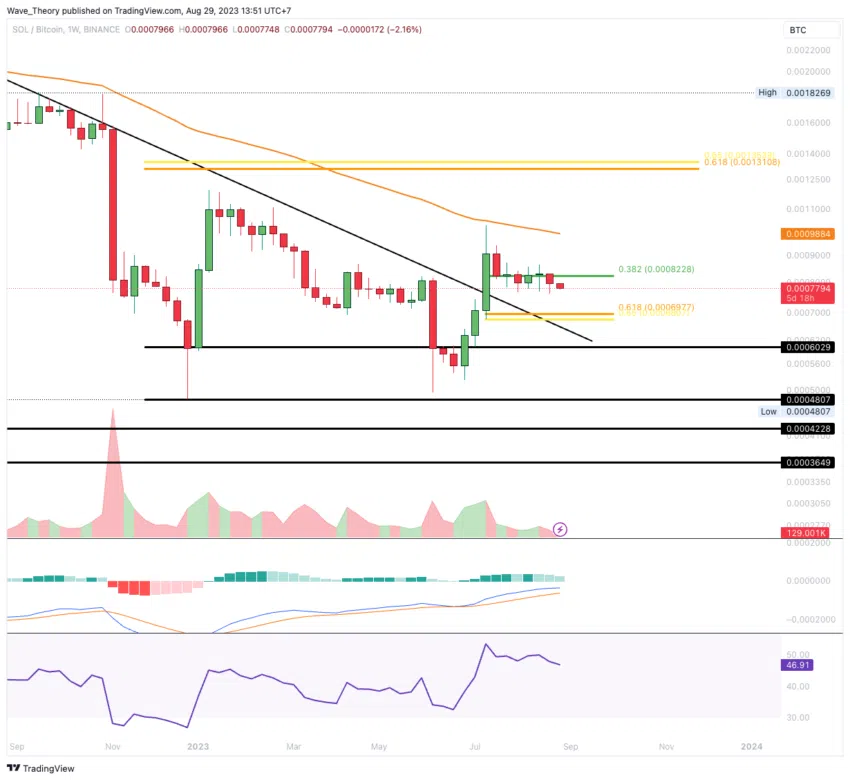
Despite the MACD lines being crossed bullishly, the MACD histogram has declined for three weeks, and the RSI remains in neutral territory. This suggests that the downward movement against BTC is likely to persist.
Check Out the Top 11 Crypto Communities To Join in 2023


