


The Solana (SOL) price has fallen since a high of $28.34 in July, validating the $27 area as resistance.
While most readings are bearish, the price trades inside a corrective pattern. Thus, a breakout from it can trigger a sharp increase.
Solana Price Falls After Rejection From $27 Level
The technical analysis for the weekly time frame shows that the SOL price broke out from a descending resistance line in July. Before the breakout, the line had been in place for 609 days, sloping the decrease since the all-time high price of $260.
While Solana was expected to increase significantly after the breakout, the price stalled at the $27 horizontal resistance level. The price initially moved above it but then created a long upper wick and fell below the area. This is a bearish sign that puts the validity of the breakout in doubt. Additionally, it confirms that the $27 area will act as resistance again.
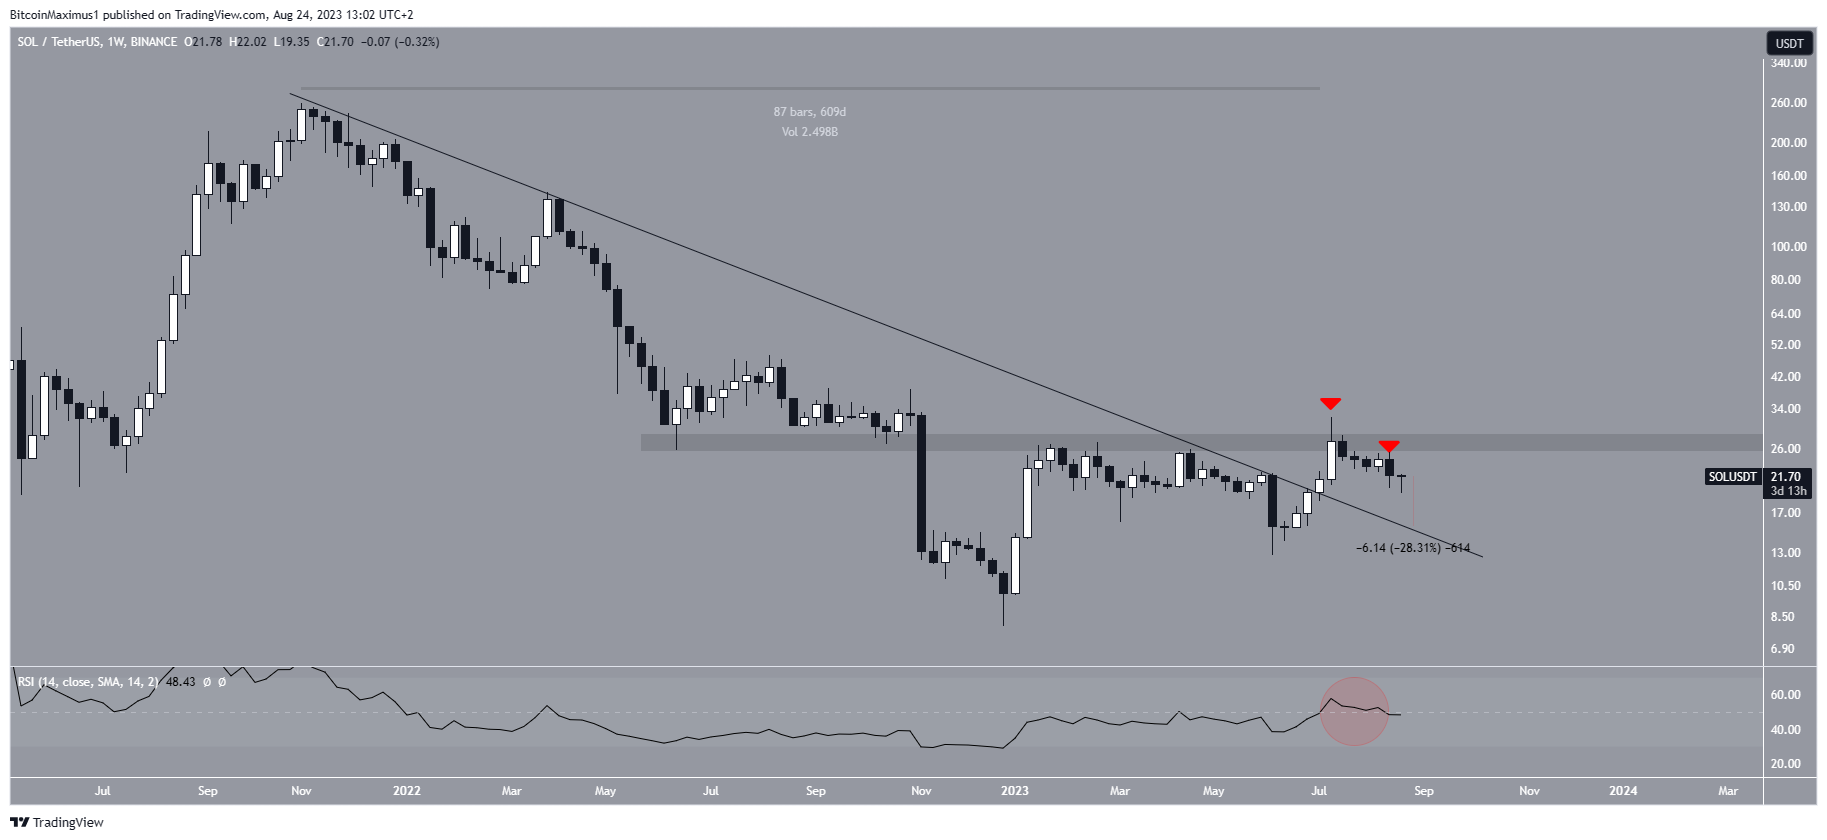
If the decrease continues, the descending resistance line will be at $15.50, 28% below the current price. It is common after breakouts that the price returns to validate it as support.
Despite the breakout, the weekly Relative Strength Index (RSI) is bearish. With the RSI as a momentum indicator, traders can determine whether a market is overbought or oversold and decide whether to accumulate or sell an asset.
Bulls have an advantage if the RSI reading is above 50 and the trend is upward, but if the reading is below 50, the opposite is true.
The indicator moved above 50 shortly after the breakout (red circle) but is now unlikely to decrease below. This further supports the possibility that the breakout was illegitimate and that new lows will follow.
As for new developments in the Solana network, Solana launched a new application that rewards Artificial Intelligence (AI) data providers with crypto.
SOL Price Prediction: Is Bounce the Beginning of a Reversal?
While the weekly timeframe technical analysis is neutral, the daily trend displays sentiment leaning on bearish. The main reason for this is the deviation above the $27 resistance area and the subsequent decrease below it.
However, the price has traded inside a descending parallel channel since then. These channels usually contain corrective movements. Therefore, it is possible that the price will break out from it. If so, it will also be expected to clear the $27 resistance area.
If that occurs, a 115% increase to the next resistance at $46 will likely be the future price scenario.
However, it is also possible that the price will continue decreasing inside the channel until it reaches a long-term ascending support line that has been in place since the beginning of the year. If that happens, the price will likely reach the support line at $18 sometime in September.
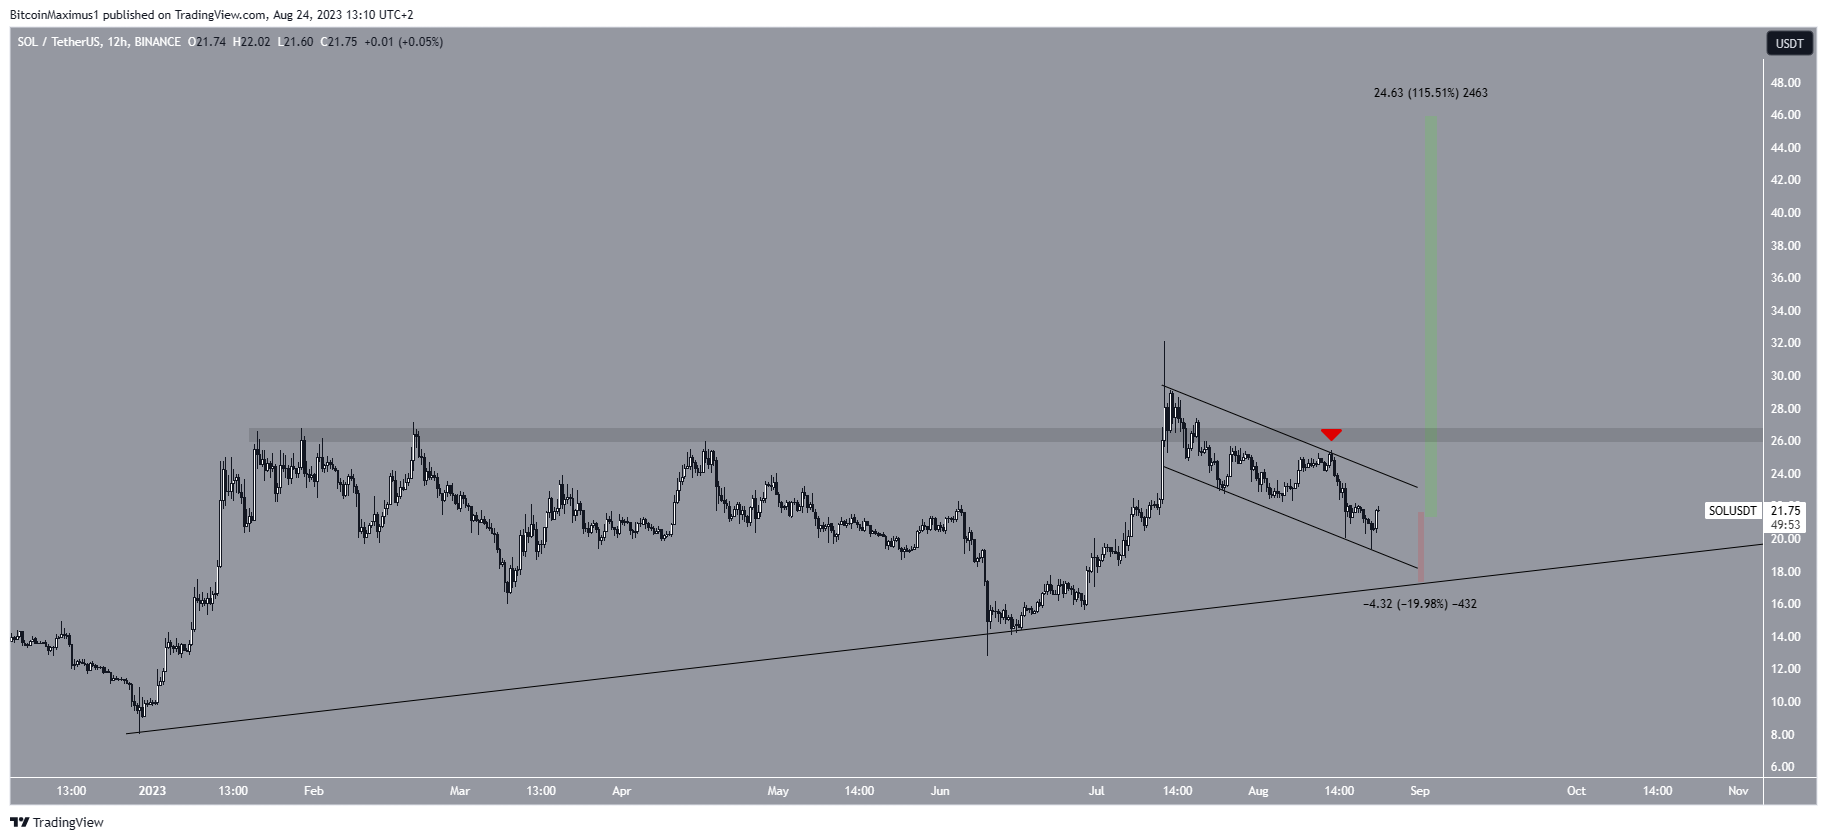
To conclude, the SOL price prediction will likely be determined by whether the price breaks out from its current descending parallel channel or breaks down below it instead. A breakout could trigger a 115% increase, while a breakdown will likely mean that a new yearly low will follow.
Check Out the Top 11 Crypto Communities To Join in 2023
For BeInCrypto’s latest crypto market analysis, click here


