


The Solana (SOL) price risks a collapse if it fails to hold above the $20 horizontal support level, but could accelerate if it breaks out from a long-term resistance line.
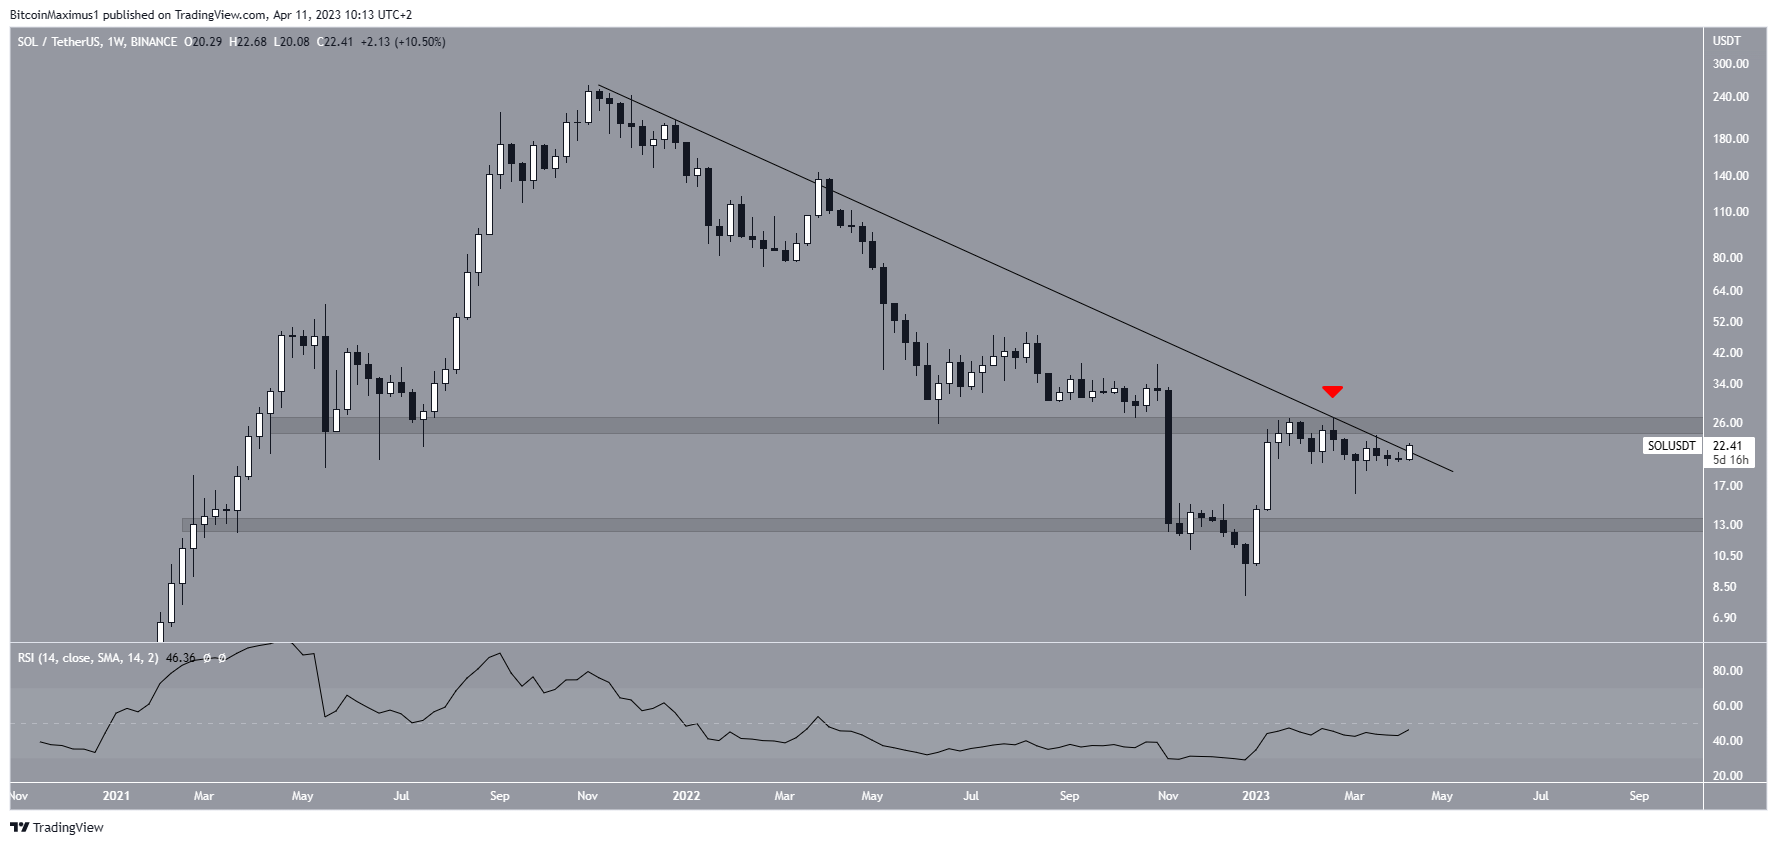
SOL is the native token of the Solana blockchain, created by Anatoly Yakovenko. The SOL token price has fallen since reaching an all-time high of $259.90 in November 2021. The slope of the decrease is measured by a descending resistance line, which more recently rejected the price in March 2023. The price is in the process of breaking out from the line.
Besides the resistance line, SOL also trades below the long-term $27 resistance area. The area was validated during the yearly high of $27.12.
Finally, the weekly RSI trades below 50 and is decreasing. This is considered a bearish sign, indicating that the long-term trend is bearish. If a breakdown occurs, the next closest support area would be $12.70.
Solana (SOL) Price Prediction for April – Collapse or Recovery?
The technical analysis from the daily time frame offers a mixed Solana price prediction for April. While the SOL price is above the $20 horizontal support area, it is the third time it has fallen to it while creating lower highs. This is considered a sign of weakness and could lead to a breakdown.
Previously, the SOL price broke down from a short-term ascending parallel channel. Since such channels usually contain corrective movements, the trend is likely bearish.
However, the price initiated an upward movement yesterday, creating the first higher low since the breakdown. Additionally, the daily RSI moved above 50.
If the movement since Feb. 20 is an A-B-C corrective structure, the SOL price could fall toward $12.13-$12.86. The target is found using the 0.786 Fib retracement support level (white) and giving waves A:C a 1:1 ratio (black). Since the area also coincides with the long-term $12.70 support area, it will likely act as the bottom.
On the other hand, an increase above the wave b high of $23.92 (red line) would indicate that the trend is bullish and an increase toward $27 is expected.
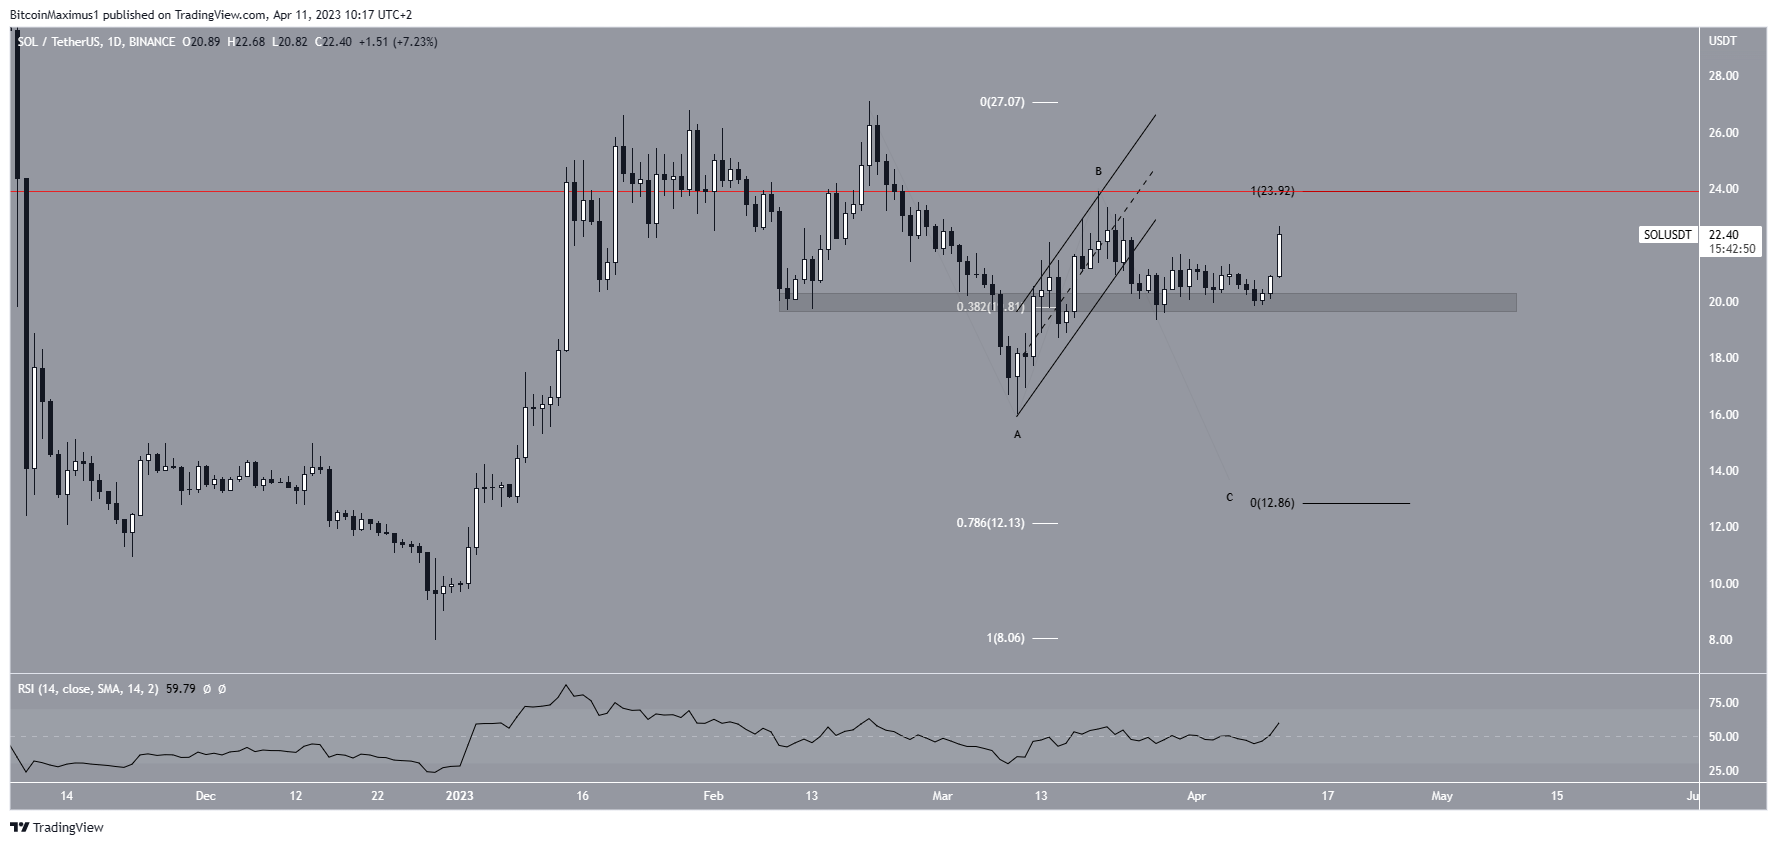
To conclude, the Solana price prediction for April will likely be determined by whether the price increases above $23.92 or fails to do so. An increase could lead to highs near $27 while a rejection could lead to a drop toward $12.70.
For BeInCrypto’s latest crypto market analysis, click here.


