
The Shiba Inu (SHIB) price created a bullish candlestick on January 8, saving a breakdown from a minor horizontal support area.
Is the bounce a sign of things to come, or will the SHIB price eventually break down?
Shiba Inu Bounces at Previous Resistance
The technical analysis from the weekly time frame shows that the SHIB price had fallen under a descending resistance trend line since August 2022. The decrease led to a low of $0.0000054 in June 2023. The price has increased since.
After several unsuccessful breakout attempts, SHIB finally moved above the descending resistance trend line in December. At the time, the trend line had existed for a little more than 480 days.
While the price reached a high of $0.000011 after the breakout, it has fallen since (red icon). Last week, SHIB validated the trend line as support (green icon) before bouncing.
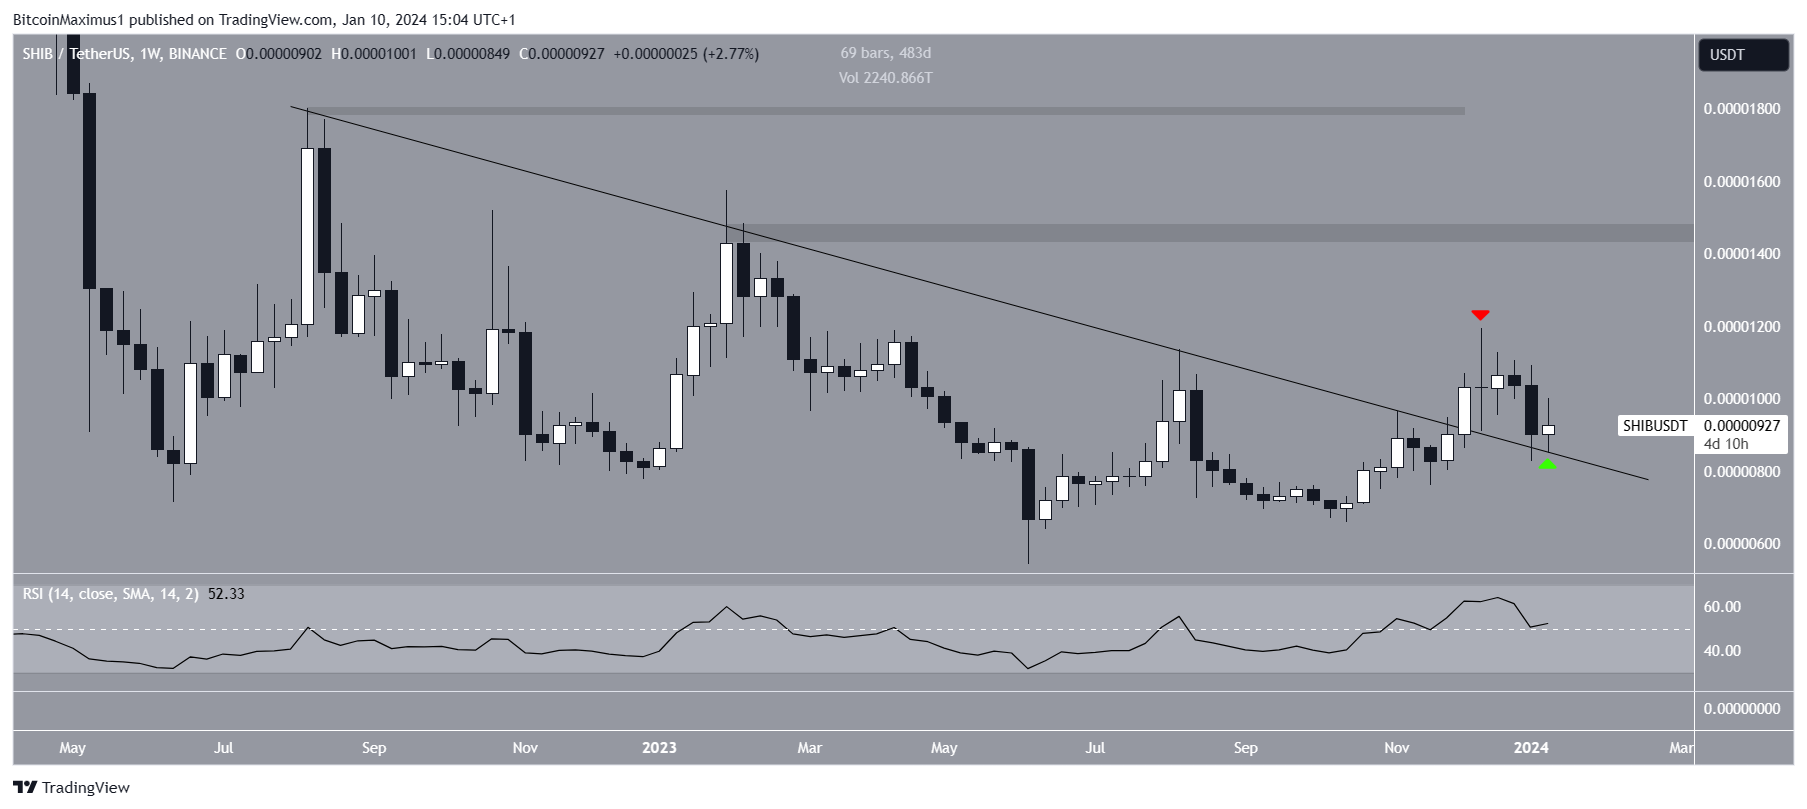
When evaluating market conditions, traders use the RSI as a momentum indicator to determine whether a market is overbought or oversold and whether to accumulate or sell an asset.
If the RSI reading is above 50 and the trend is upward, bulls still have an advantage, but if the reading is below 50, the opposite is true. The RSI is above 50, a sign of a bullish trend.
Read More: 11 Best Shiba Inu (SHIB) Wallets in 2023
SHIB Price Prediction: Has the Reversal Begun?
While the weekly time frame chart is decisively bullish, the daily one is only leaning positive.
The price action shows that the SHIB price has traded inside an ascending parallel channel since June 2022. The movement inside the channel led to the December 17, 2023, high of $0.0000119.
However, this validated the channel’s resistance trend line (red icon) and initiated the downward movement.
During the decrease, the SHIB price fell below the channel’s midline, and the RSI fell below 50. However, the SHIB price created a bullish candlestick on January 8 (green icon), moving above the minor support at $0.0000092. Also, the Shiba team announced that they burned more than 9 million SHIB tokens.
Nevertheless, the trend can be considered bullish if SHIB does not close below $0.0000092. Then, the price can increase by 27% to the channel’s resistance trend line at $0.0000123.
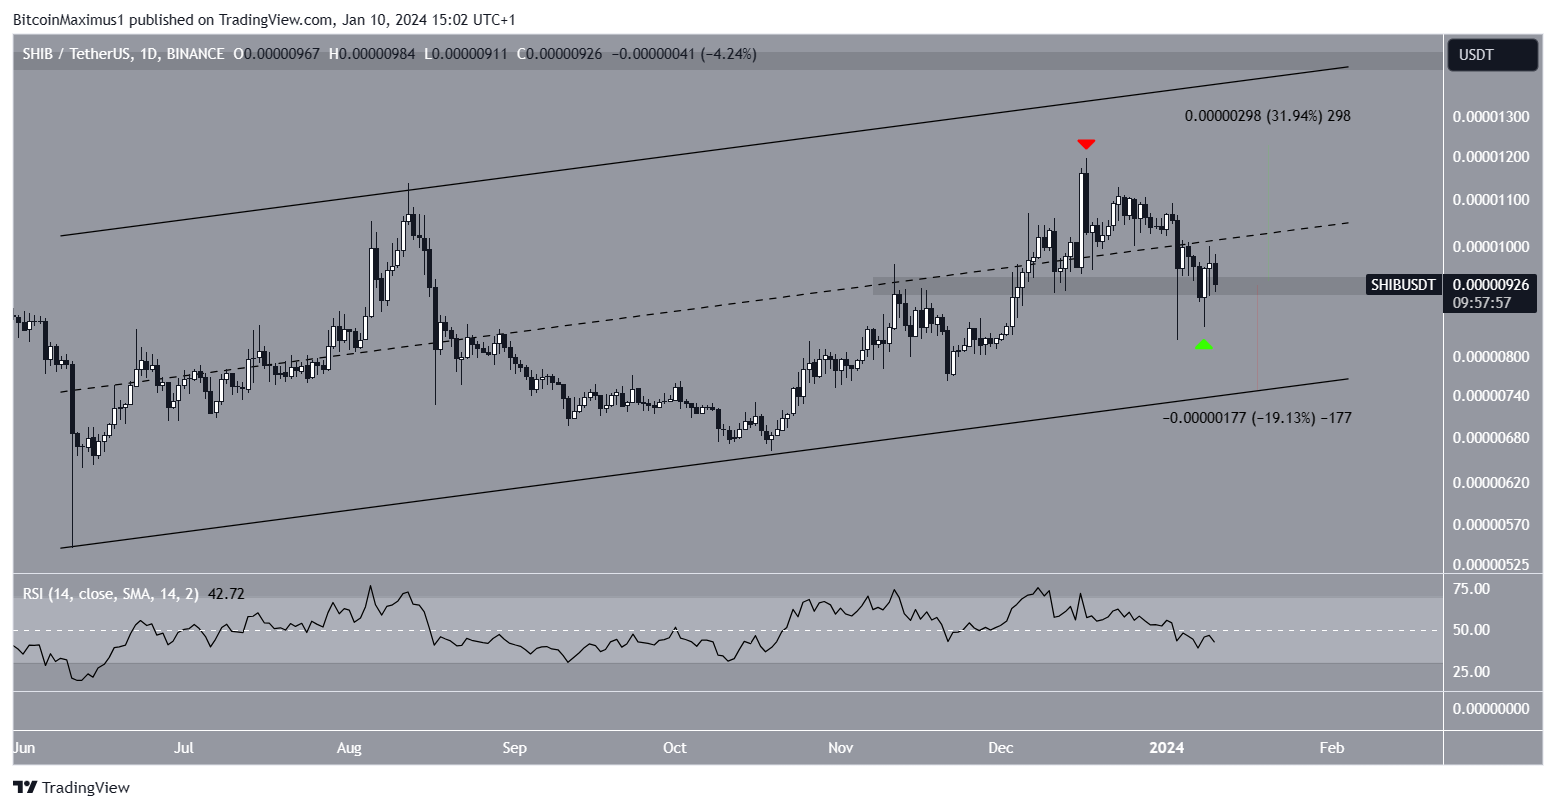
Despite this bullish SHIB price prediction, a close below $0.0000092 will invalidate the ongoing bounce. Then, the price can fall 22% to the channel’s support trend line at $0.0000077.
For BeInCrypto’s latest crypto market analysis, click here.
