
The Shiba Inu (SHIB) price has fallen since the start of 2024 and returned to a horizontal support area.
SHIB still trades inside the confines of a pattern that has existed since June 2023. Will it break out or fall down?
SHIB Returns to Previous Resistance
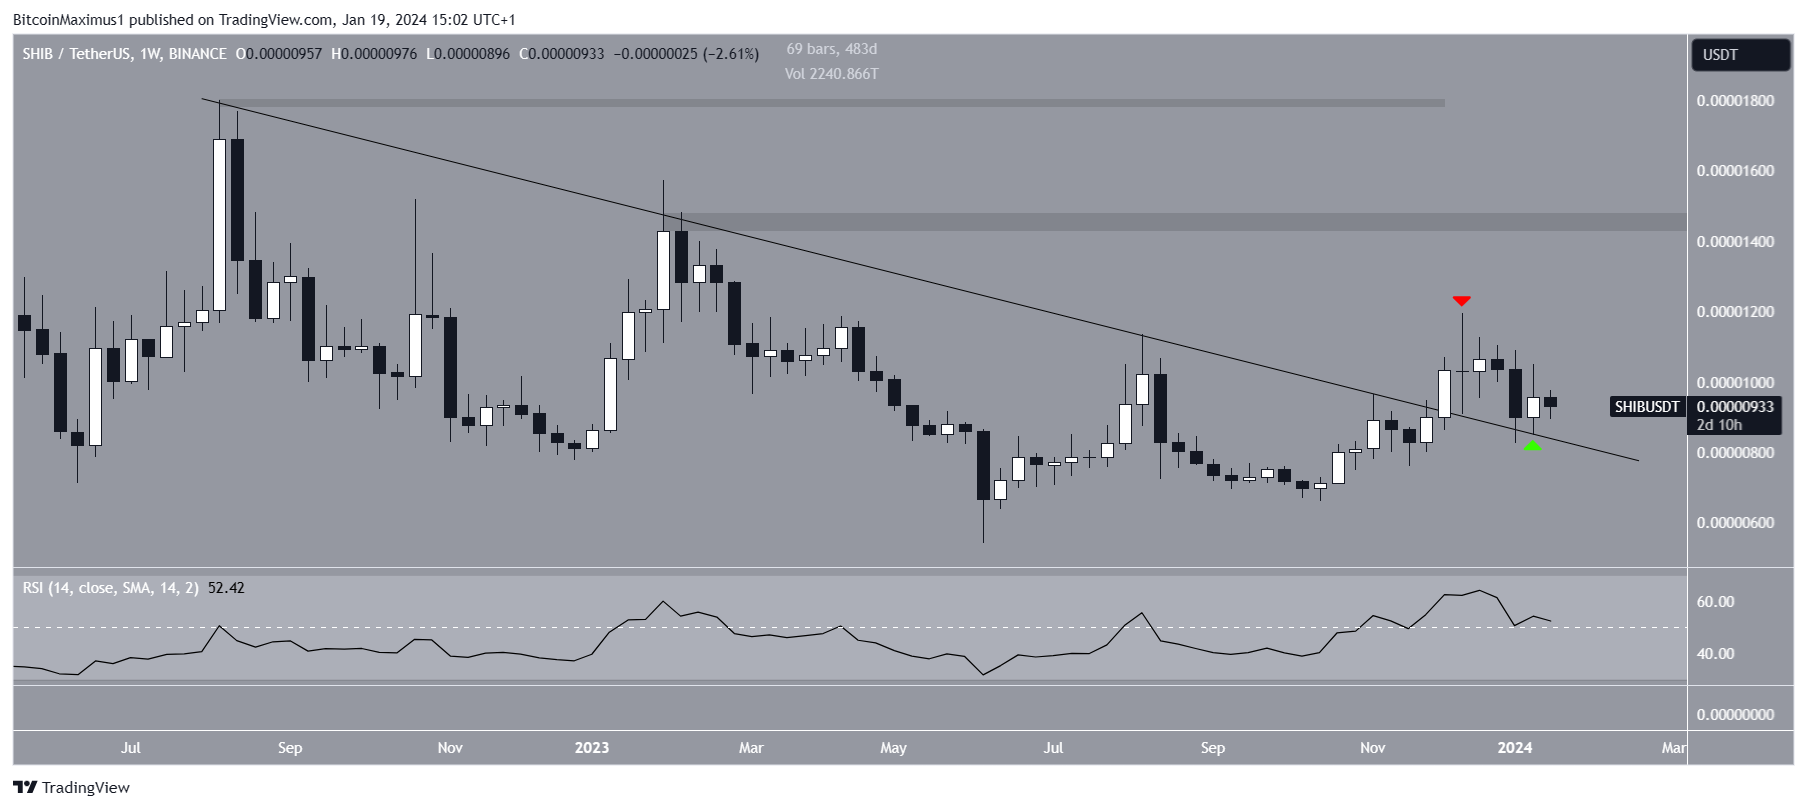
The weekly time frame technical analysis shows that the SHIB price has decreased under a descending resistance trend line since July 2022.
SHIB fell to a low of $0.0000054 during this drop in June 2023. Afterward, it started an upward movement and broke out from the descending resistance trend line in December, culminating with a high of $0.0000120 (red icon).
At the breakout, the trend line had existed for 483 days. The Shiba Inu price has fallen since, validating the trend line as support (red icon).
When evaluating market conditions, traders use the RSI as a momentum indicator to determine whether a market is overbought or oversold and whether to accumulate or sell an asset.
If the RSI reading is above 50 and the trend is upward, bulls still have an advantage, but if the reading is below 50, the opposite is true.
The weekly RSI gives a mixed reading since the indicator is falling but is above 50.
SHIB Price Prediction: What Happens Next?
Similarly to the weekly time frame, the daily one does not confirm the trend’s direction. This is because of the price action and RSI.
The price action shows that SHIB has fallen since an ascending parallel’s channel’s resistance trend line rejected it on December 17, 2023 (red icon). The decrease took the price inside the $0.0000093 horizontal support area, where it bounced (green icon).
However, the bounce was unsuccessful, and SHIB returned to the area again. Additionally, the daily RSI is below 50 and falling.
If SHIB closes below $0.0000093, it can fall 20% to the channel’s ascending support trend line at $0.0000080.
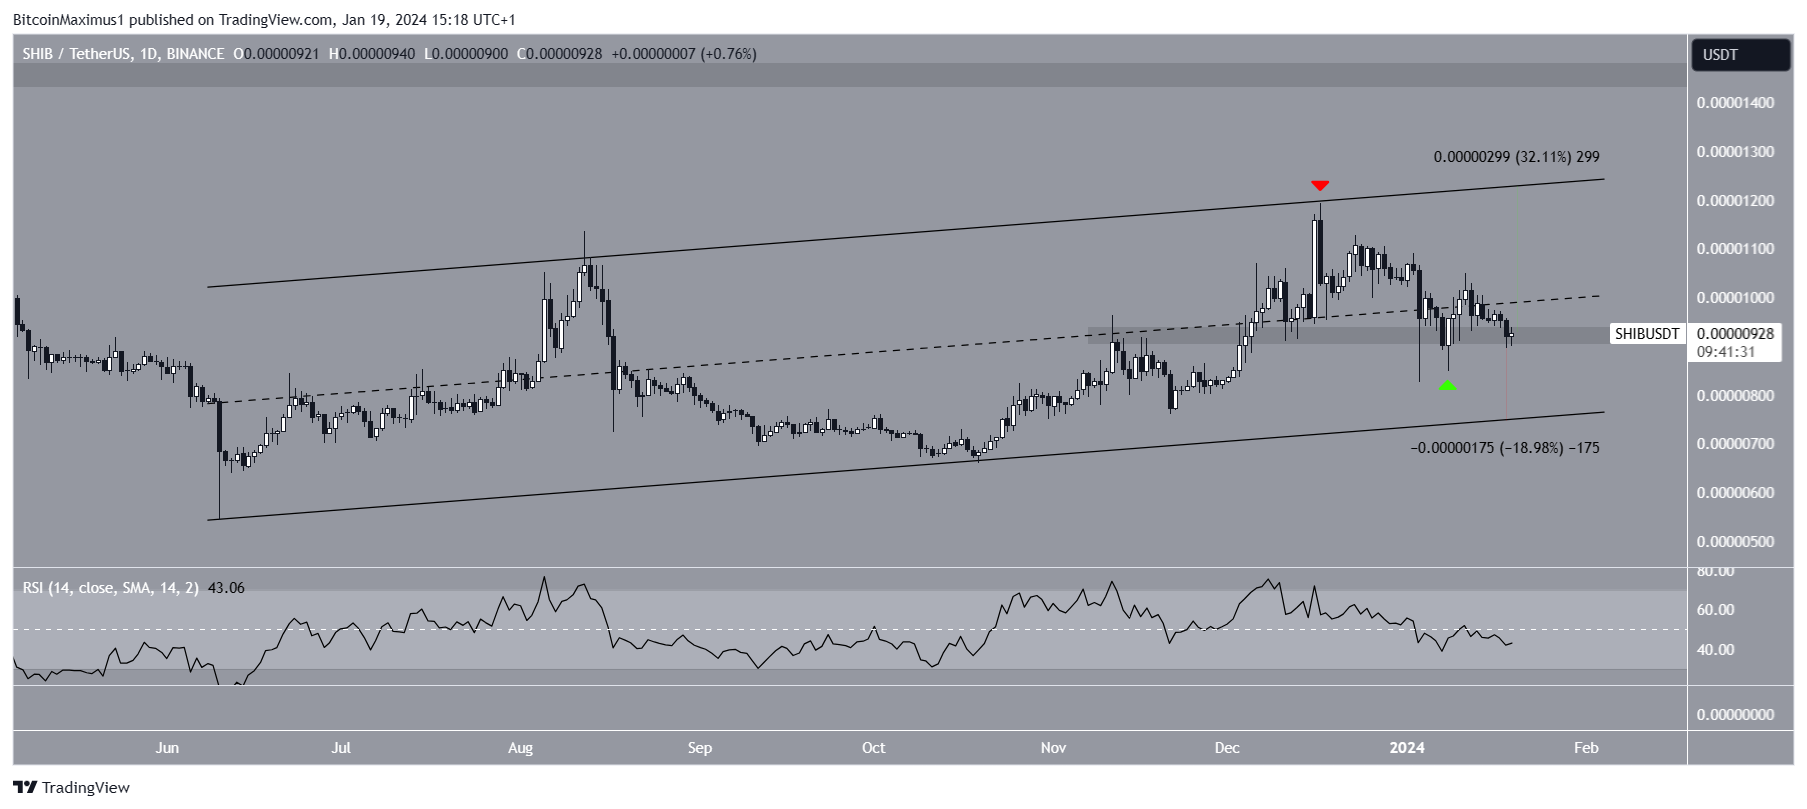
Despite this bearish SHIB price prediction, a strong bounce can trigger a 33% increase to the channel’s resistance trend line at $0.0000120.
For BeInCrypto’s latest crypto market analysis, click here.
