


Shiba Inu’s (SHIB) price broke out from a short-term descending resistance trend line but did not sustain its upward movement.
SHIB trades under a longer-term descending resistance trend line and in the lower portion of a corrective pattern.
SHIB Falls Under Long-Term Resistance
The weekly time frame technical analysis shows the SHIB price has fallen under a descending resistance trend line since August 2022. The resistance trend line has caused numerous rejections, the most recent in December 2023 (red icon). This trend line has existed for 560 days.
During this time, the SHIB price broke down from a horizontal support area. However, it reclaimed it shortly afterward instead of accelerating the downward movement. Despite reclaiming the area, SHIB did not break out from the descending resistance trend line.
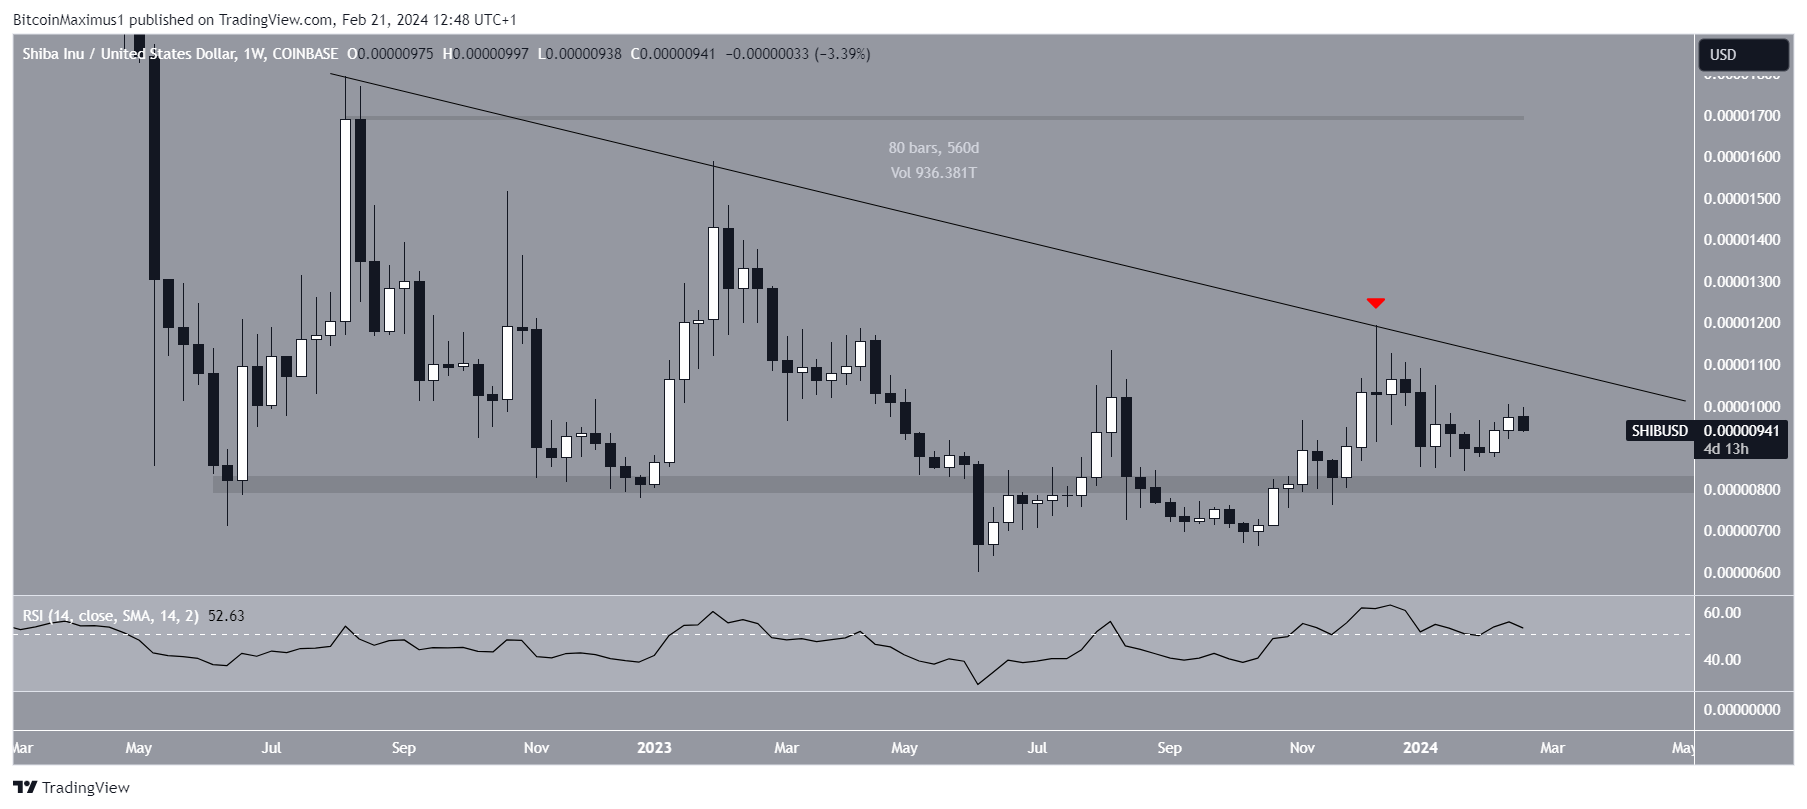
Furthermore, the weekly Relative Strength Index (RSI) does not confirm the trend’s direction. When evaluating market conditions, traders use the RSI as a momentum indicator to determine whether a market is overbought or oversold and whether to accumulate or sell an asset.
If the RSI reading is currently above 50 and the trend is upward, indicating bulls still have an advantage, but if the reading is below 50, the opposite will be true. While the RSI is above 50, it is also trending downward.
SHIB Price Prediction: Can Price Begin Upward Movement?
The technical analysis of the daily time frame gives an undetermined outlook because of the price action and RSI. The price action shows that SHIB broke out from a descending resistance trend line. However, it still trades in the lower portion of a longer-term ascending parallel channel since its midline rejected it on February 14, 2024.
Read More: How to Buy Shiba Inu (SHIB)
SHIB has nearly reached the closest minor support area at $0.0000092. During the downward movement, the daily RSI fell below 50 (red circle), indicating a bearish trend. Therefore, whether the SHIB price breaks down below the $0.000092 area or conversely breaks out from the middle of the channel can determine the future trend.
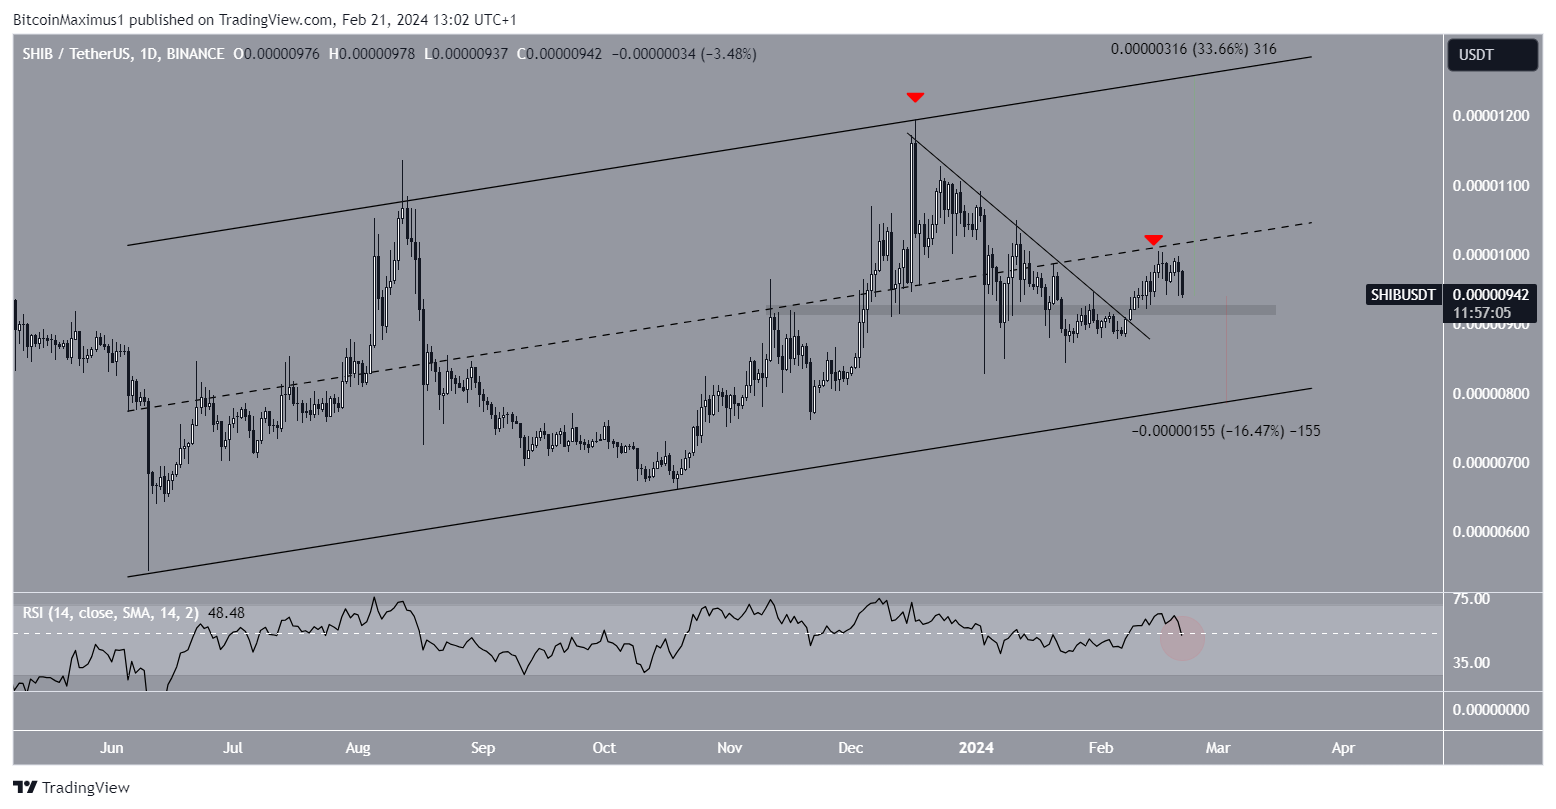
A breakdown can trigger a 16% drop to the channel’s support trend line at $0.0000080, while an increase could cause a 33% increase to the channel’s resistance trend line at $0.0000125.
For BeInCrypto‘s latest crypto market analysis, click here.
