


The Shiba Inu (SHIB) price has been trending upward since breaking out from a diagonal resistance trend line 10 days ago.
SHIB has nearly reached a confluence of horizontal and Fib resistance levels. Will it break out?
SHIB Reclaims Lost Support
The Shiba Inu price has traded inside an ascending parallel channel since June. The increase led to a high of $0.0000120 in December 2023 (red icon). This caused a significant downward movement, triggering a breakdown below the $0.0000092 support area. SHIB moved above it shortly afterward, rendering the previous breakdown invalid. The SHIB price is now approaching the channel’s midline.
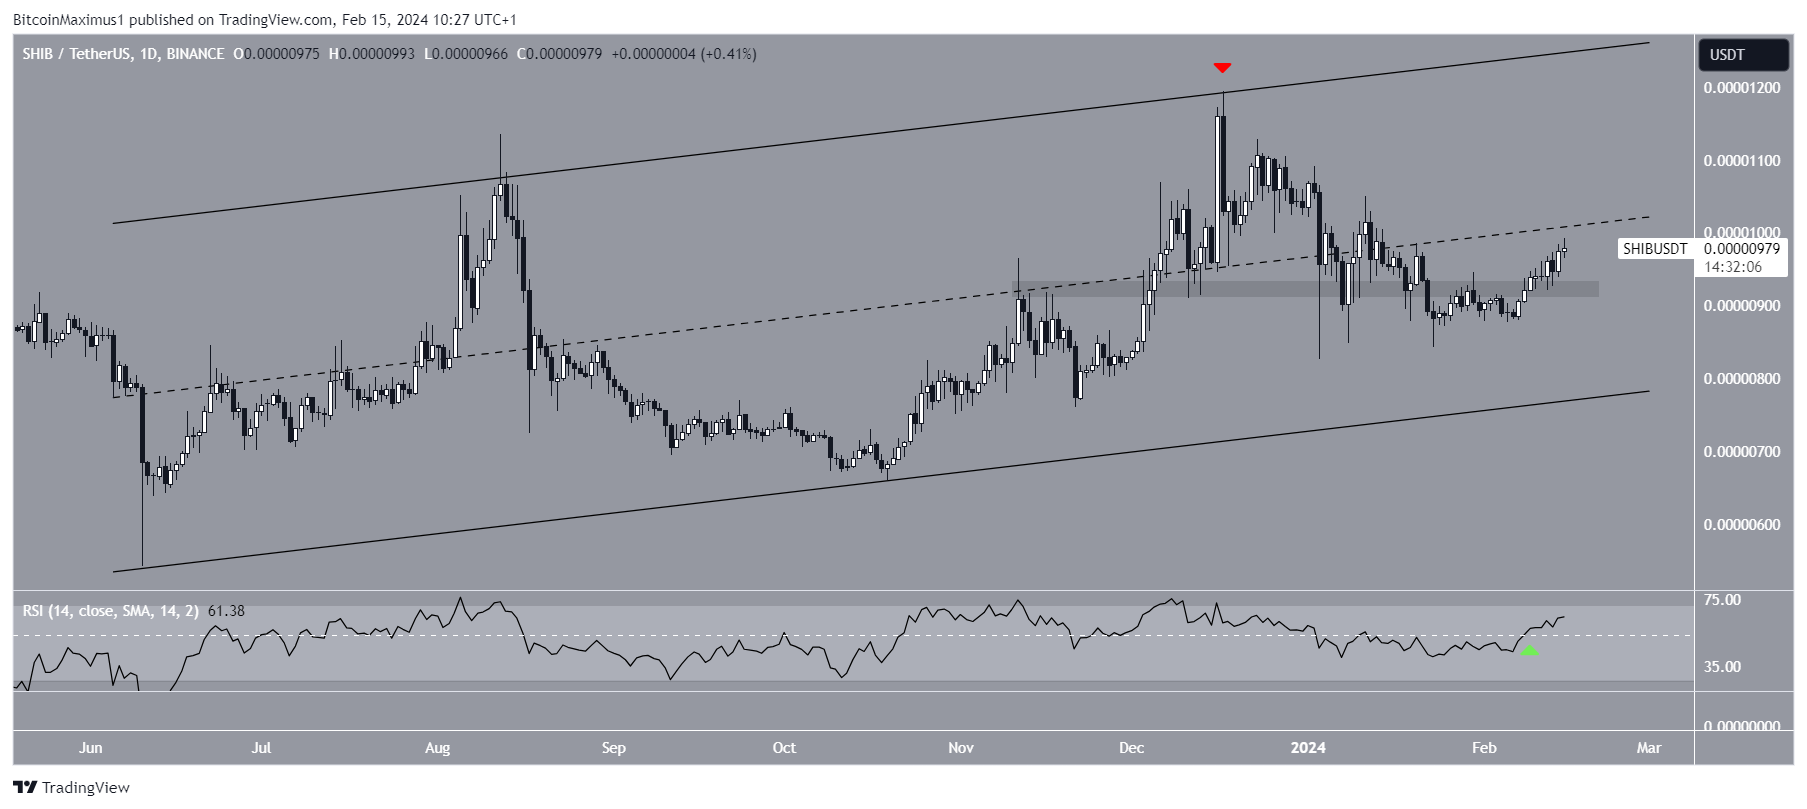
Even though the price has not broken out, the daily Relative Strength Index (RSI) gives bullish readings. Traders utilize the RSI as a momentum indicator to assess whether a market is overbought or oversold and whether to accumulate or sell an asset.
If the RSI reading is above 50 and the trend is upward, bulls still have an advantage, but if the reading is below 50, the opposite is true. The RSI is increasing and is above 50, both signs of a bullish trend.
SHIB Price Prediction: Will a Breakout Follow?
A closer look at the movement from the daily time frame shows that SHIB broke out from a descending resistance trend line on February 9. This catalyzed the upward movement.
Currently, SHIB encounters very strong resistance at $0.0000100, created by the 0.5 Fib retracement resistance level, the channel’s midline, and a horizontal resistance area. This is the pivotal resistance area that can determine if the SHIB trend is bullish or bearish.
A successful breakout above this confluence of resistance levels can cause a 30% increase to the channel’s resistance trend line at $0.0000125.
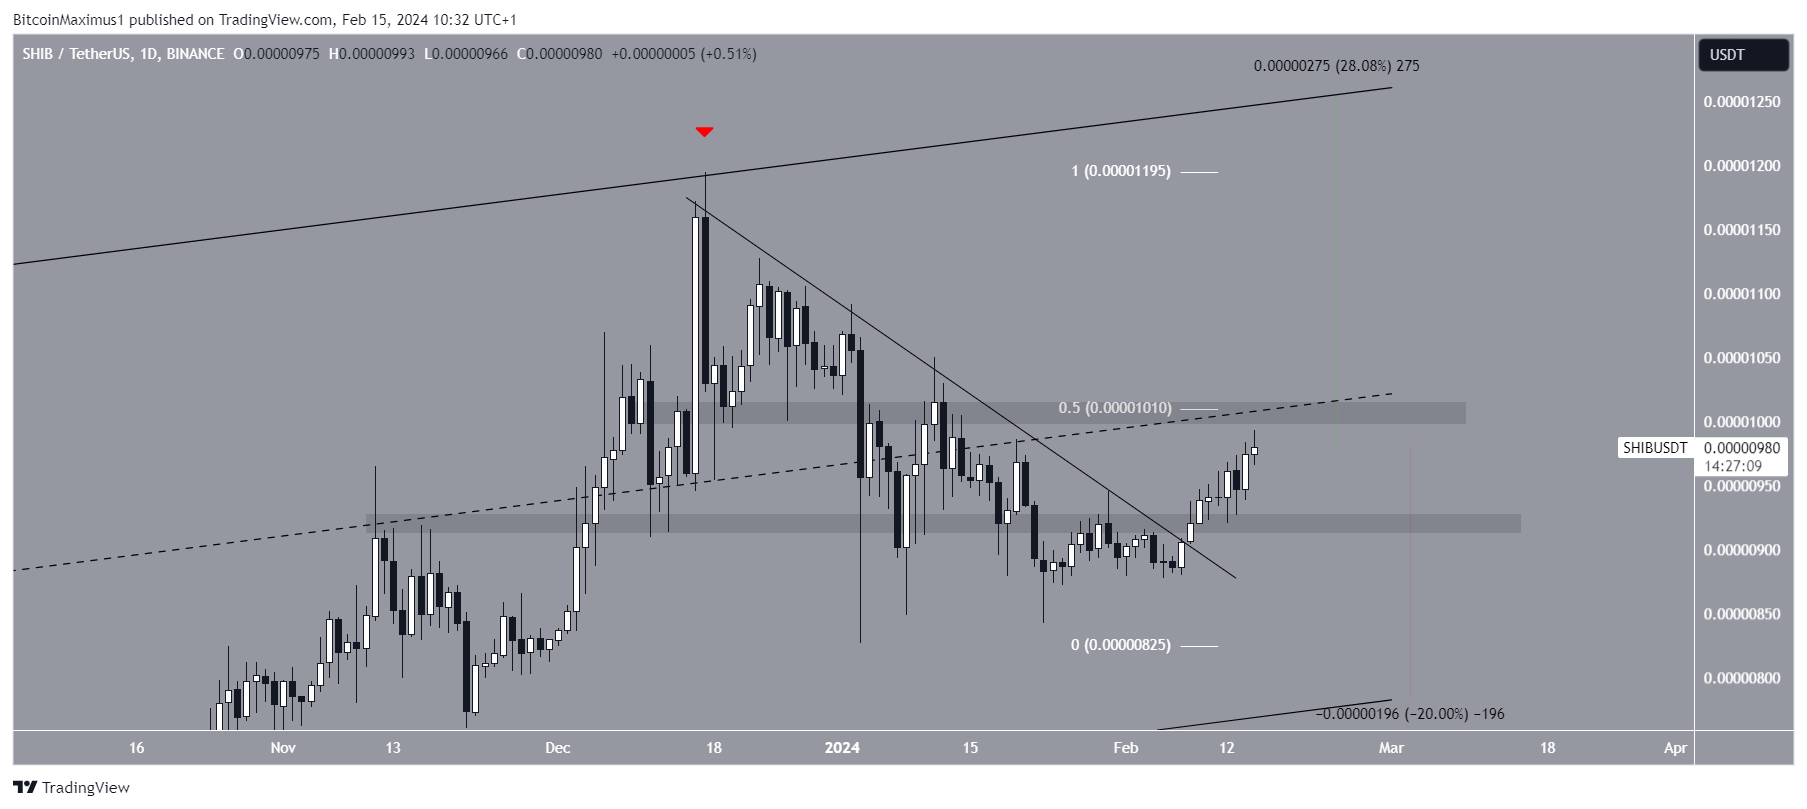
Despite this bullish SHIB price prediction, a breakdown below $0.00000920 will invalidate the ongoing breakout. If that happens, SHIB can fall 20% to the ascending support trend line at $0.00000800.
For BeInCrypto‘s latest crypto market analysis, click here.


