


The Shiba Inu (SHIB) price trades below long- and short-term diagonal resistance levels. It recently validated a confluence of resistances, increasing its legitimacy.
Both short- and long-term time frame readings support the continuing decrease. Thus, the meme coin is likely mired in a bearish trend.
Shiba Inu Price Breaks Down and Validates 350-Day Pattern as Resistance
The technical analysis conducted on a weekly time frame suggests a decisively bearish outlook for the Shiba Inu price. This assessment is primarily based on the breakdown of a symmetrical triangle pattern that has been present since June 2022.
When the pattern was breached, the price had traded inside it for a duration of 350 days. Breakdowns from such long-term patterns usually lead to sustained downward movements.
Following the breakdown, the SHIB price reached a horizontal support level at $0.0000058 and experienced a rebound. This support level has not been observed since the end of 2021.
While the level successfully initiated a bounce, the triangle’s support line rejected the SHIB price (red icon). Therefore, it is likely that the trend is still bearish.
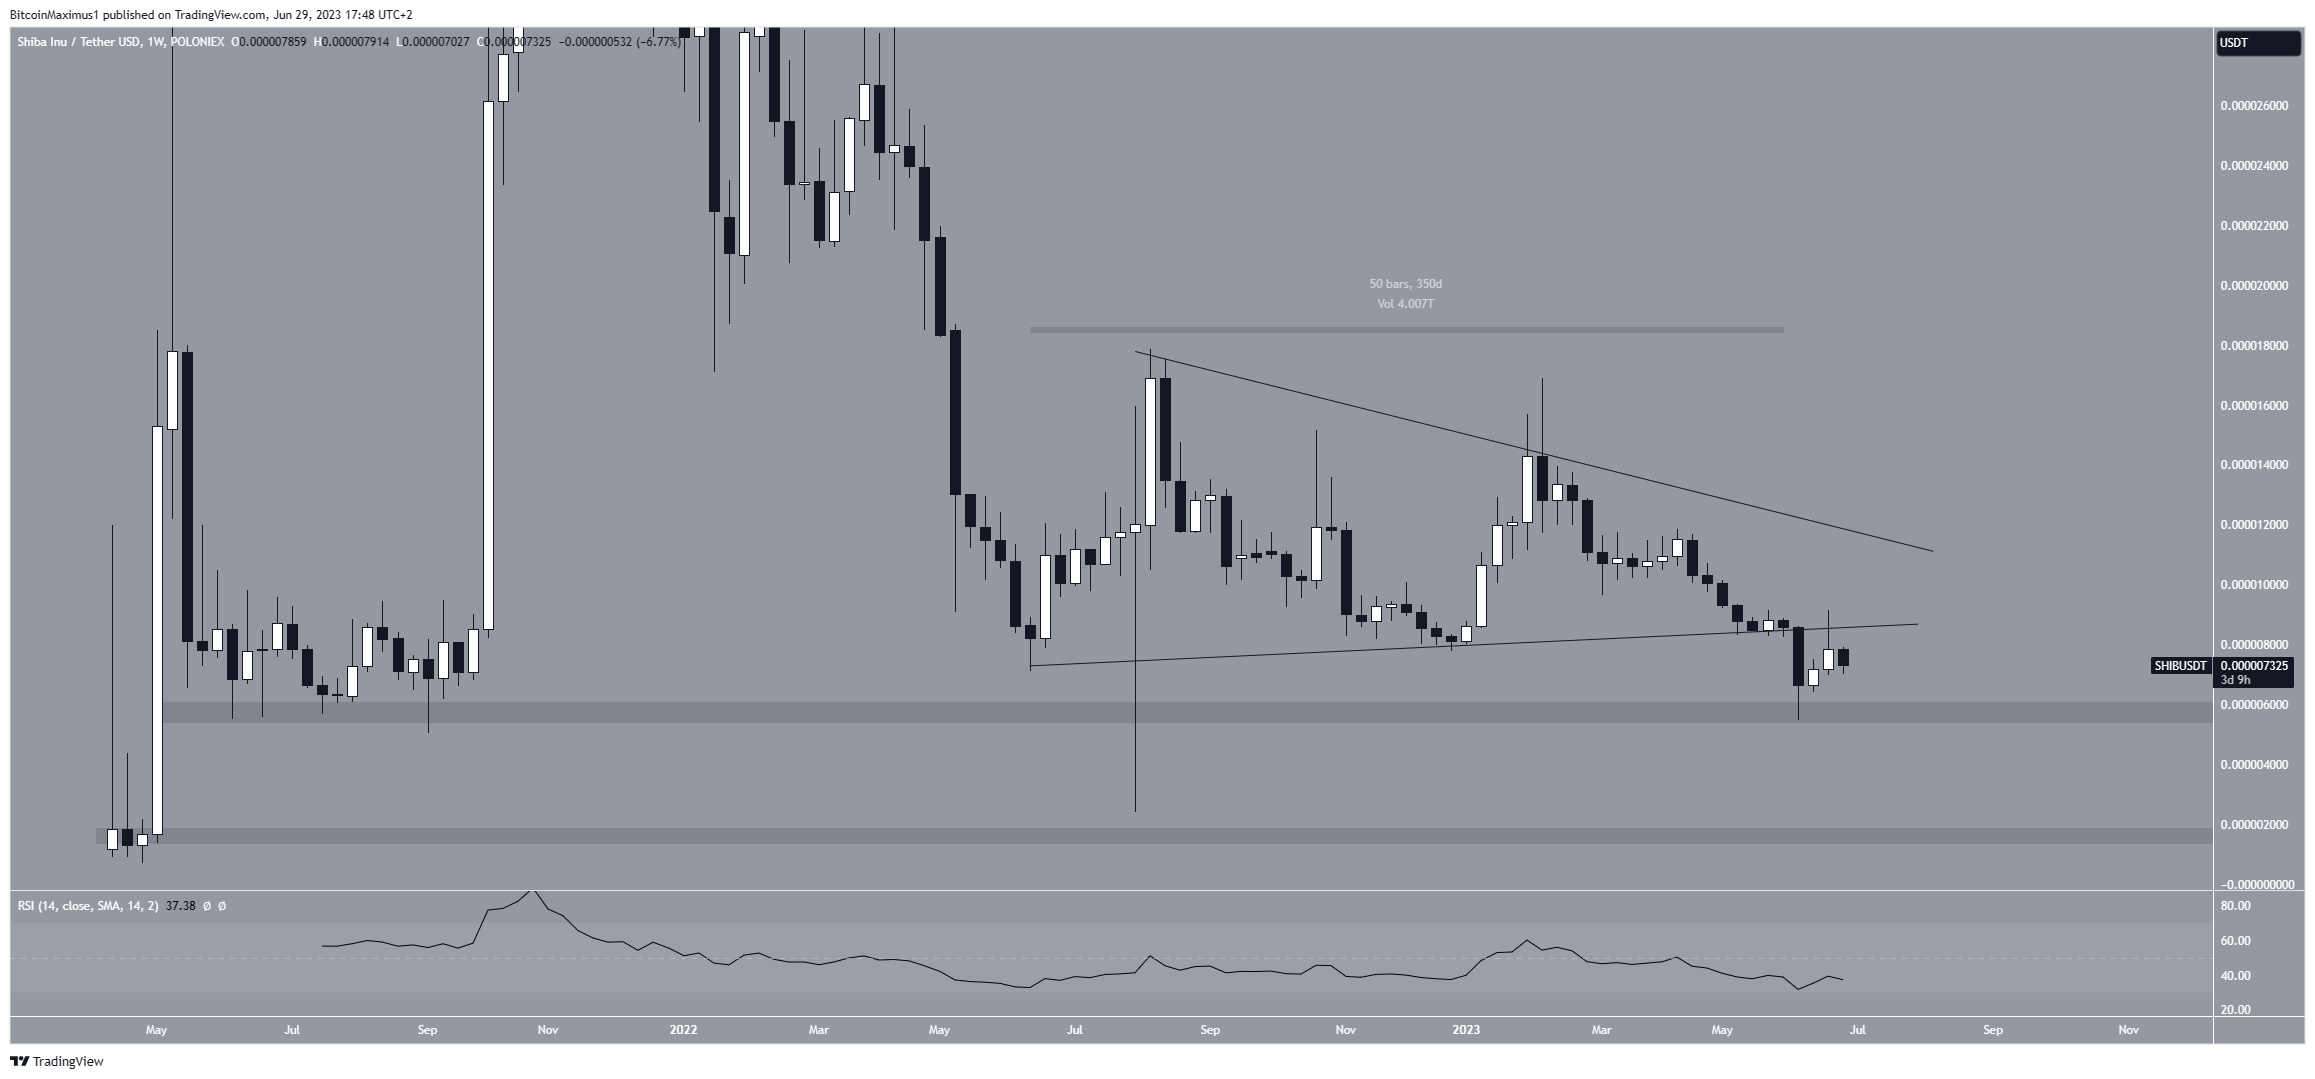
Moreover, the weekly Relative Strength Index (RSI) provides a bearish indication. Traders commonly employ the RSI as a momentum indicator to evaluate whether a market is excessively bought or sold, thus determining whether to accumulate or sell an asset.
Typically, if the RSI reading surpasses 50 and the trend is upward, the bulls maintain an advantage. Conversely, if the reading falls below 50, the opposite holds true. Currently, the RSI reading is below 50 and falling, indicating a bearish trend.
Read More: Best Crypto Sign-Up Bonuses in 2023
SHIB Price Prediction: Will Price Fail to Break Out?
The technical analysis from the daily time frame aligns with the bearish one from the weekly. This is because of the price action and RSI readings.
The SHIB price has decreased under a descending resistance line since the beginning of February. Therefore, the trend is bearish as long as it is doing so. More recently, the line caused a rejection on June 22 (red circle).
During the same time, the daily RSI was rejected by the 50 line. This aligns with the rejection from the line and increases its validity.
If the rejection continues and the SHIB price breaks down from the long-term $0.0000060 area could lead to a sharp fall to $0.0000020.
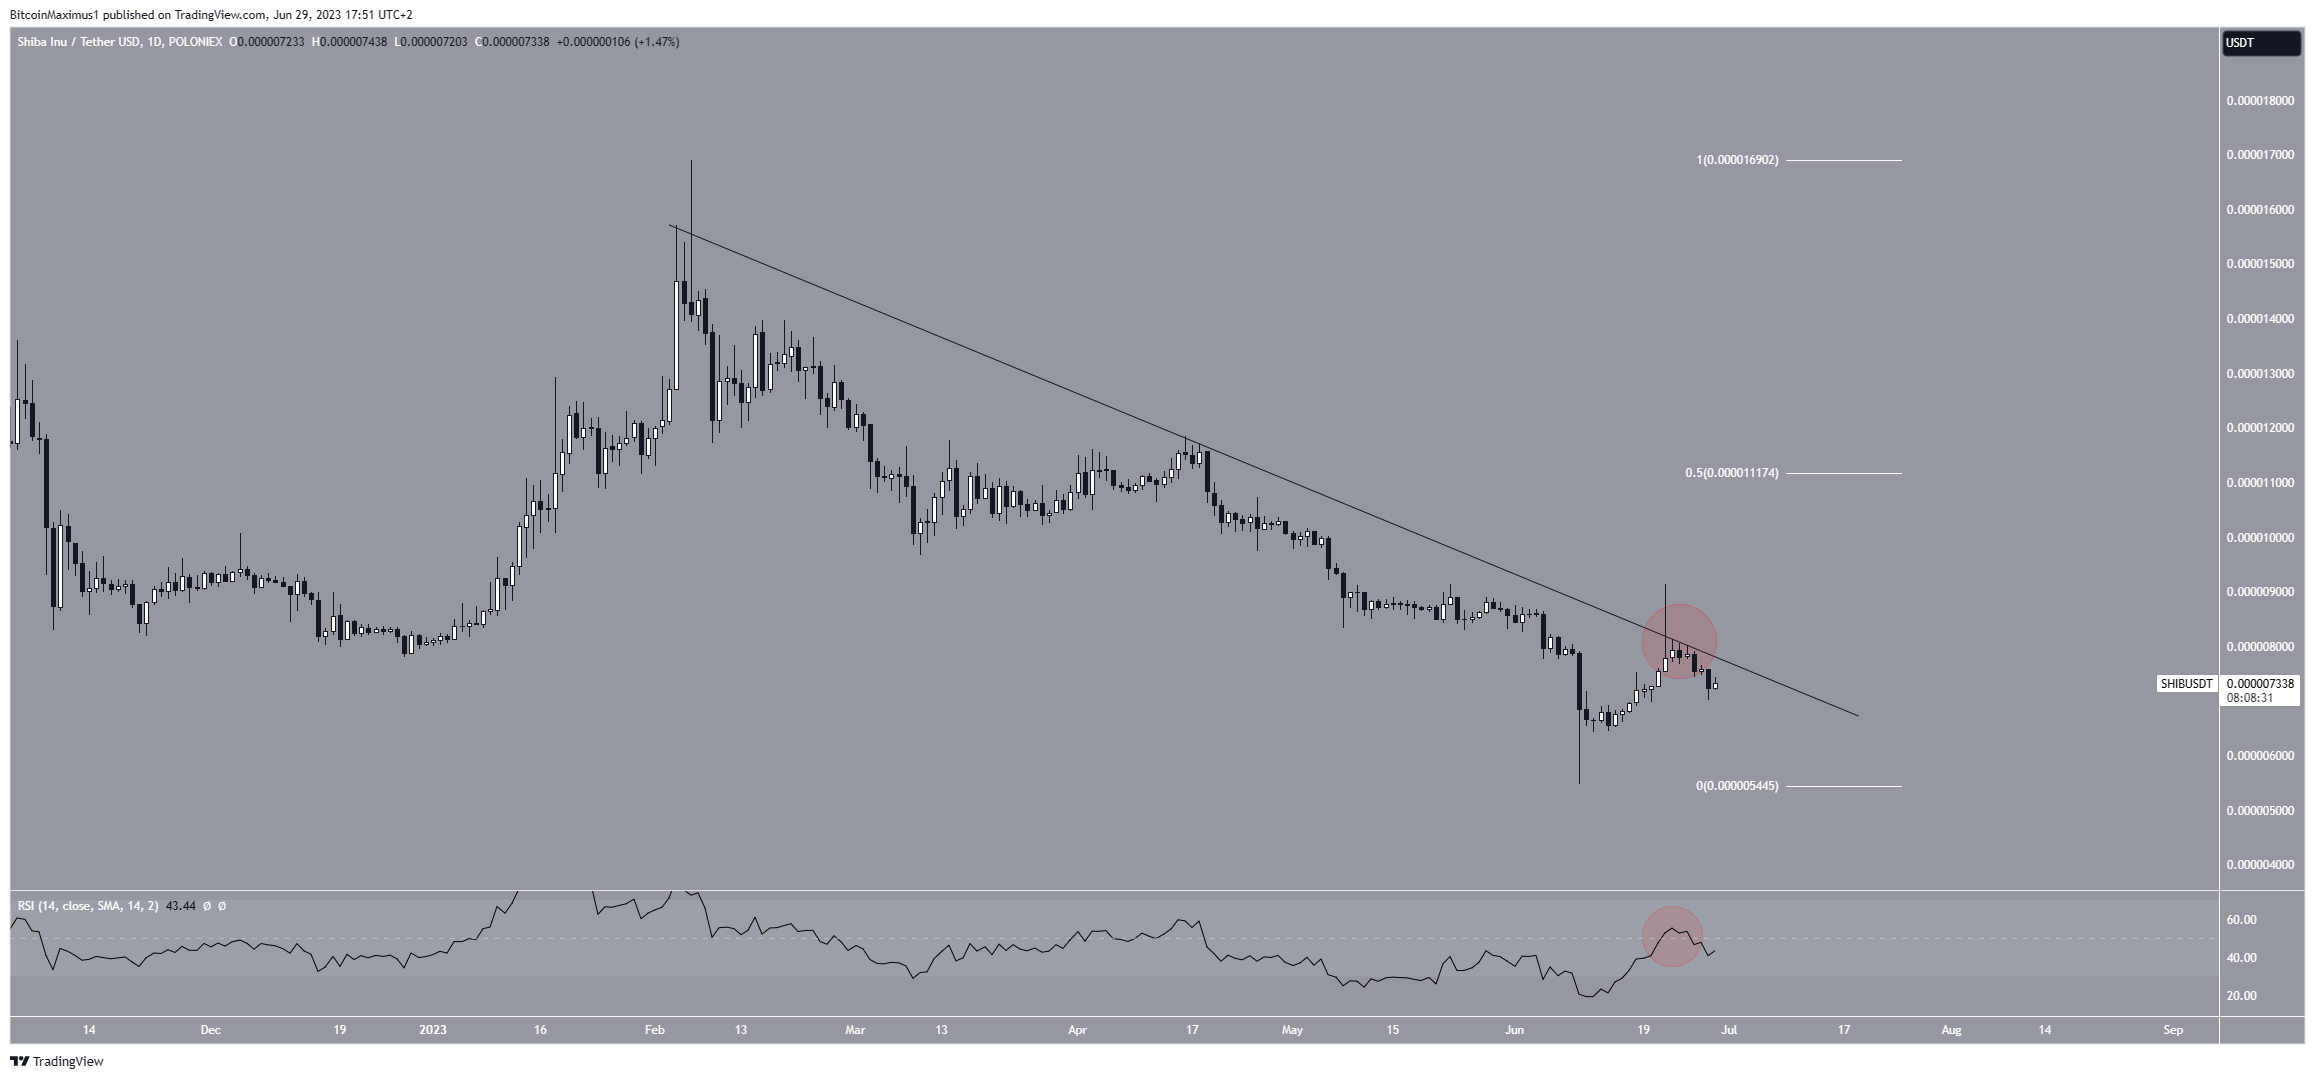
Despite this bearish SHIB price prediction, moving above the resistance line will mean that the trend is still bullish. In that case, the SHIB price can increase to the 0.5 Fib retracement resistance level at $0.0000011.
More From BeInCrypto: 9 Best AI Crypto Trading Bots to Maximize Your Profits
For BeInCrypto’s latest crypto market analysis, click here



