


The Polkadot (DOT) price created a bullish engulfing candlestick last week suggesting that further gains await.
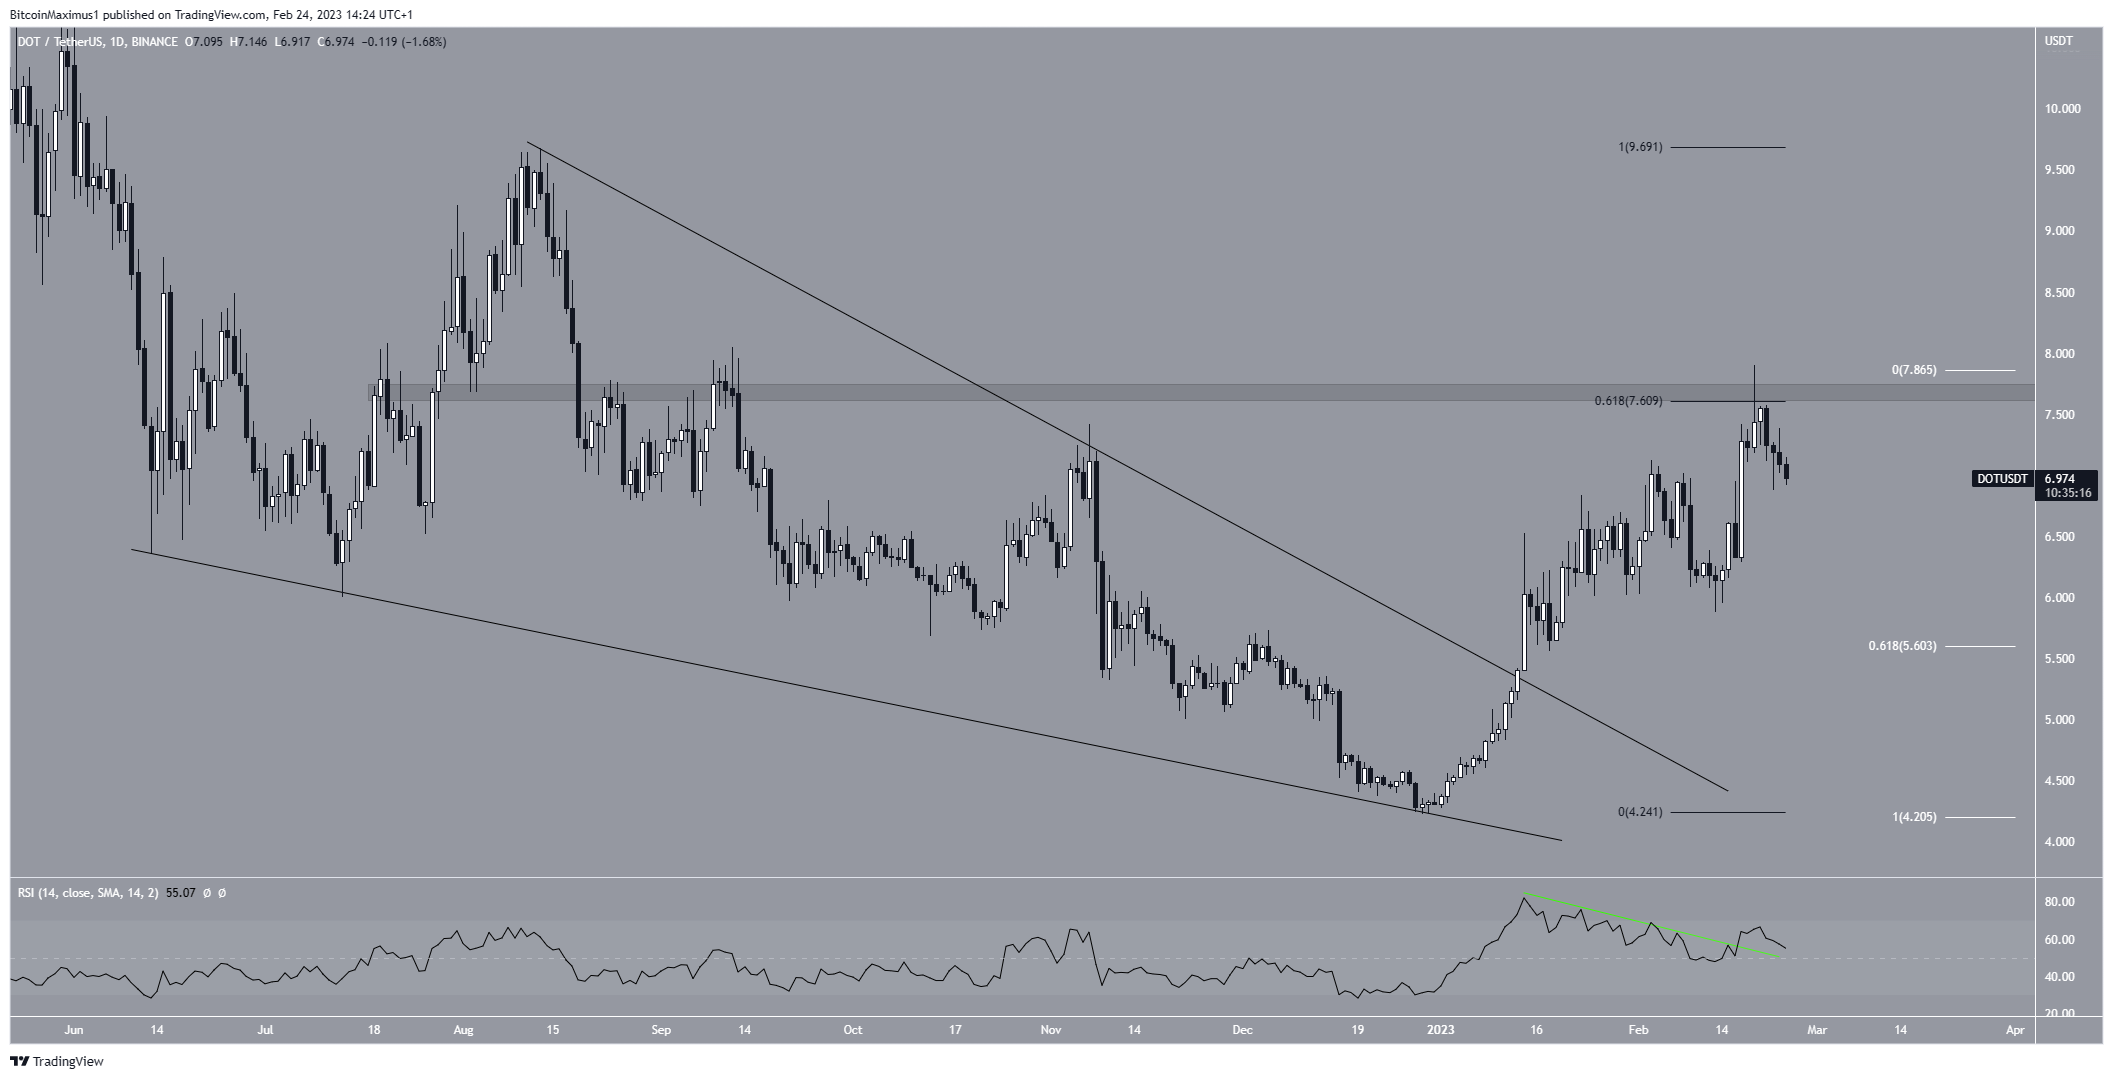
The Polkadot price has increased since breaking out from a descending wedge on Jan. 13. The upward movement led to a high of $7.90 on Feb. 19.
Despite the increase, the price failed to break out above the resistance area at an average price of $7.65, created by the 0.618 Fib retracement support level and a horizontal support area. The DOT token price has to move above this resistance in order for the trend to be considered bullish,
While the daily RSI had previously generated bearish divergence, it has now broken out from its trend line and is above 50. This is considered a sign of a bullish trend.
Therefore, a breakout above $7.65 is the most likely scenario. If this occurs, it could take the DOT price to $9.70.
However, if the decrease as a result of the rejection continues, the DOT price could fall to $5.60.
Long-Term Polkadot (DOT) Price Chart Gives Bullish Outlook
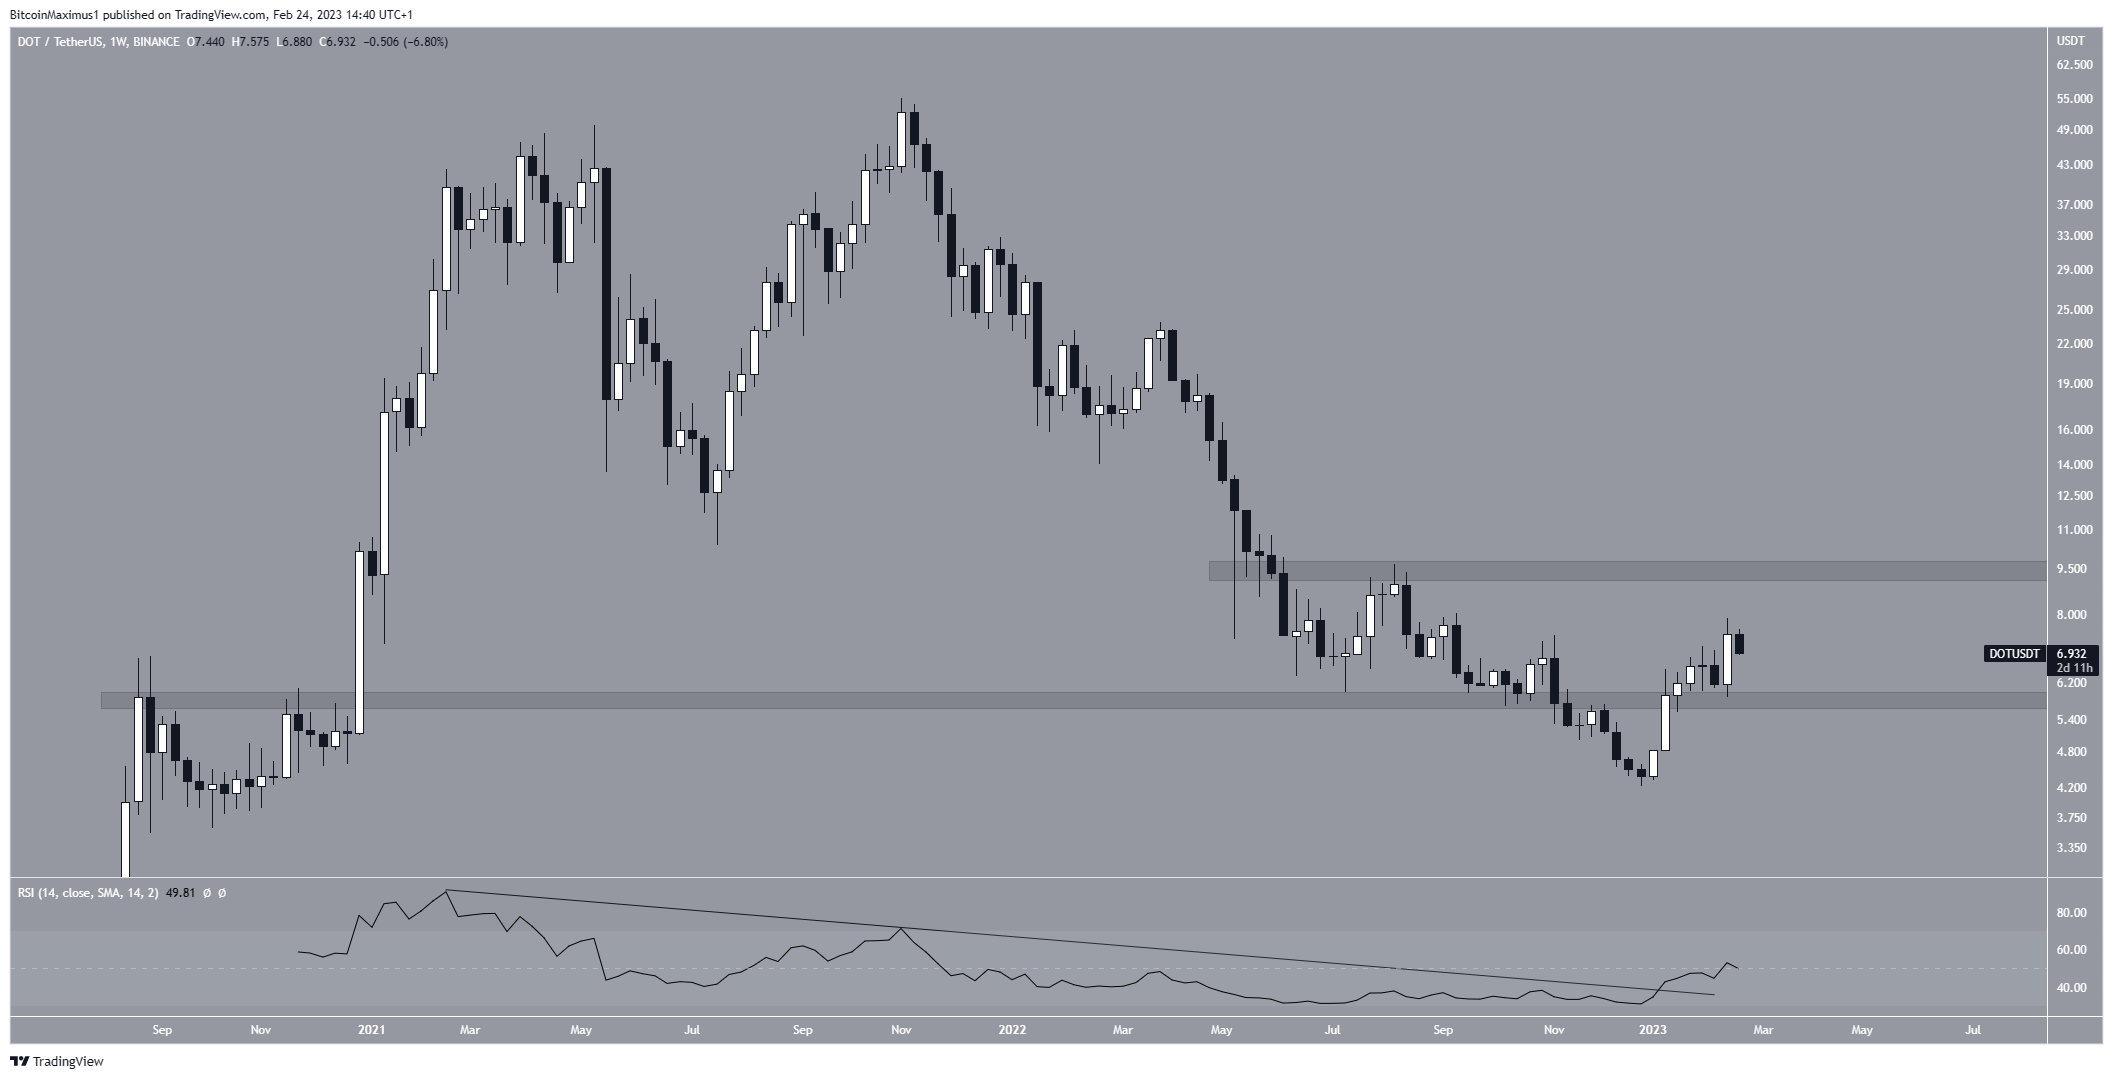
The technical analysis from the weekly time frame supports the continuation of the upward movement.
There are three main reasons for this:
Firstly, the readings from the weekly RSI are bullish. This is visible in the breakout from the descending trend line and the movement above 50.
Second, the price has reclaimed the $5.80 horizontal support area after previously deviating below it (red circle). This is considered a bullish sign that often precedes upward movements.
Finally, the DOT price created a bullish engulfing candlestick last week. So, an increase toward at least $9.65 is expected.
However, if the price closes below $5.90, a fall to $3.90 could follow.
To conclude, the most likely DOT price forecast is an increase toward $9.65. However, a close below $5.90 would invalidate this bullish hypothesis and could lead to a drop to $3.90.
For BeInCrypto’s latest crypto market analysis, click here.
