


The Polygon (MATIC) attempts to break out from a long-term descending resistance trend line that has been in place for more than 770 days.
MATIC also trades under a short-term descending resistance trend line. Will it break out or get rejected?
Polygon Struggles With Long-Term Resistance
The weekly time frame outlook shows that MATIC has increased since June 2022. It created a higher low in October 2023 and accelerated its increase afterward.
Despite the upward movement, MATIC failed to break out from a long-term descending resistance trend line existing for 770 days. Rather, the price made four unsuccessful breakout attempts (red icons). It now trades below the trend line.
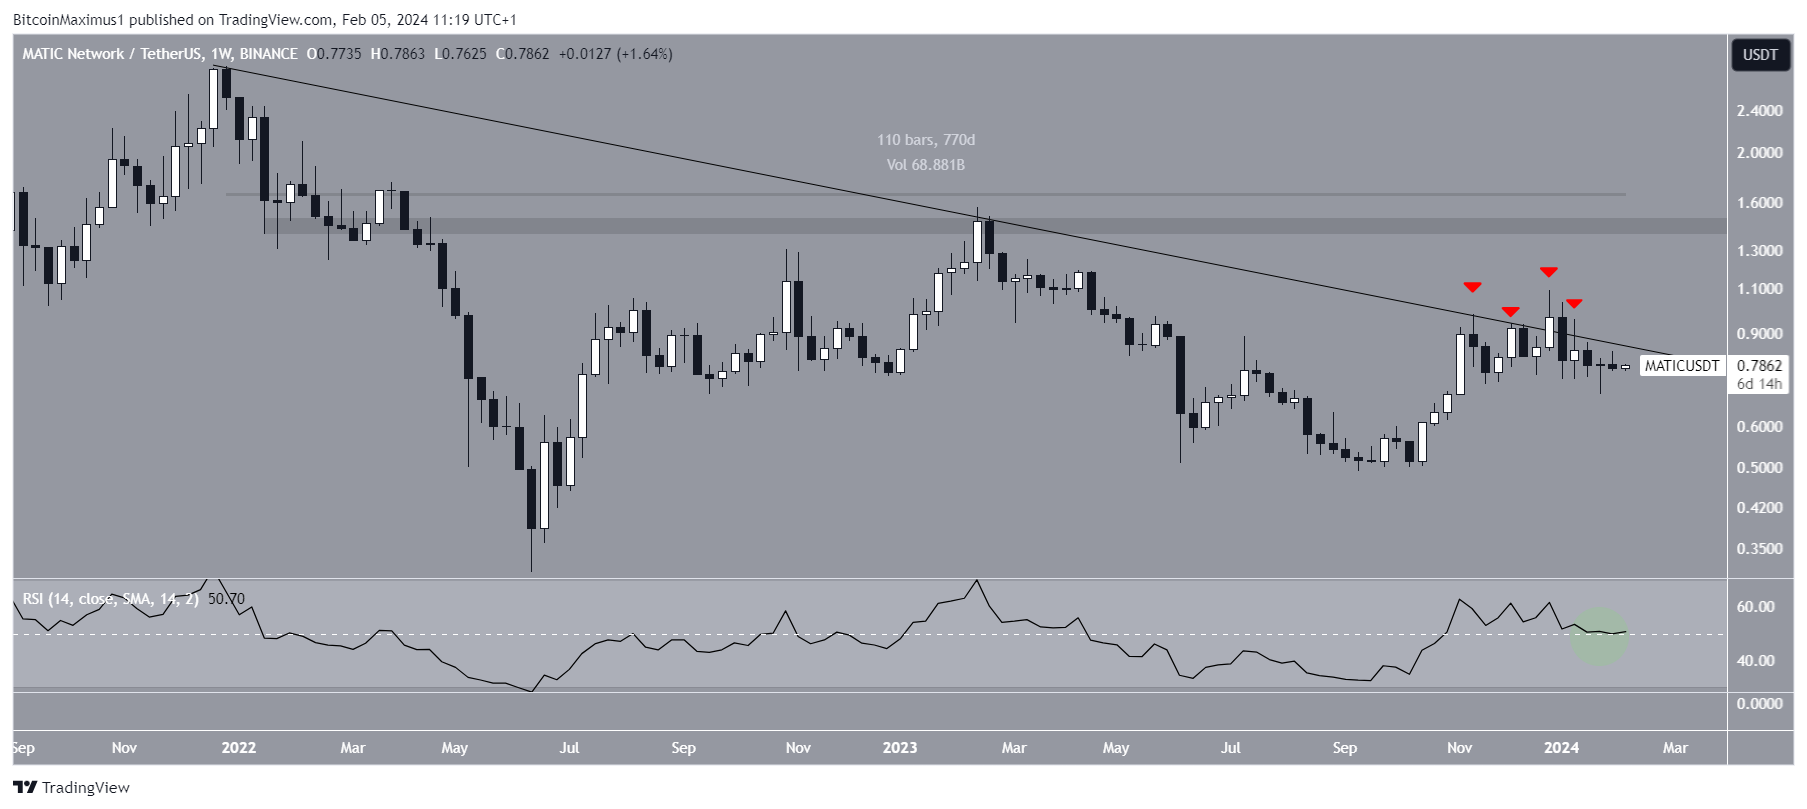
The weekly Relative Strength Index (RSI) gives a mixed reading. When evaluating market conditions, traders use the RSI as a momentum indicator to determine whether a market is overbought or oversold and whether to accumulate or sell an asset.
If the RSI reading is above 50 and the trend is upward, bulls still have an advantage, but if the reading is below 50, the opposite is true. While the weekly RSI is decreasing, it is still above 50 (green circle).
MATIC Price Prediction: Is the Next Movement Up or Down?
The daily time frame outlook does not help confirm the trend’s direction because of mixed readings from the price action and RSI. The price action shows that MATIC has fallen under a descending resistance trend line since the start of the year.
However, MATIC trades above the $0.72 horizontal support area and attempts to break out.
Furthermore, the daily RSI is increasing despite being below 50. So, whether the price breaks out from the resistance trend line or gets rejected can determine the future MATIC trend’s direction.
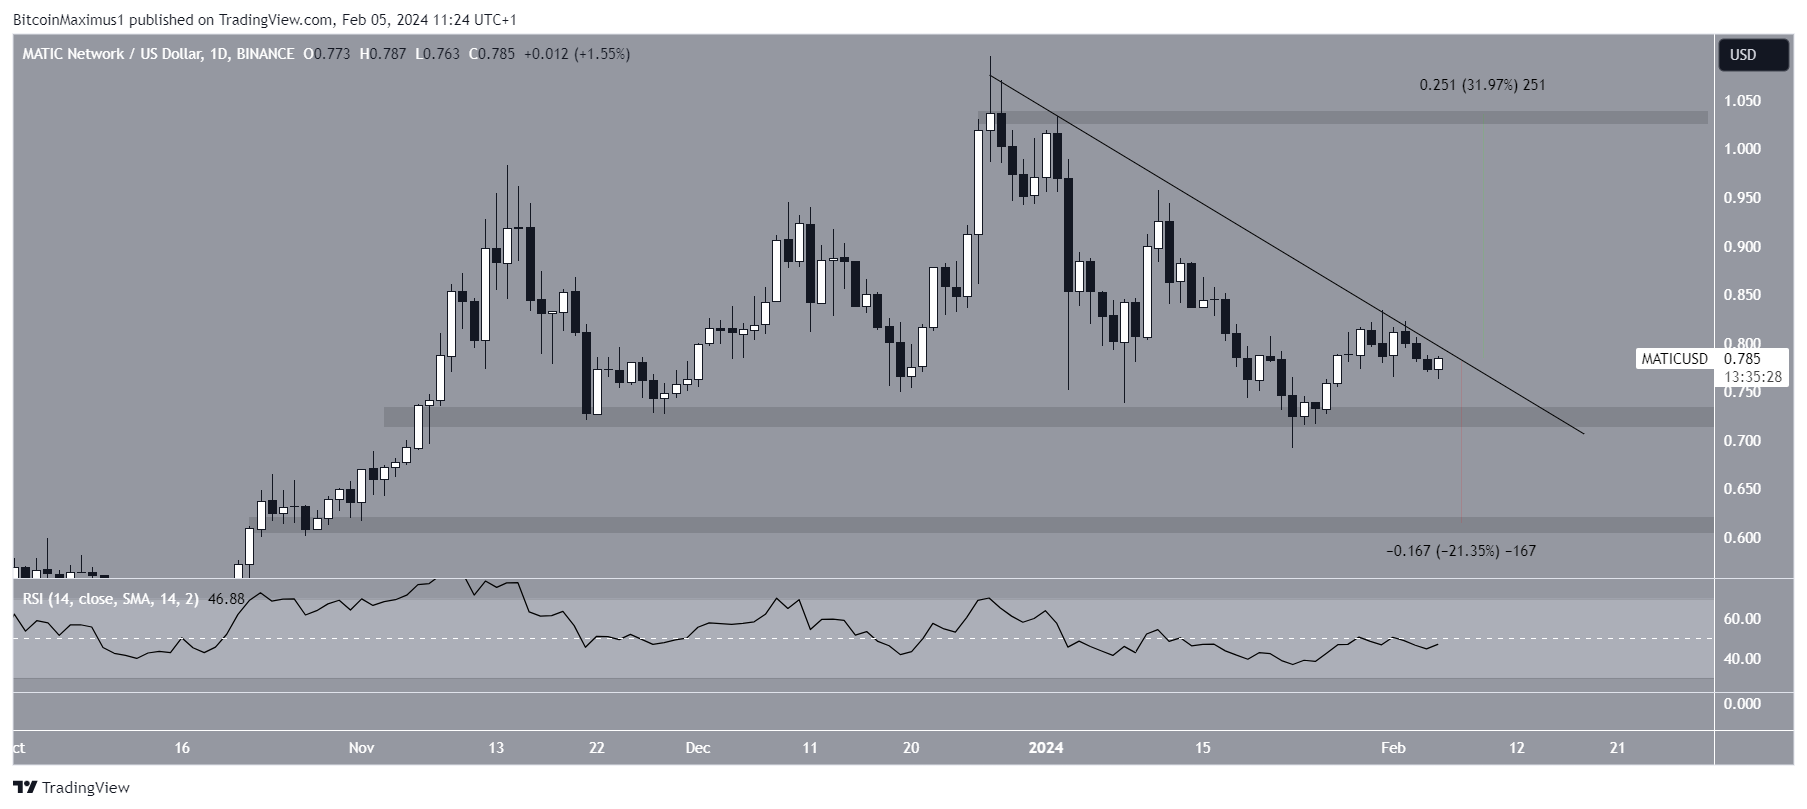
A successful MATIC breakout can trigger a 30% increase to the next resistance at $1.03. Conversely, a rejection from the trend line can cause a 20% drop to the closest support at $0.62.
For BeInCrypto’s latest crypto market analysis, click here.


