


The Polygon (MATIC) price has nearly reached a new yearly low and is trading below the $0.60 horizontal support area.
The weekly and daily timeframe price action and indicator readings are both bearish, suggesting that the price will soon reach a new yearly low.
Polygon Price Drops Close to Yearly Low
The technical analysis for the weekly timeframe shows a bearish outlook for MATIC. The main reason for this is the breakdown from an ascending parallel channel in April (red circle).
This was a crucial development since the channel had previously been in place for nearly a year. The decisive breakdown confirmed that the increase was corrective and the trend was bearish.
After the breakdown, MATIC fell below the $0.80 area. Then, it validated it as resistance in July (red icon), creating a long upper wick. This is considered a sign of selling pressure and further reinforces the possibility that sellers are in control.
The continuing decrease can lead to another 30% drop to the $0.40 horizontal support area.
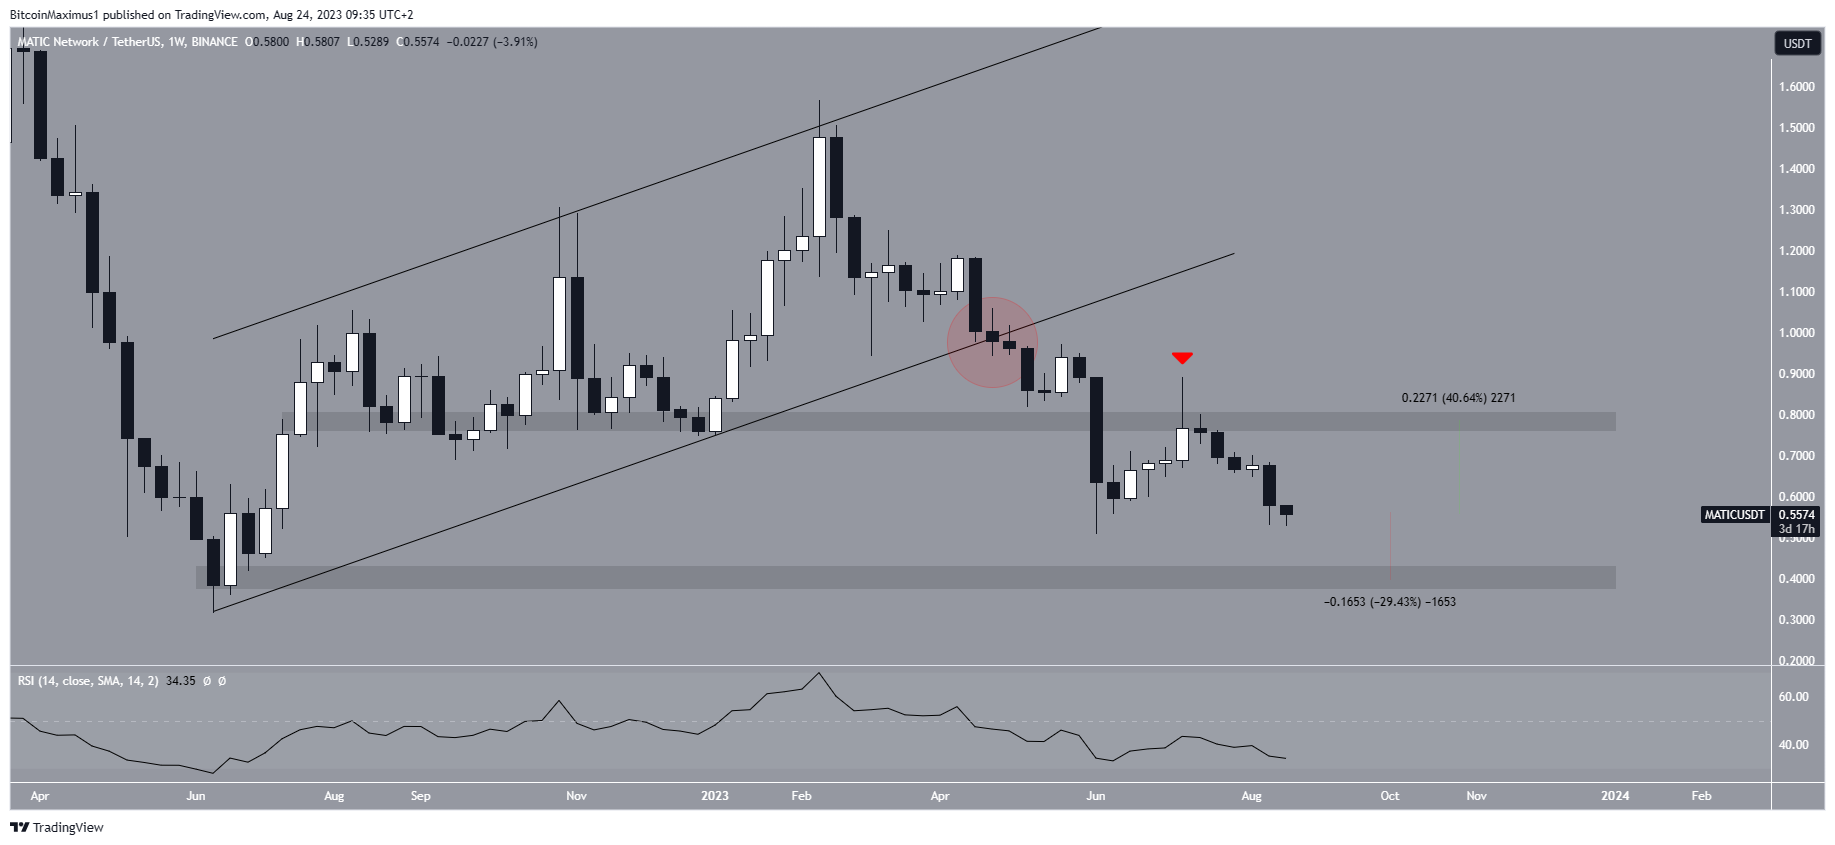
The weekly Relative Strength Index (RSI) is bearish, supporting the continuing downward movement. Traders utilize the RSI as a momentum indicator to assess whether a market is overbought or oversold and to determine whether to accumulate or sell an asset.
If the RSI reading is above 50 and the trend is upward, bulls still have an advantage, but if the reading is below 50, the opposite is true. The RSI is below 50 and decreasing, a sign of a bearish trend.
Read More: Best Crypto Sign-Up Bonuses in 2023
MATIC Price Prediction: Where Will the Bottom Be?
The daily timeframe analysis for MATIC provides a bearish outlook because of the price action and wave count.
The price action is bearish due to a failed breakout from a descending resistance line. After reaching a high of $0.90 (red circle), MATIC decreased considerably and broke down from the $0.60 horizontal support area.
The second reason is the wave count. The most likely count suggests that the MATIC price began a five-wave downward movement (white) in February.
Technical analysts employ the Elliott Wave theory as a means to identify recurring long-term price patterns and investor psychology, which helps them determine the direction of a trend. If correct, the $0.90 high was the top of wave four, and the MATIC price is now in the fifth and final wave.
The most likely level for the wave to end would be at $0.40 and $0.28. They are found by the 1.27 and 1.61 external Fib retracements of wave four, respectively.
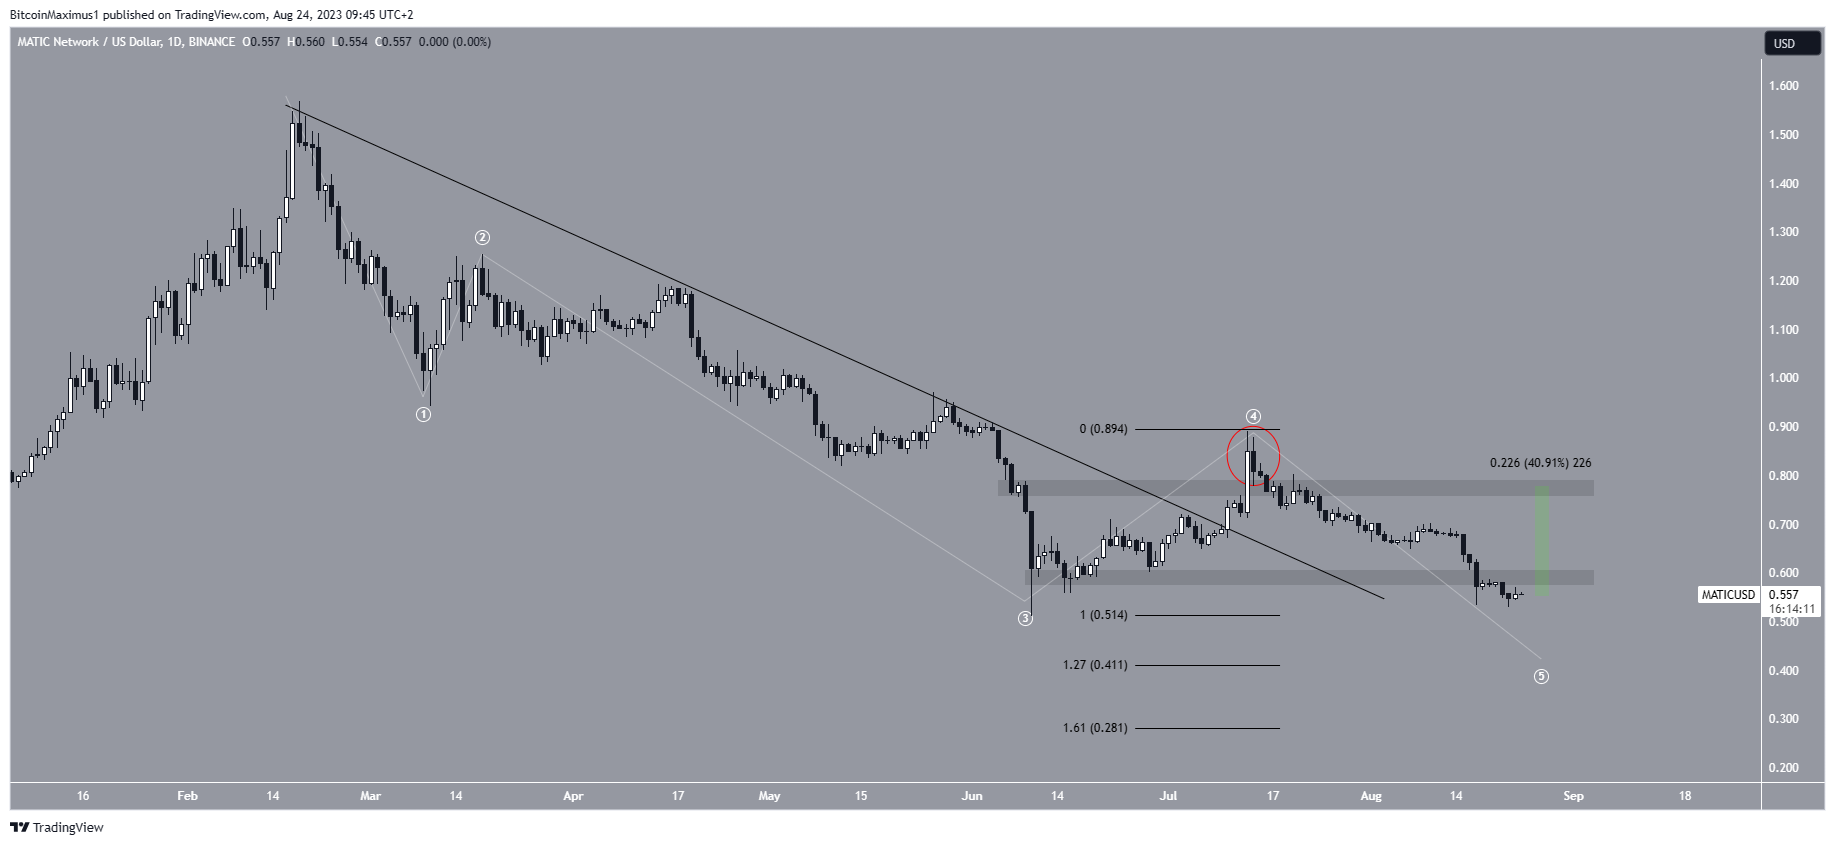
Despite this bearish MATIC price prediction, a strong bounce that would reclaim the $0.60 support area will lead to a 40% increase to the next resistance at $0.80.
Interested in AI Trading? 9 Best AI Crypto Trading Bots to Maximize Your Profits


