


The Polygon (MATIC) price broke out from a 140-day resistance line on July 9. However, it failed to surpass a critical horizontal resistance level.
While the daily time frame readings are bullish, those from the shorter-term six-hour time frame are slightly leaning bearish, creating confusion about the trend’s direction.
Polygon Price Clears 140-Day Resistance
The analysis of MATIC’s daily time frame suggests a positive outlook as the price has broken through a descending resistance line that was in place for 140 days.
This breakout from a long-term level indicates that the previous movement has concluded, paving the way for a trend in the other direction.
Although the breakout has occurred, MATIC has not yet experienced a significant upward movement. Instead, it was rejected by the $0.85 horizontal area (red icon), and it is currently trading near its pre-breakout level.
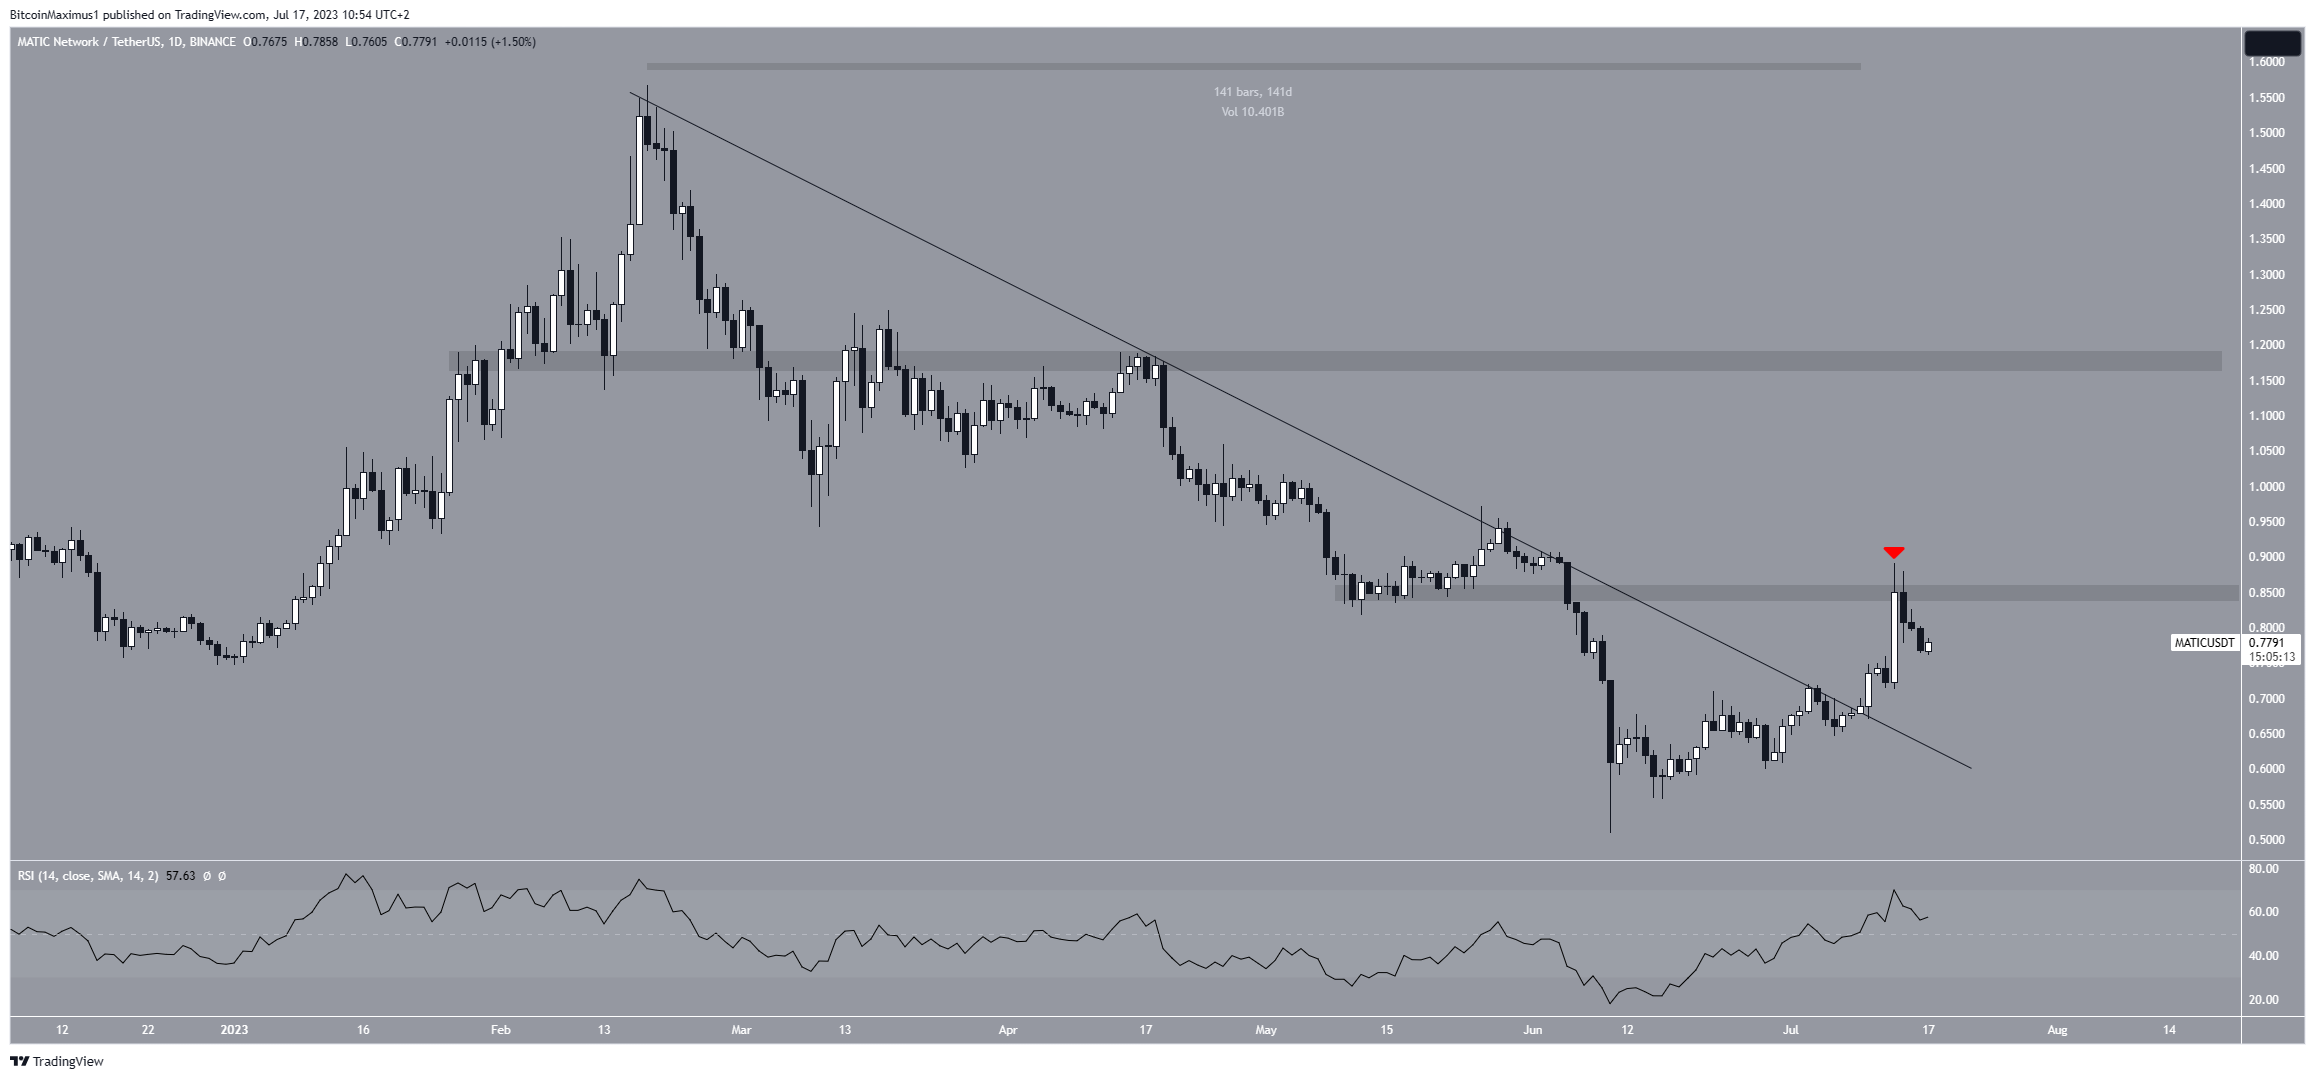
Furthermore, the weekly Relative Strength Index (RSI) also supports a bullish sentiment, confirming the validity of the breakout. The RSI is a momentum indicator that helps traders determine if a market is overbought or oversold, enabling them to decide on accumulating or selling an asset.
Bulls have the advantage when the RSI reading is above 50, and the trend is upward. Conversely, if the reading is below 50, the opposite holds true. The RSI is above 50 in this case, supporting a bullish trend.
Also, it is worth noting that the RSI moved above 50 when the price broke out from the resistance line. Therefore, it supports the possibility that the price of MATIC has initiated a new bullish trend.
MATIC Price Prediction: Pattern Determines Trend’s Direction
Unlike the daily time frame readings, the six-hour ones cast some doubt on the legitimacy of the breakout. The main reason for this relates to the price action.
The MATIC price has traded inside an ascending parallel channel since its June 10 bounce. Movements inside a channel are usually considered corrective.
So, when the MATIC price broke out from the channel on July 13, it seemed that the price had begun a new bullish trend reversal. However, the price has fallen back inside the channel since. So, it is not clear if the movement is corrective or impulsive.
Moreover, the six-hour RSI is right at the 50 line, failing to confirm the trend’s direction.
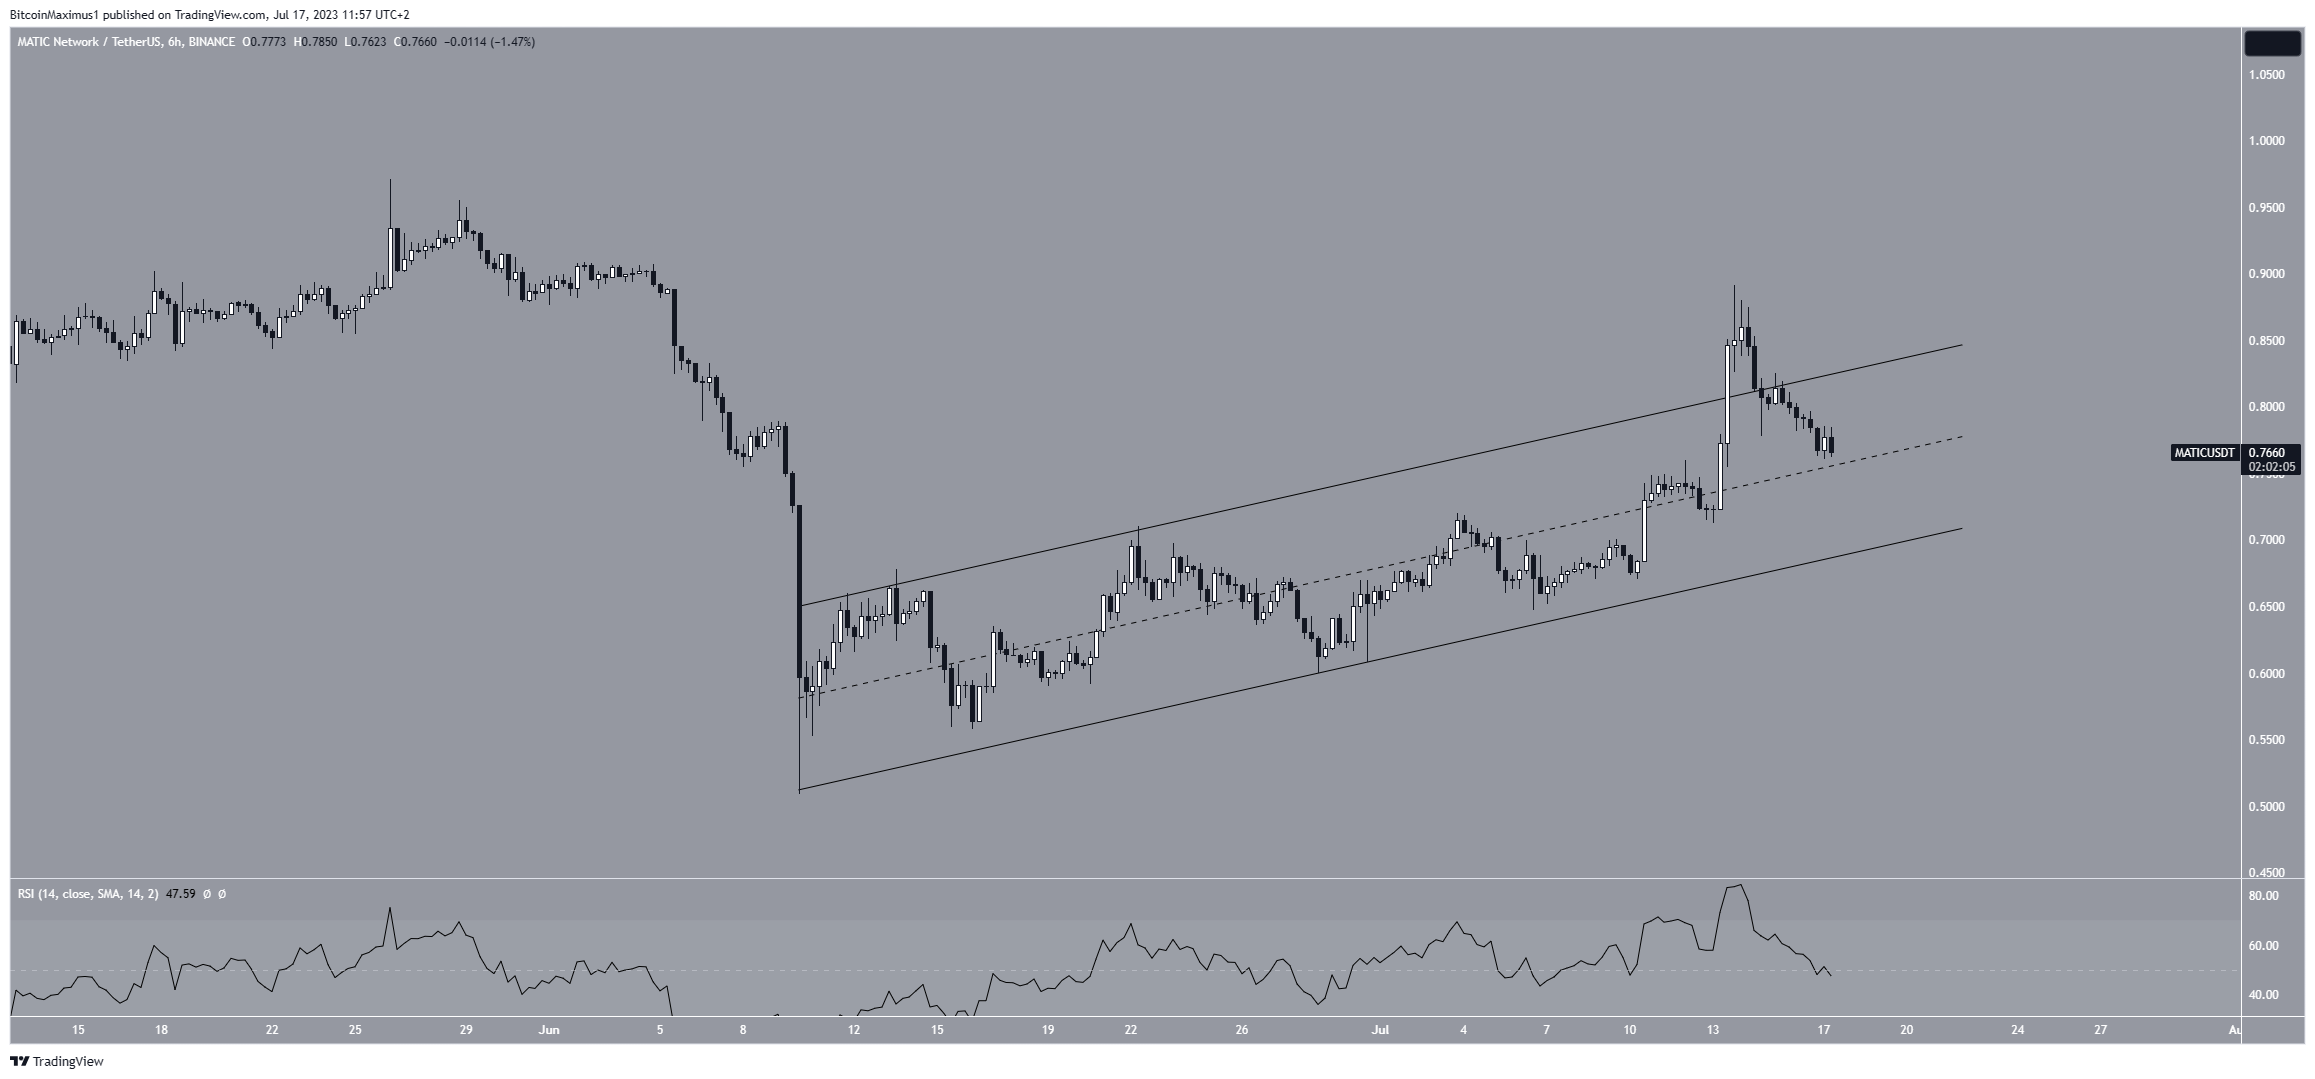
So, whether the MATIC price breaks out or down from the channel will likely confirm the future trend’s direction. In case of a breakout, the price will likely exceed the previously outlined resistance of $0.85.
However, a drop to the June low of $0.50 will be expected if the MATIC price breaks down from the channel.
Read More: Best Crypto Sign-Up Bonuses in 2023


