


The Polygon (MATIC) price is attempting to move above a long-term descending resistance line.
Whether the price breaks out or gets rejected can have a significant impact on the future trend’s direction.
Polygon Price Attempts Breakout From Resistance
In the daily timeframe analysis of MATIC, we observe that its price has fallen below a descending resistance line since February 28, when it reached its highest point of the year at $1.57. During this decline, MATIC broke down from the $0.60 support level and confirmed it as resistance on August 29 (red icon).
This validation also marked the last touch on the descending resistance line, suggesting a bearish trend. However, the cryptocurrency has regained its footing and is currently making a breakout attempt. If MATIC’s price manages to break above this line, there is potential for a 60% increase, reaching the $0.85 resistance level. Conversely, if it faces rejection again, a 35% drop to the nearest support level at $0.35 could be anticipated.
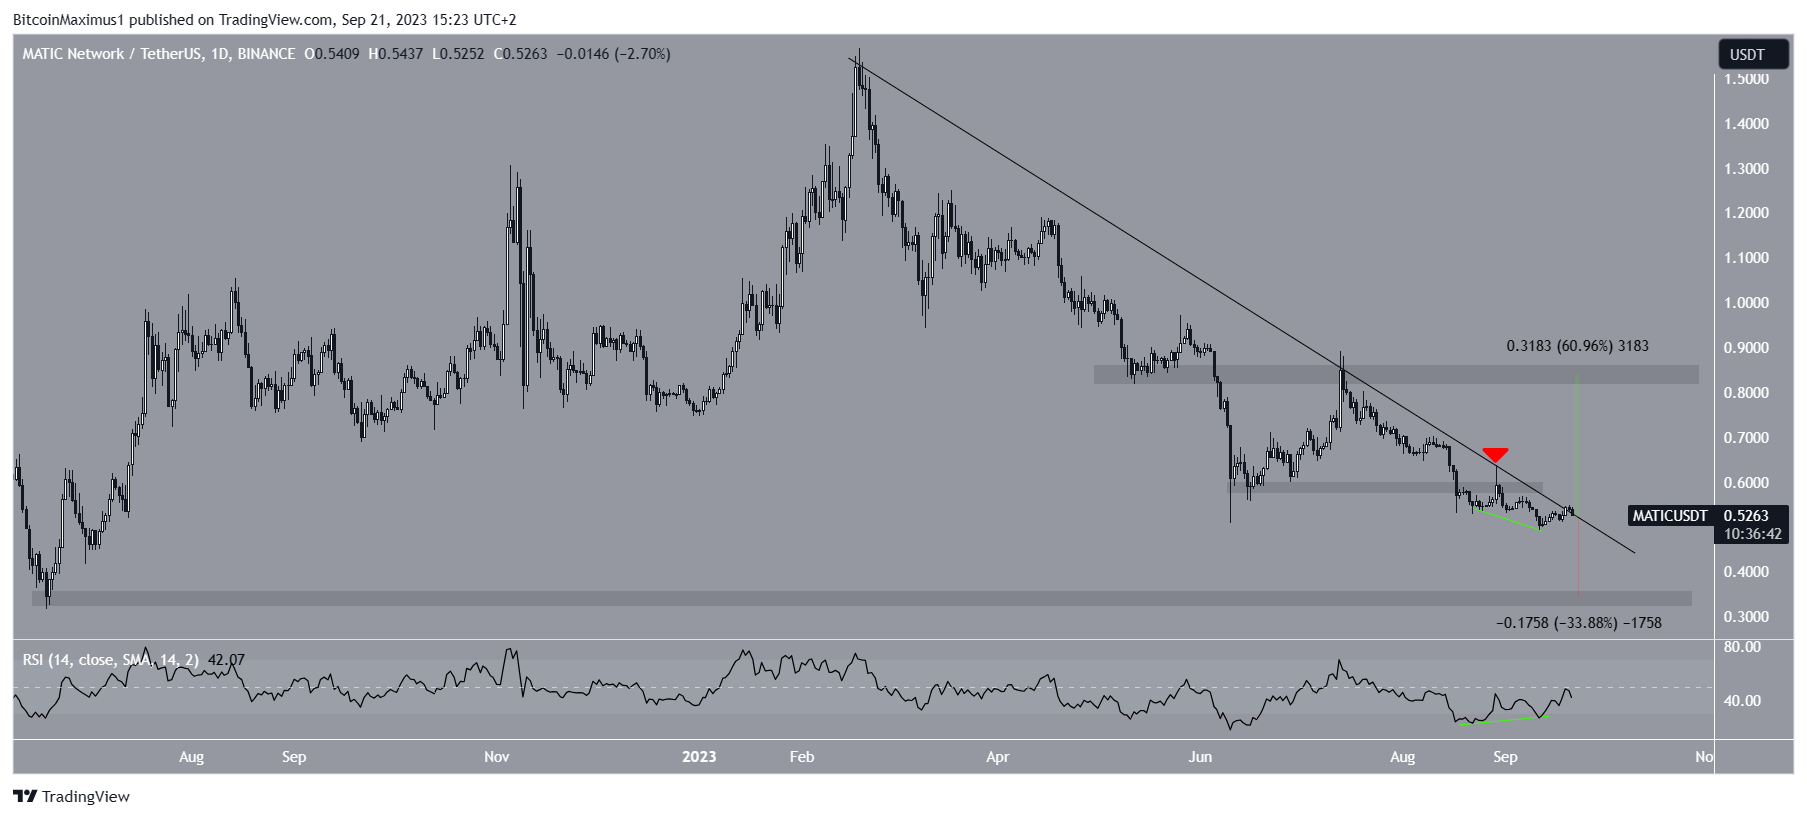
Despite the prevailing bearish sentiment in price action, the daily Relative Strength Index (RSI) is signaling a potential shift towards a bullish trend. Traders use the RSI to gauge momentum and determine if a market is overbought or oversold, guiding their decisions on buying or selling assets. An RSI reading above 50 in an uptrend is favorable for bulls, while a reading below 50 suggests the opposite.
Although the RSI is currently below 50, it is on the rise. More importantly, it has exhibited significant bullish divergence (green line).
This divergence occurs when an increase in momentum accompanies a decrease in price. Typically, it precedes bullish trend reversals, and in MATIC’s case, it could lead to a breakout from the long-term descending resistance line.
Read More: Best Crypto Sign-Up Bonuses in 2023
MATIC Price Prediction: Will Short-Term Breakout Catalyze Increase?
A look at the shorter-term six-hour timeframe gives conflicting readings.
On the bullish side, the price broke out from a descending wedge which had been in place since the beginning of the month. Such breakouts are signs of a bullish trend and usually lead to significant increases.
On the bearish side the price fell below the $0.53 horizontal area instead of validating it as support.
The $0.53 area is crucial since it has intermittently acted as both support and resistance since August 21. Therefore, whether the price reclaims it or fall below it will be key in determining the future trend.
The six-hour RSI is right at 50, a sign of an undetermined trend for the cryptocurrency.
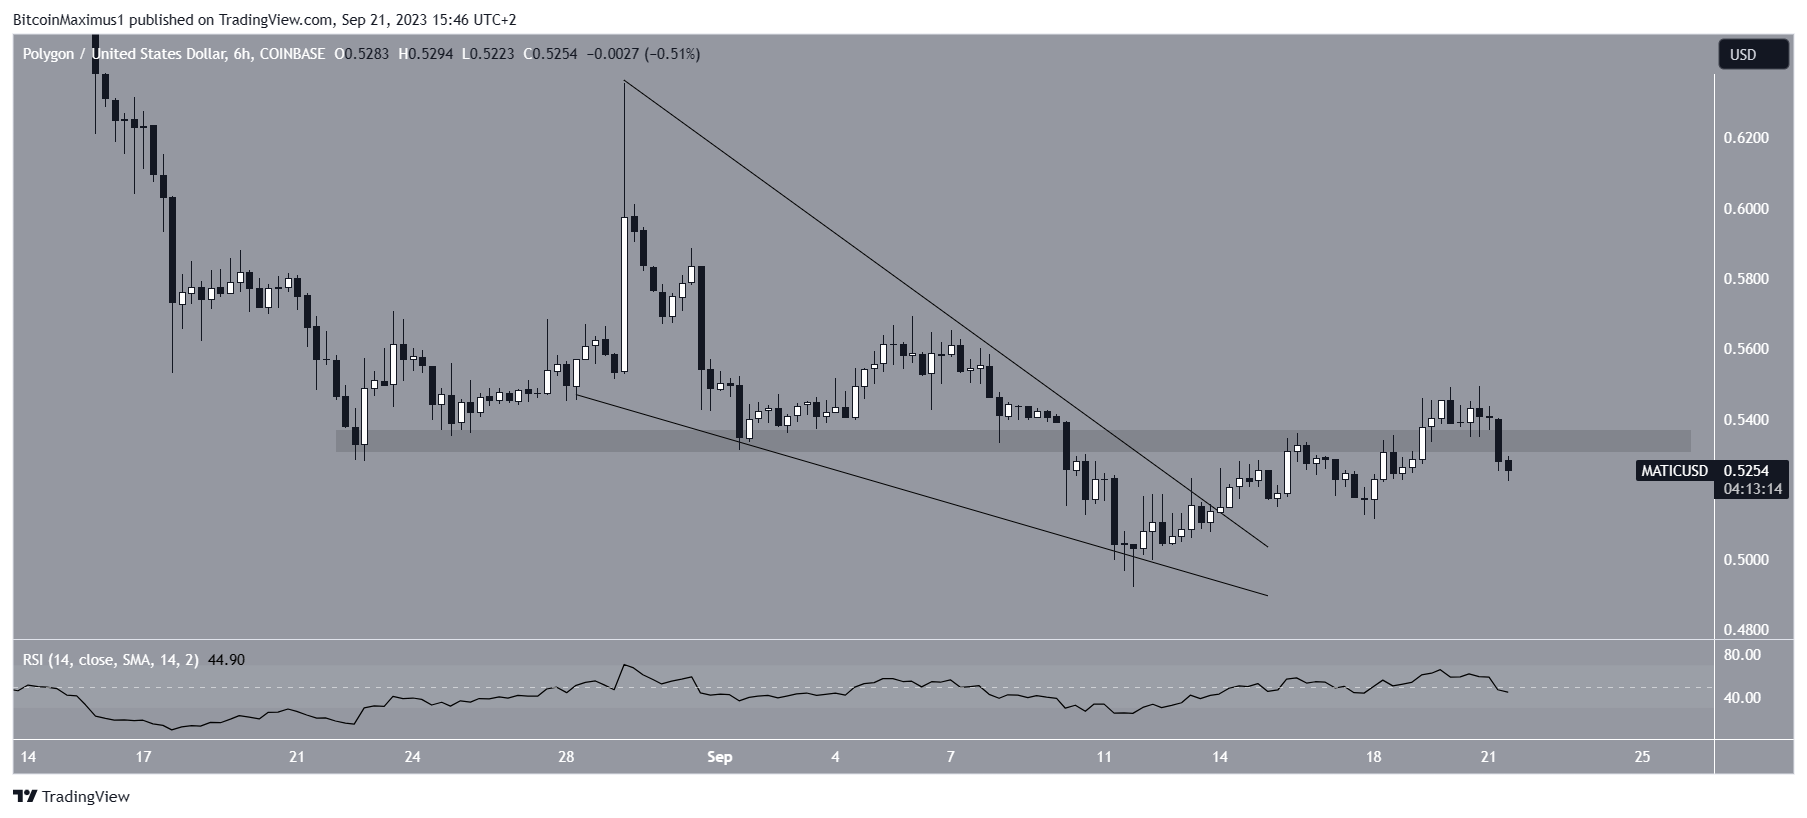
Therefore, the future MATIC price prediction will be determined by whether Polygon reclaims the $0.53 area or falls below it. Since reclaiming the area would also cause a breakout from the long-term resistance line, this could cause a 60% increase. However, a 35% drop is expected in case of a rejection.
Interested in AI Trading? 9 Best AI Crypto Trading Bots to Maximize Your Profits


