


The ImmutableX (IMX) price increased considerably today, reaching a high of $0.77. At one point, the upward movement was 40% relative to the price at the beginning of the day.
However, the increase could not be sustained, and IMX is at risk of invalidating a breakout from a descending resistance line.
Will IMX Price Break Out From Resistance?
The IMX price has fallen inside a descending wedge since reaching a yearly high of $1.59 on March 18. The descending wedge is considered a bullish pattern, meaning that an eventual breakout from it is the most likely future price scenario.
The decrease ended on September 12, when the cryptocurrency bounced (green icon), validating the $0.50 horizontal area as support. The bounce was especially interesting since the price did not fall to the wedge’s support line. This is considered a sign of strength.
Read More: Best Upcoming Airdrops in 2023
The price has increased since the breakout and accelerated its increase on September 21. While IMX reached a high of $0.77, it failed to sustain its increase. Rather, it created a long upper wick and is now at risk of falling below the wedge’s resistance line, hence invalidating the breakout.
If this were to occur, IMX would likely return to the $0.50 support area, a drop of 25% measuring from the current price. On the other hand, if the breakout gets confirmed, IMX can increase to the $1 resistance area.
The 0.5 Fib retracement resistance level creates the resistance but is also a horizontal resistance area. This would be an increase of 55%.
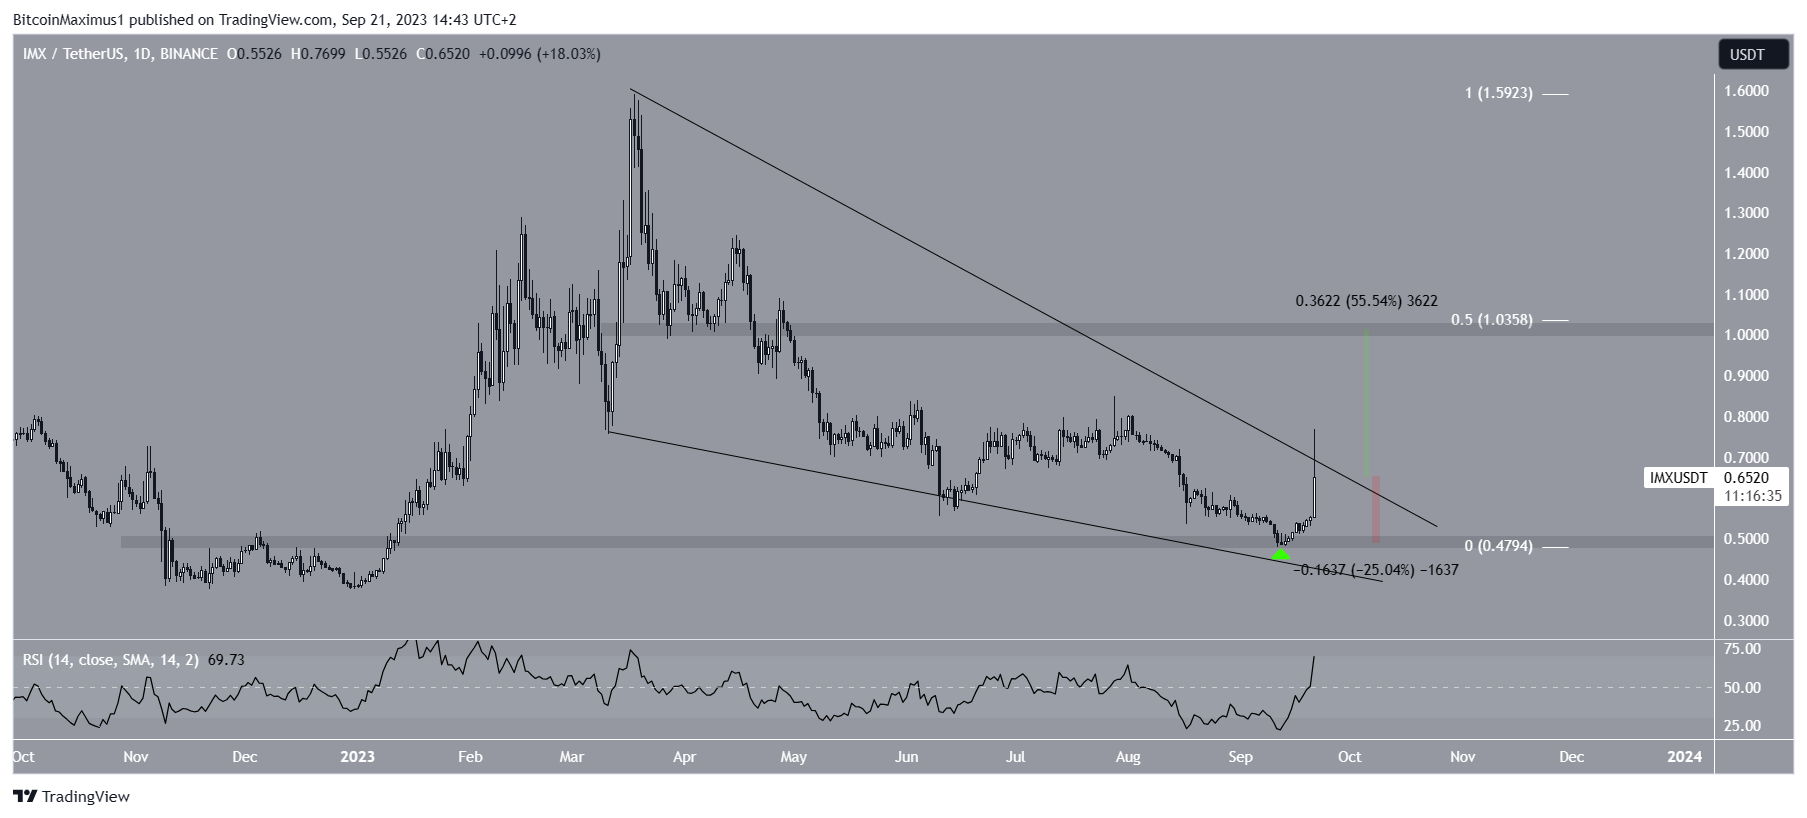
The daily RSI is bullish. When evaluating market conditions, traders use the RSI as a momentum indicator to determine if a market is overbought or oversold and to decide whether to accumulate or sell an asset.
If the RSI reading is above 50 and the trend is upward, bulls still have an advantage, but if the reading is below 50, the opposite is true. The indicator is increasing and is above 50, both considered signs of a bullish trend.
IMX Price Rejection Leads to Descent
Similarly to the daily timeframe, the six-hour one does not confirm the validity of the breakout, hence failing to give a decisive IMX price prediction.
On the bullish side, IMX has broken out from a short-term descending resistance line. This is a positive sign. However, the price was rejected by the 0.618 Fib retracement resistance level at $0.71 (red circle). The 0.618 Fib level often acts as the top during upward movements. Therefore, IMX has to reclaim it to confirm that the trend is bullish.
Furthermore, the RSI is increasing and above 50, but it is also overbought territory. This could be a sign that the local top is in.
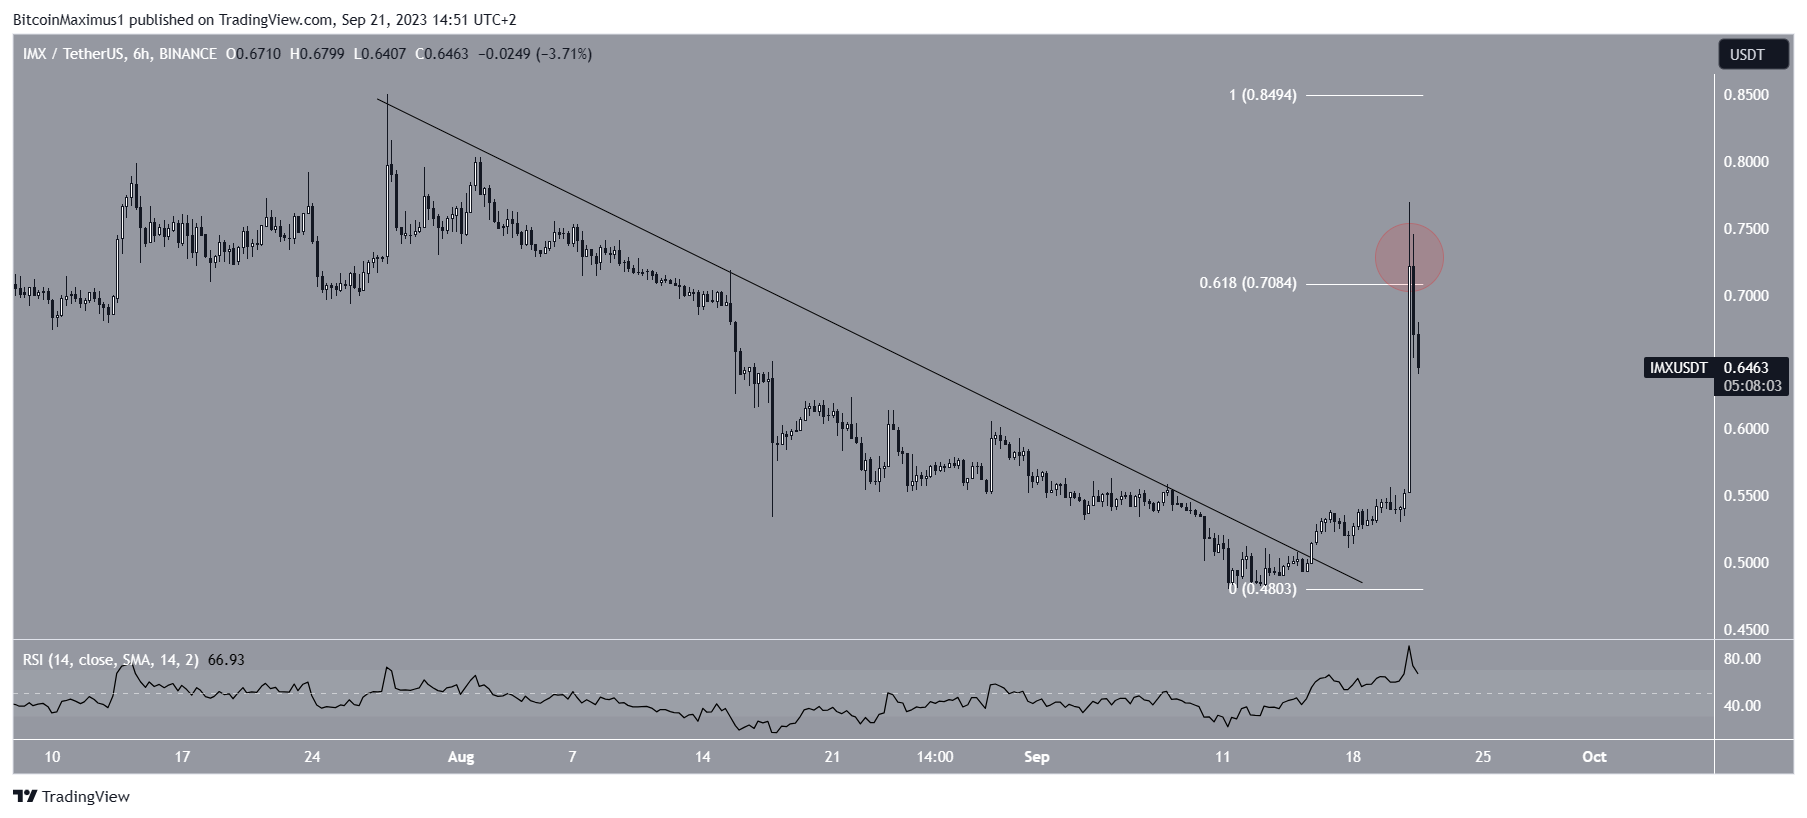
To conclude, the IMX price prediction will determine whether the price breaks out from the long-term wedge and the $0.70 resistance line or gets rejected instead. A breakout can lead to a 55% increase, while a rejection will likely lead to a 25% fall.
Read More: Best Crypto Sign-Up Bonuses in 2023


