

Polygon (MATIC) Price Uncertainty Could See it Struggle Against Bitcoin (BTC)
The Polygon (MATIC) price broke out from a short-term resistance line but has failed to initiate a significant rally.
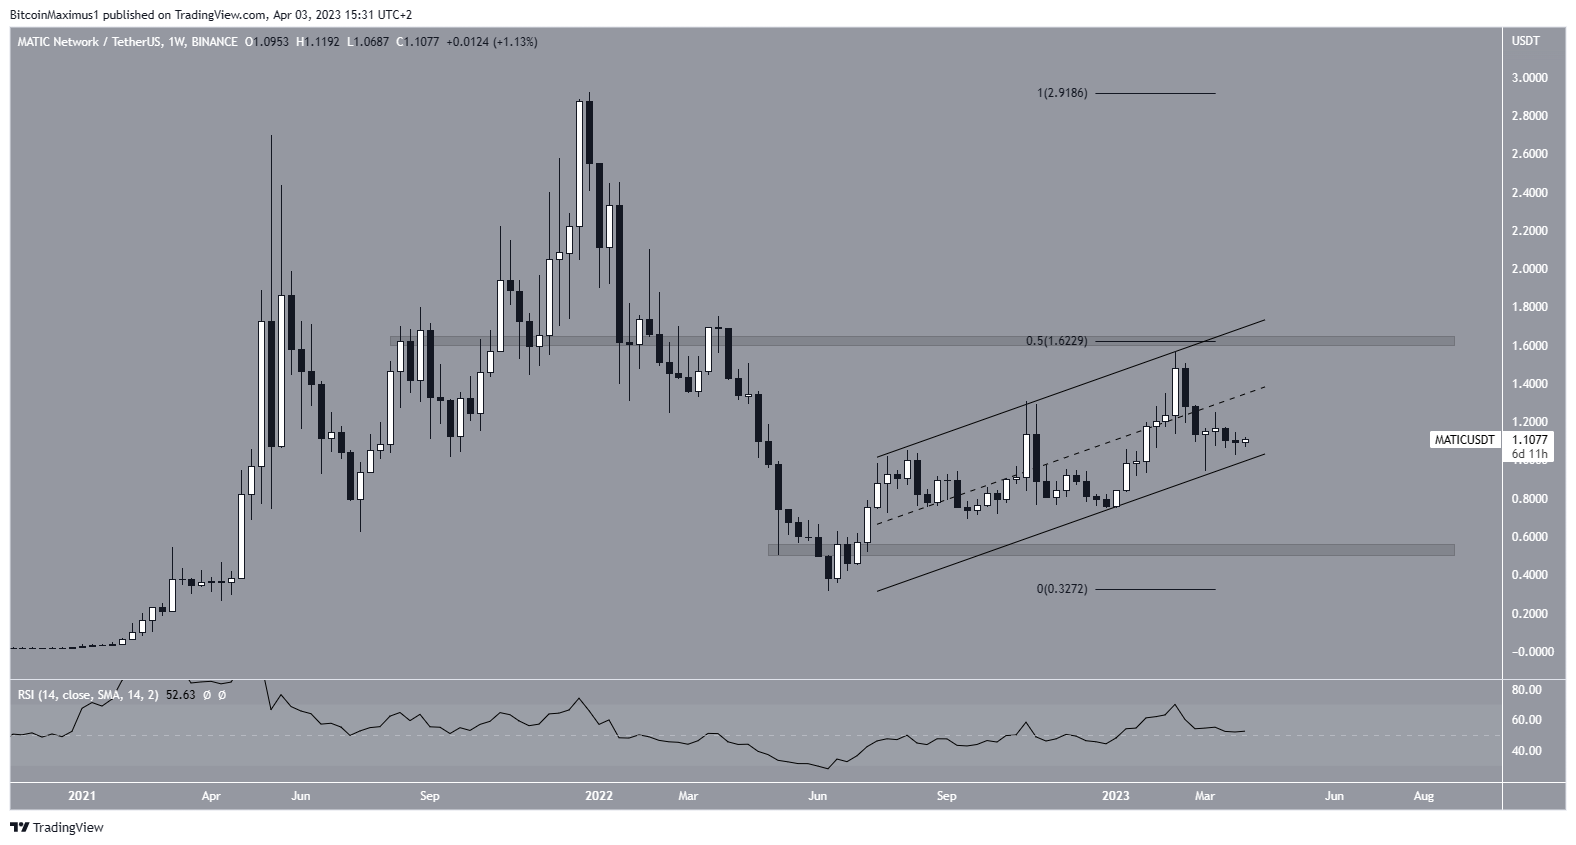
MATIC is the native coin of the Polygon network, a layer-2 scaling solution for the Ethereum blockchain. The weekly time frame shows that the MATIC price has increased inside an ascending parallel channel since June 2022. Ascending parallel channels usually contain corrective patterns.
Moreover, the 2023 high of $1.57 was made very close to the confluence of resistance levels at $1.62, created by the following:
Is Polygon (MATIC) Breakout Start of a Bigger Rally?
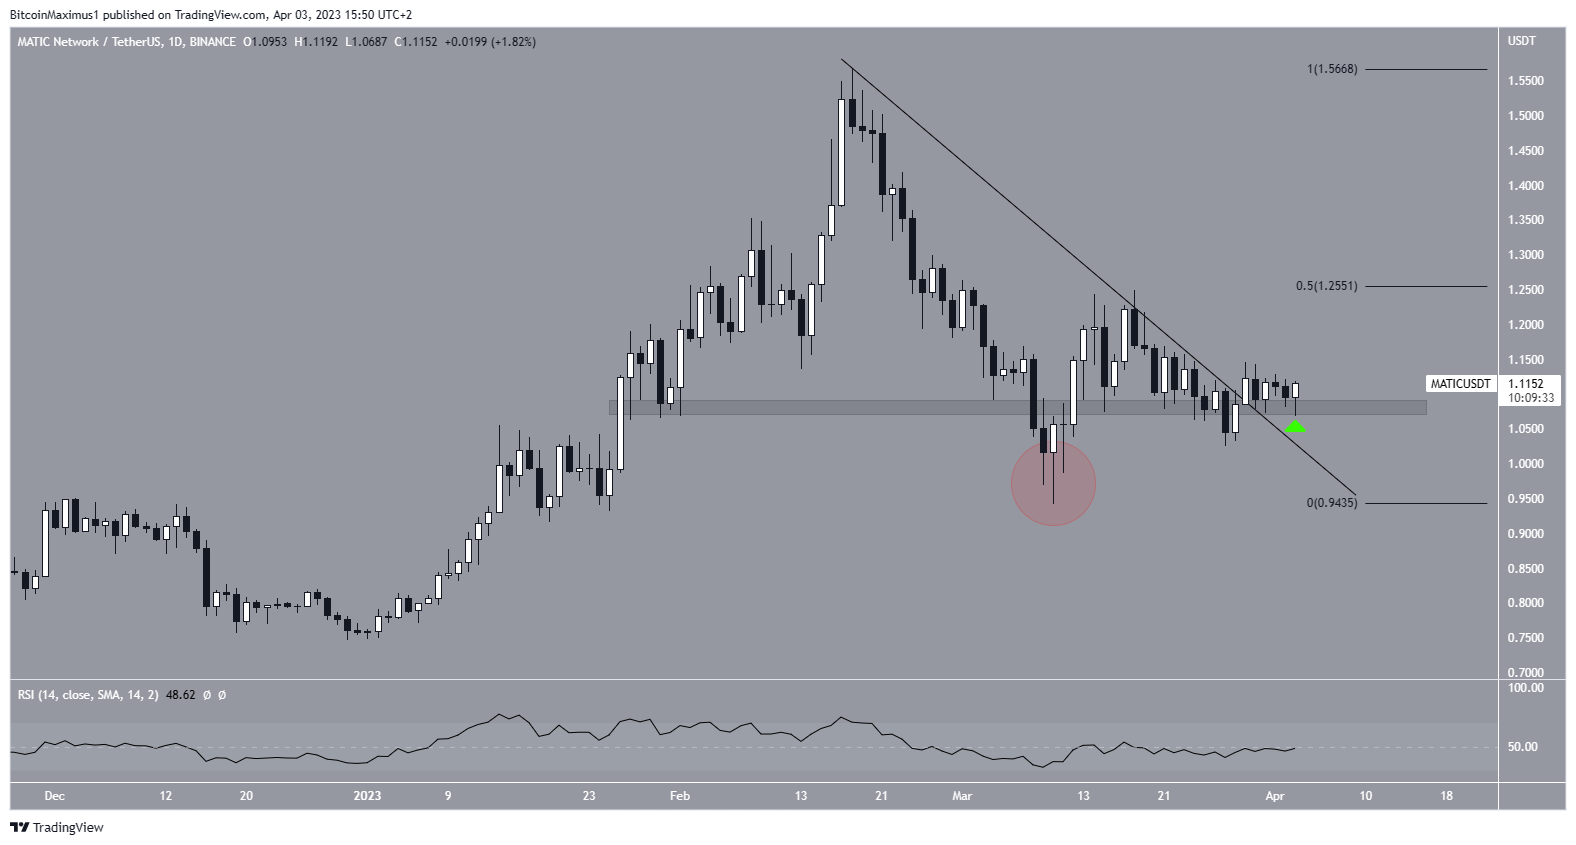
The technical analysis from the daily time frame shows that the MATIC price broke out from a descending resistance line on March 29. The breakout also caused a reclaim of the minor support area at $1.08. As a result, the previous decrease below this area (red circle) is considered illegitimate.
Over the past 24 hours, the MATIC price has been creating a bullish candlestick (green icon).
Since the $1.08 area coincides with the channel’s support line, a breakdown below it could catalyze a sharp fall. On the other hand, a bounce could lead the MATIC price toward the next resistance at $1.25, created by the 0.5 Fib retracement resistance level.
The daily RSI is right at the 50 line, indicating a neutral trend. As a result, it fails to confirm the trend’s direction.
Polygon (MATIC) Price Struggles Against Bitcoin (BTC)
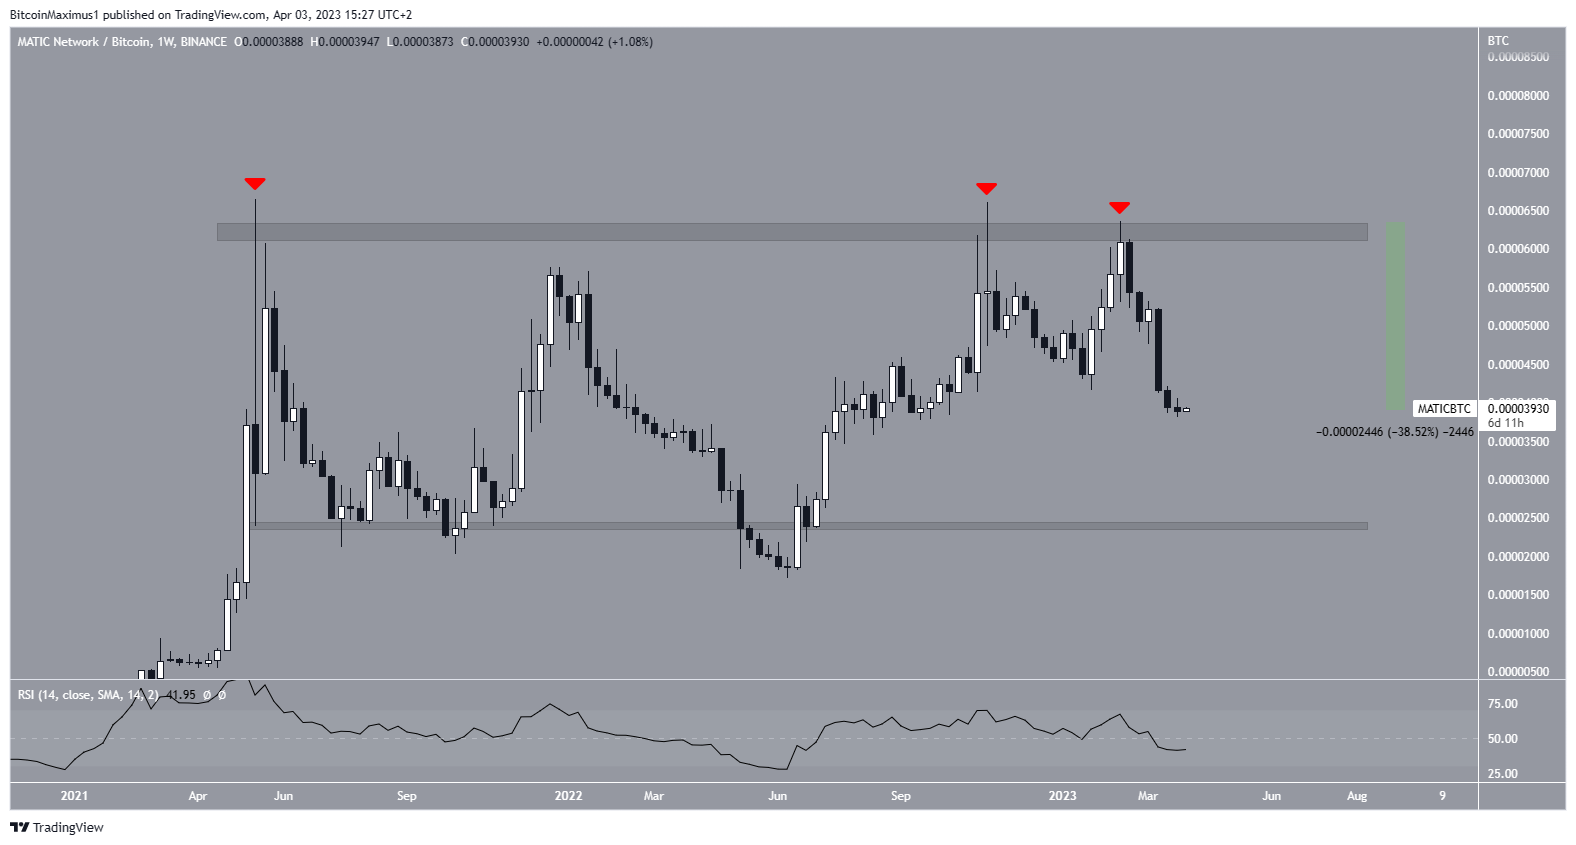
The MATIC/BTC chart is more decisively bearish. The main reason for this is the triple top (red icons) pattern at the all-time high 6,250 satoshi resistance area. The triple top is considered a bearish pattern.
After the third top, the MATIC price began a sharp downward movement, having decreased by 38.50% so far. This also caused the weekly RSI to drop below 50, another bearish sign.
If the decrease continues, MATIC could fall to the range low of 2,400 satoshis. On the other hand, if the price initiates a bearish reversal, it could reach the range high of 6,250 satoshis again. Currently, this seems unlikely.
To conclude, MATIC/USDT pair provides conflicting readings, making it difficult to come to a consensus on the trend’s direction. However, the MATIC/BTC price is decisively bearish, supporting the continuation of the decrease toward 2,400 satoshis.
For BeInCrypto’s latest crypto market analysis, click here.
Disclaimer
In line with the Trust Project guidelines, this price analysis article is for informational purposes only and should not be considered financial or investment advice. BeInCrypto is committed to accurate, unbiased reporting, but market conditions are subject to change without notice. Always conduct your own research and consult with a professional before making any financial decisions. Please note that our Terms and Conditions, Privacy Policy, and Disclaimers have been updated.
