

The Polygon (MATIC) price reaction to the $1.25-$1.32 resistance area could determine the future trend.
The Polygon network is a scaling solution for the Ethereum blockchain, specializing in smart contracts. Its native token is MATIC. UniLend, a decentralized finance platform, announced its launch on the Polygon ZK rollup (Zero-Knowlege). Its previous testnet has more than 10,000 users.
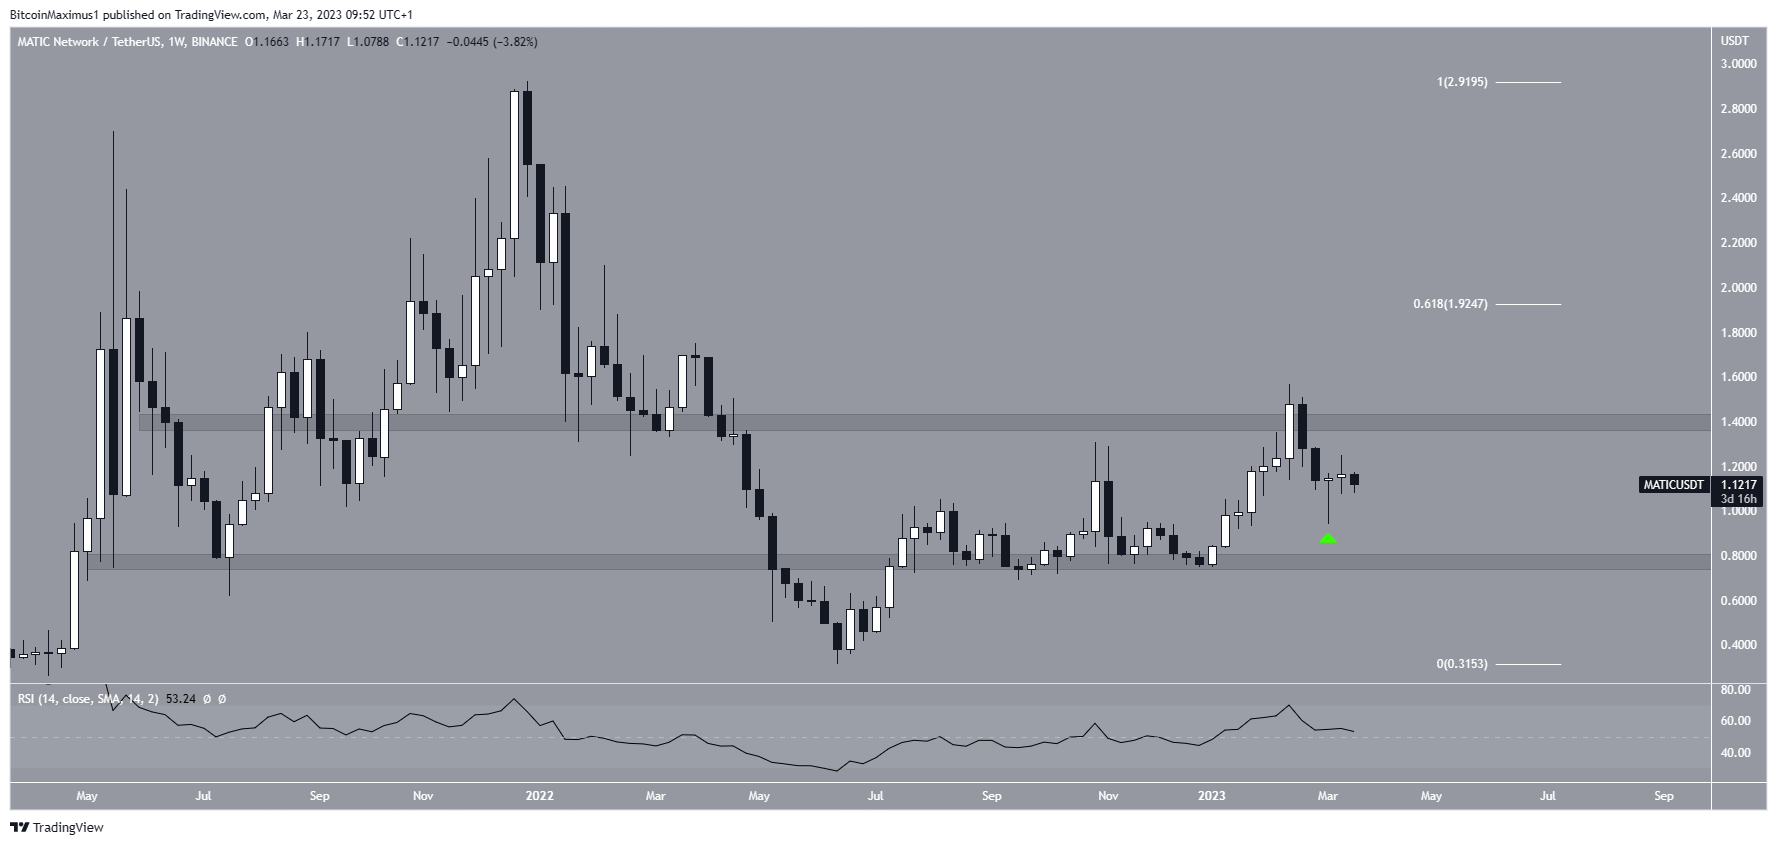
Polygon (MATIC) Lingers in Long-Term Range
The MATIC price has traded above the $0.80 horizontal support area since August 2022. Even though it has bounced above it several times, the price failed to break out above the range high of $1.40.
The MATIC token created a long lower wick during the week of March 6-13, possibly beginning an upward movement toward the range high of $1.40. This is also supported by the weekly RSI, which is trading above 50.
However, if the rally loses momentum, the Polygon price could fall to the $0.80 range low.
Is Polygon (MATIC) Completing Relief Rally?
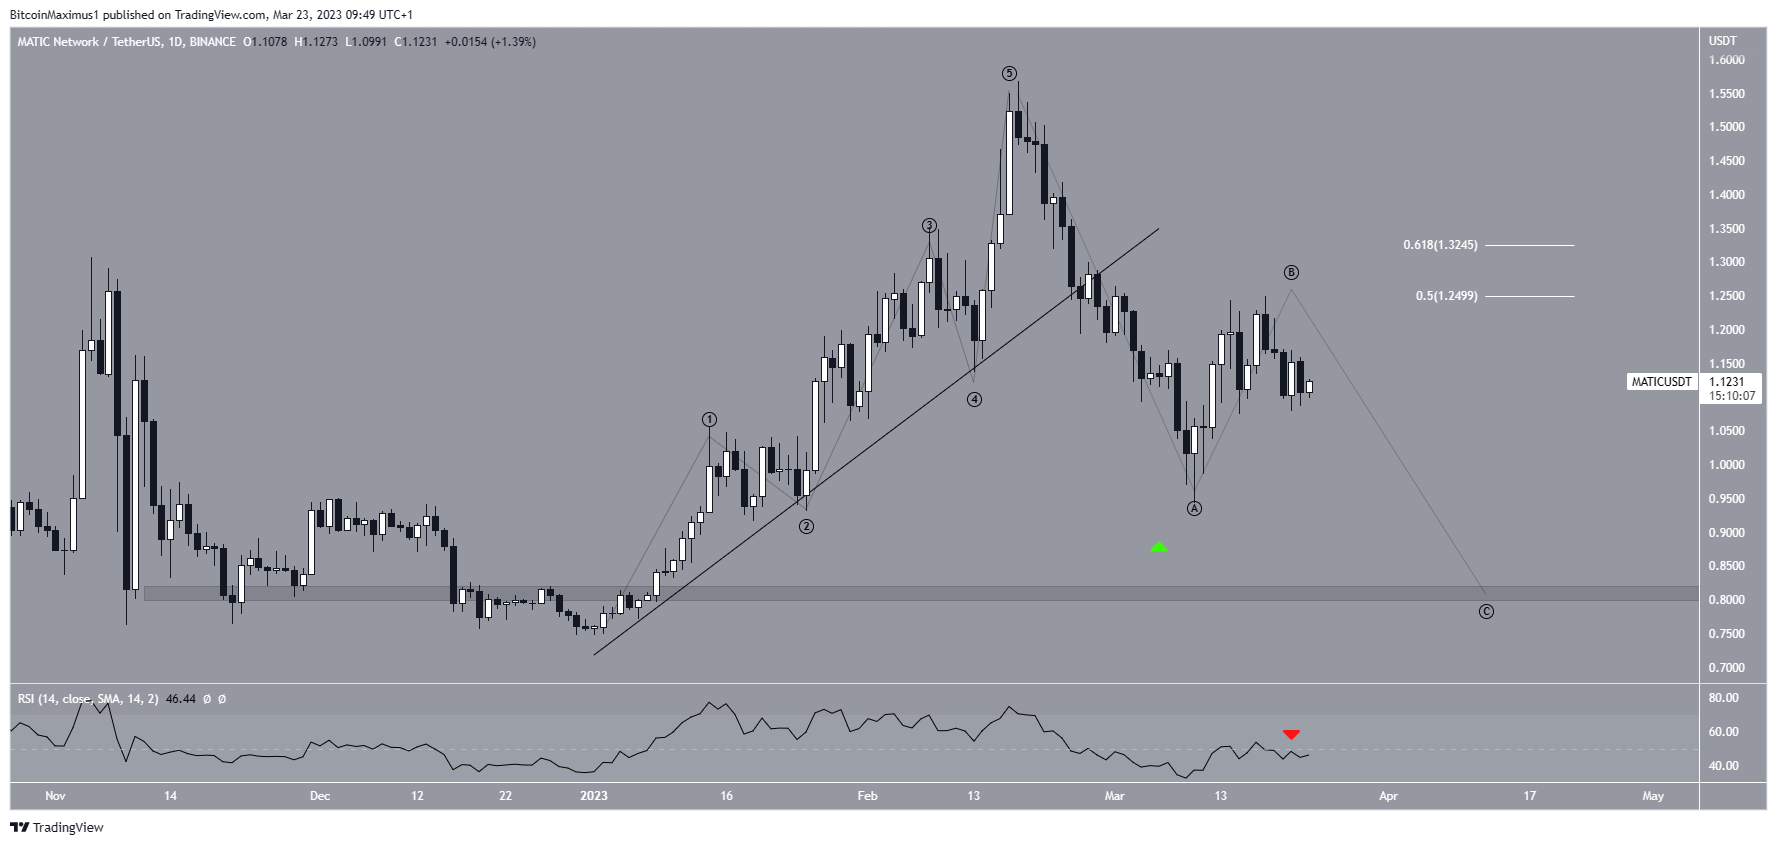
The daily time frame technical analysis indicates that the MATIC price is in wave B of an A-B-C corrective structure. After this is complete, another drop will follow.
This is because the price completed a five-wave upward movement (black) before breaking down from the ascending support line. As a result, the increase is likely done.
If the count is correct, the MATIC price will increase to the 0.5-0.618 Fib retracement resistance (white) levels at $1.25-$1.32. Afterward, another drop will follow. Due to the fact that the daily RSI was rejected by 50 (red icon), it is possible that the price has now begun the C wave which will take it toward the $0.81 support area, which also coincides with the previously outlined range low.
On the other hand, a decisive close above $1.32 will invalidate this bearish forecast. In that case, the MATIC price could increase to the long-term resistance at $1.40 and possibly break out, moving toward $1.92.
To conclude, the most likely MATIC price forecast is a fall toward $0.81. However, a close above $1.33 would invalidate this and could initiate an increase to $1.40 and possibly $1.92.
For BeInCrypto’s latest crypto market analysis, click here.
Trusted
Disclaimer
In line with the Trust Project guidelines, this price analysis article is for informational purposes only and should not be considered financial or investment advice. BeInCrypto is committed to accurate, unbiased reporting, but market conditions are subject to change without notice. Always conduct your own research and consult with a professional before making any financial decisions. Please note that our Terms and Conditions, Privacy Policy, and Disclaimers have been updated.
