


The Polygon (MATIC) price broke out from a long-term diagonal resistance and is attempting to move above another one.
In the short term, MATIC is trading at the higher end of its range, raising the question of whether it will successfully break out or face rejection.
Polygon Price Clears Long-Term Resistance
The weekly time frame movement shows that MATIC has increased since October 2023. Two weeks ago, the upward movement triggered a breakout from a long-term descending resistance line that had existed since the all-time high. At the time of the breakout, the trend line had been in place for 780 days.
Today, the MATIC price reached a high of $1.08 and is moving above a long-term horizontal resistance area.
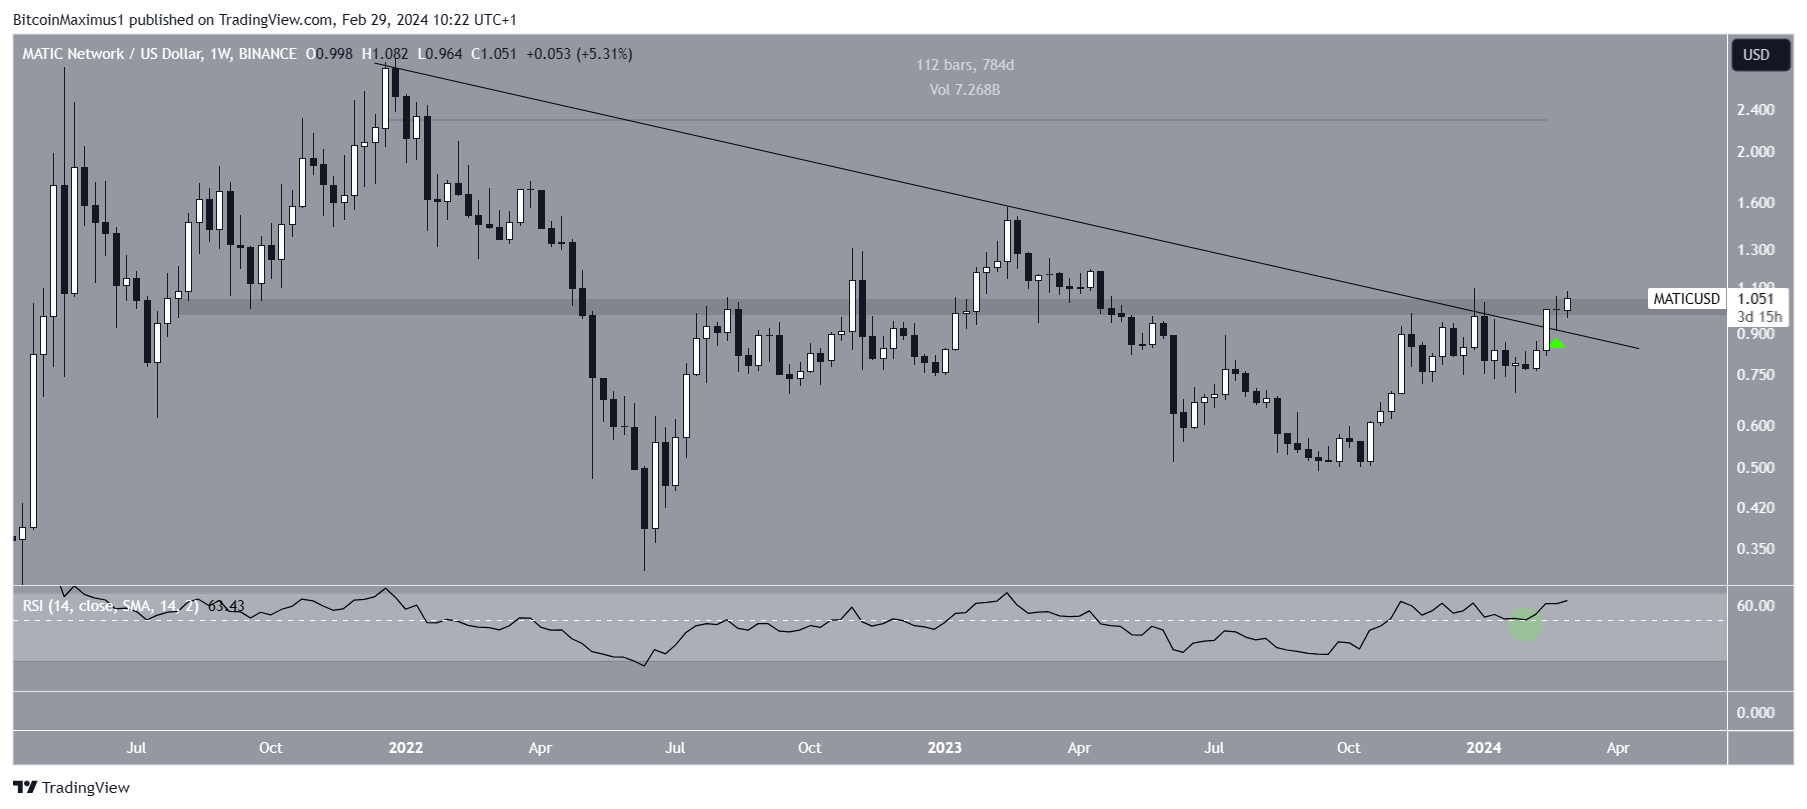
The weekly Relative Strength Index (RSI) supports the price increase. The RSI is a momentum indicator traders use to evaluate whether a market is overbought or oversold and whether to accumulate or sell an asset.
Readings above 50 and an upward trend suggest that bulls still have an advantage, while readings below 50 indicate the opposite. The indicator bounced at 50 (green circle) and is increasing, both signs of a bullish trend.
MATIC Price Prediction: Breakout Confirmed?
While the weekly chart gives a bullish reading, the daily one is mixed. This is because of the price action, RSI readings, and wave count.
Firstly, the wave count is bullish. Technical analysts utilize the Elliott Wave theory to ascertain the trend’s direction by studying recurring long-term price patterns and investor psychology.
The most likely count suggests that the MATIC price is in wave three of a five-wave upward movement. Giving waves one and three a 1:1 ratio leads to a high near $1.55. A 47% MATIC increase is required to reach it. Still, the price action is undetermined because MATIC trades below the $1.05 resistance.
Read More: Polygon (MATIC) Price Prediction 2024/2025/2030
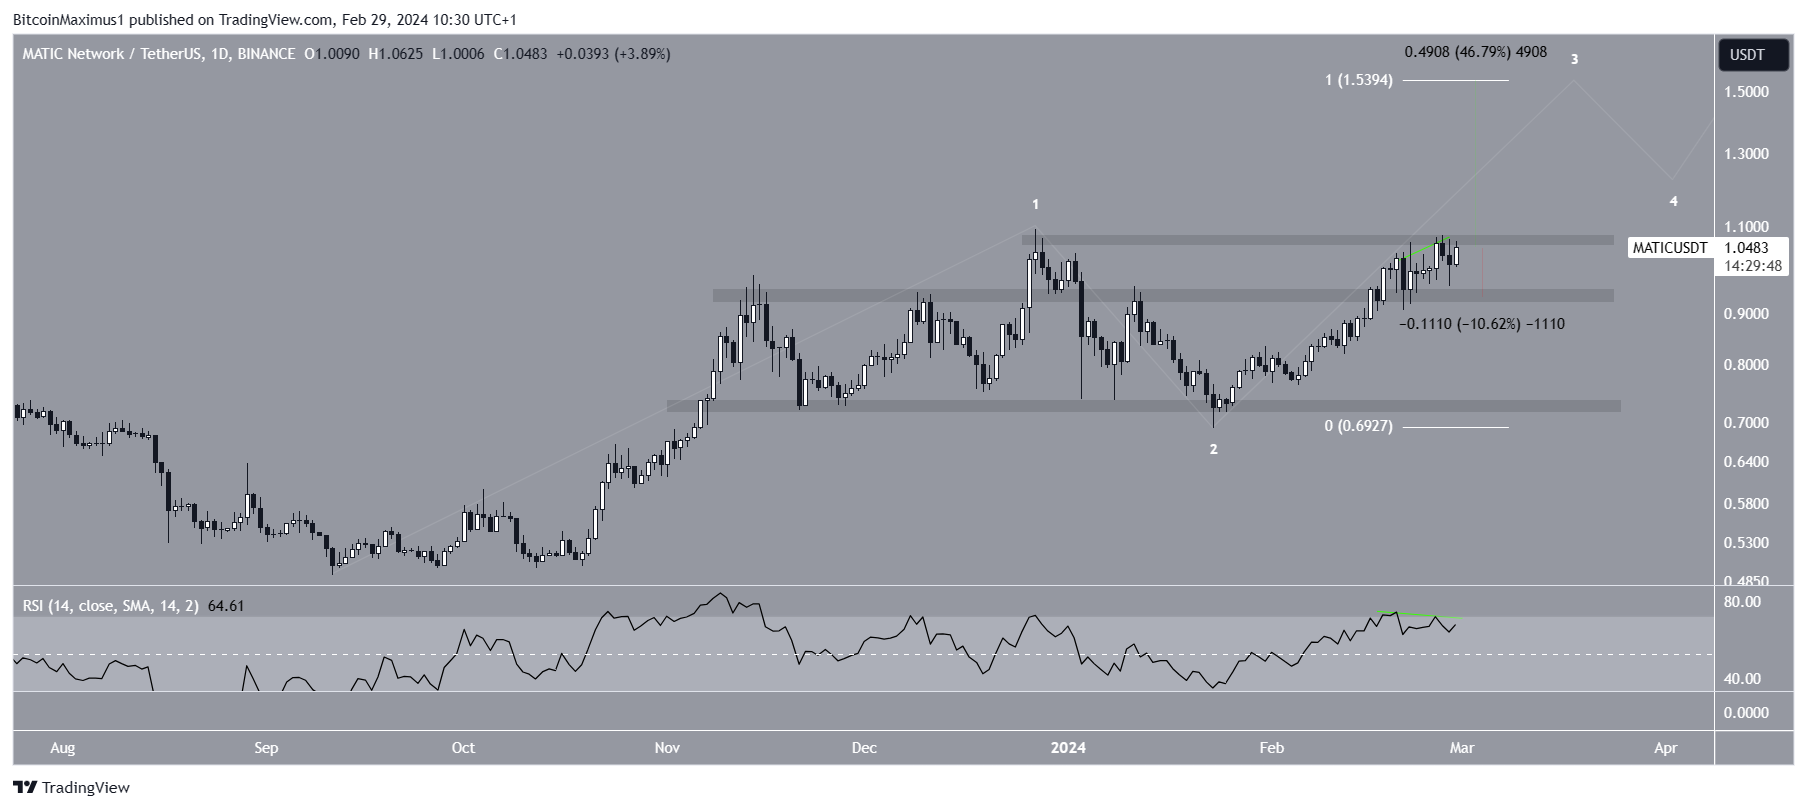
Finally, the daily RSI is bearish since it has generated a bearish divergence (green). As a result of these mixed readings, whether the MATIC price breaks out above $1.05 or gets rejected can determine the future trend. A successful breakout can trigger a nearly 50% increase to $1.55, while a rejection can cause a 10% drop in the closest support at $0.95.


