

The Polygon (MATIC) price has reached a critical confluence of resistance levels between $1.25-$1.33. The reaction to it could determine the future trend.
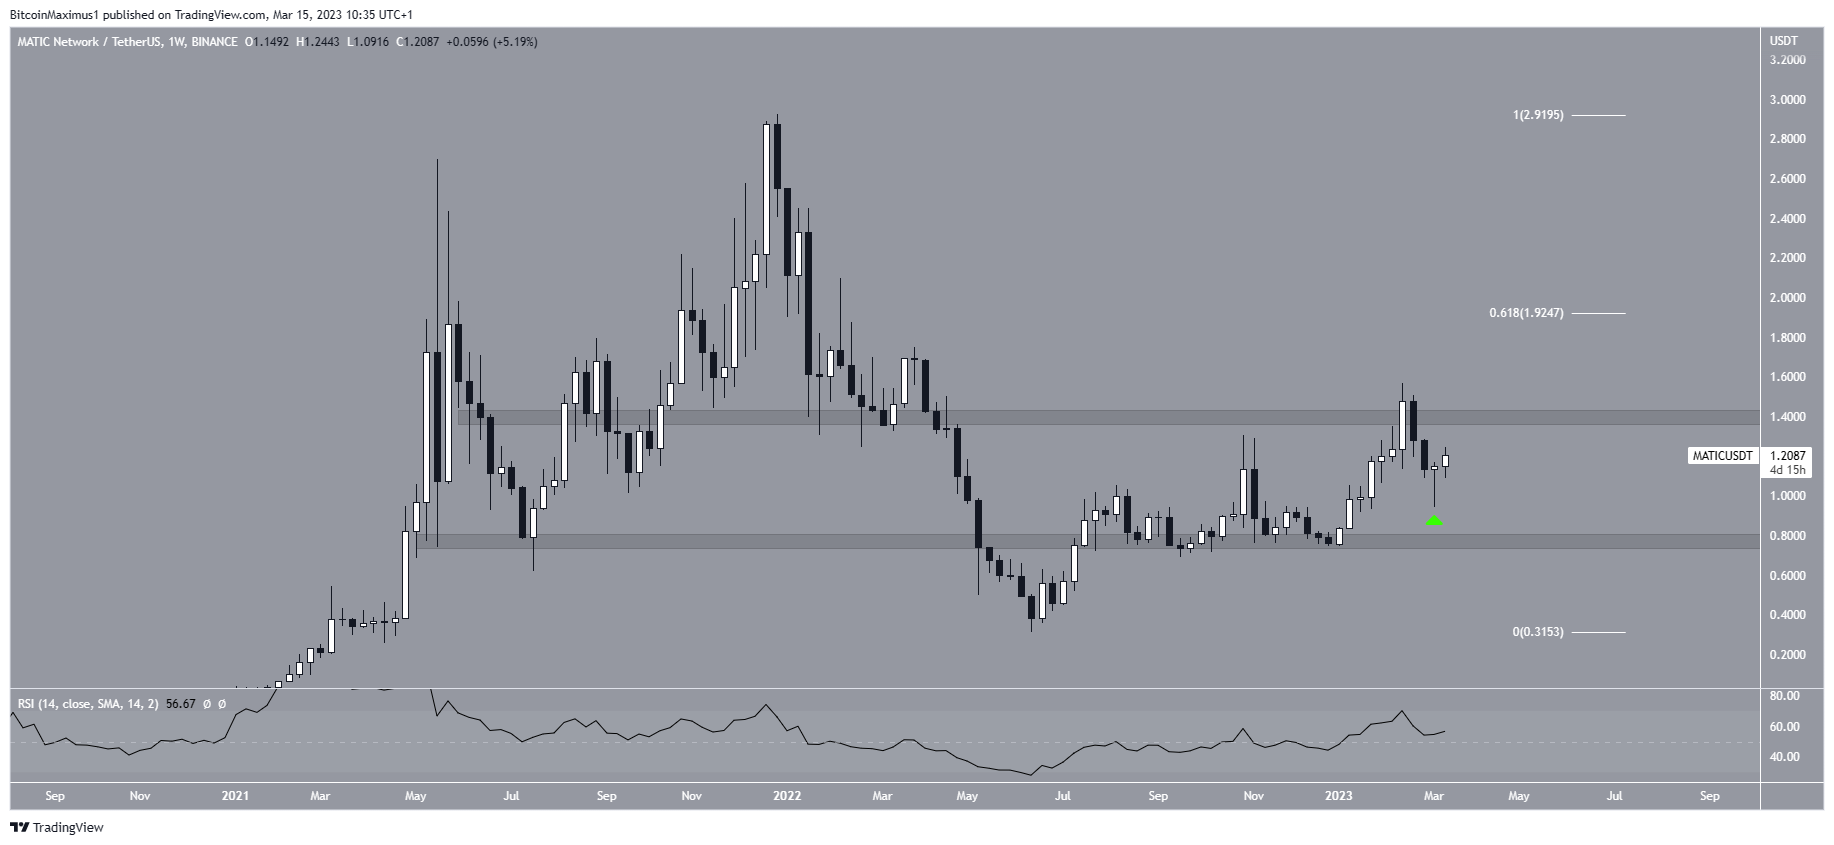
The Polygon Network is a scaling solution for the Ethereum blockchain, specializing in smart contracts. Its native token is MATIC. The weekly time frame shows that the MATIC price deviated above the $1.40 horizontal resistance area in February and fell shortly afterward. However, the price created a bullish candlestick last week, characterized by a long lower wick (green icon), ending the fall.
The price could be making another attempt at reaching the $1.40 resistance area. This is supported by the weekly RSI, which is increasing and is above 50.
However, if the rally loses strength, the Polygon price could fall back to the $0.80 horizontal support area.
Has Polygon (MATIC) Price Begun a Relief Rally?
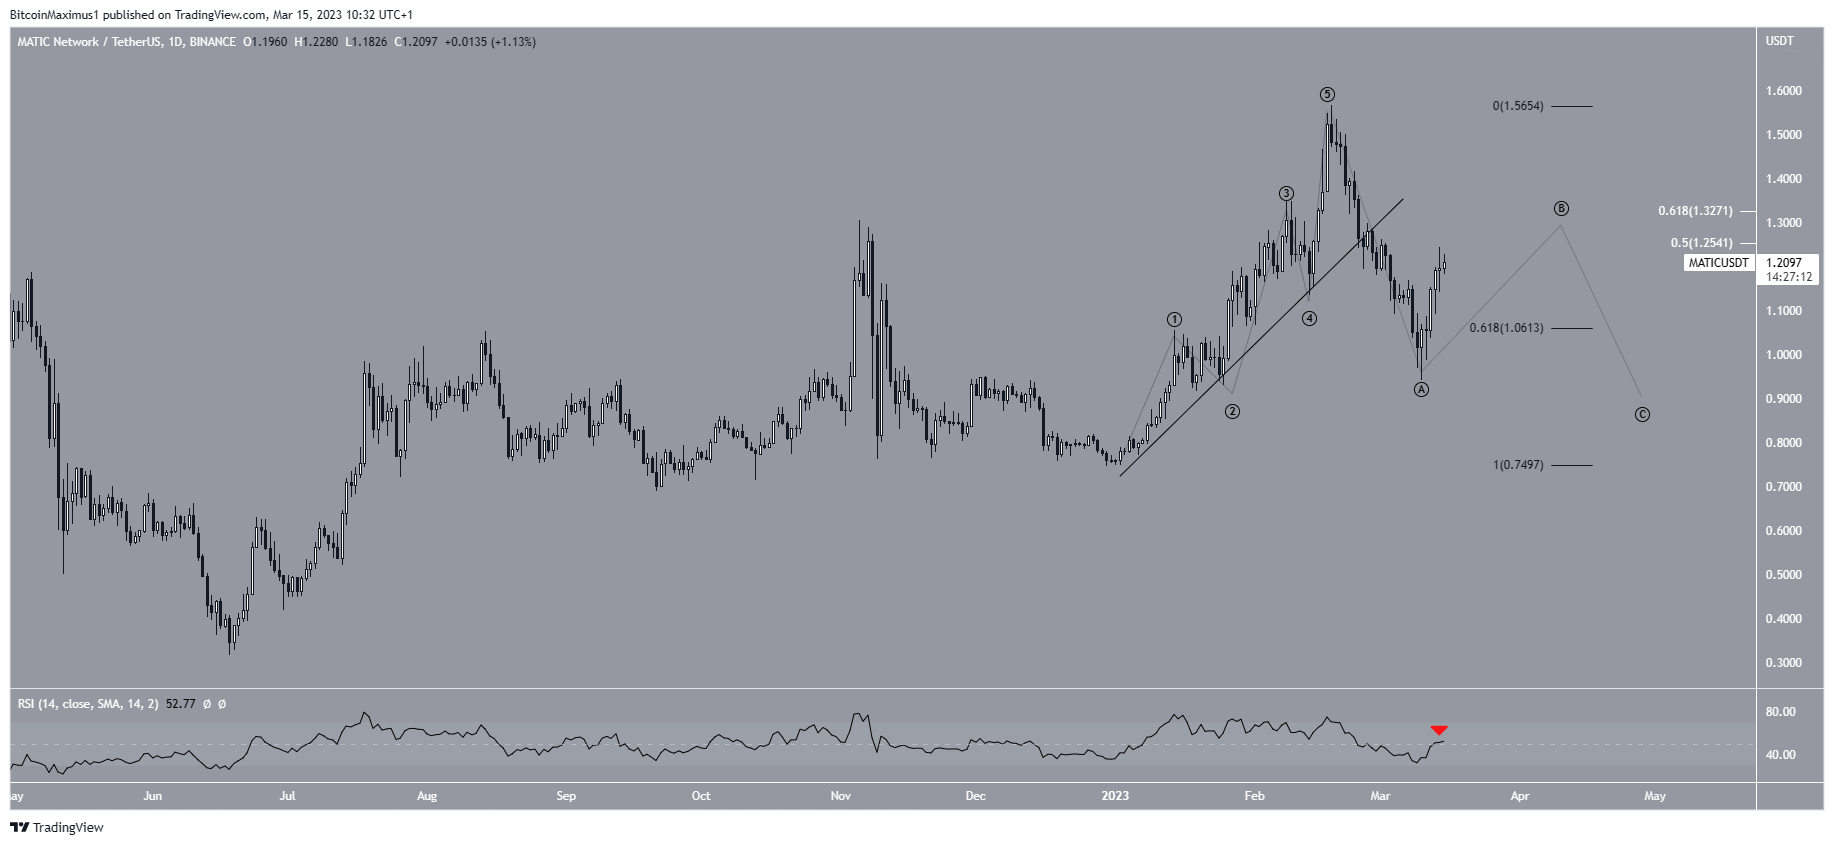
The technical analysis from the daily time frame suggests that the MATIC price is still correcting the previous upward movement. If so, it is currently in a relief rally, after which another decrease will follow.
The MATIC token price seems to have completed a five-wave upward movement (black). It confirmed this with a breakdown from an ascending support line. This led to a low of $0.94 on March 10. Afterward, the price created a bullish hammer candlestick and reclaimed the 0.618 Fib retracement support level at $1.06. This is a bullish sign.
However, the price is now trading close to the 0.5-0.618 Fib retracement resistance (white) levels at $1.25-$1.33. If the increase is indeed a B wave rally, the area could act as a top. Moreover, the daily RSI was rejected by 50 (red icon).
So, the reaction to the $1.25-$1.33 area could determine the future trend’s direction. A rejection from the area would also lead to a RSI rejection. In that case, another downward movement below $1 would be expected. A decisive reaction is likely to occur in the next 24 hours.
However, if the MATIC price manages to break out, it could increase toward $1.93.
To conclude, the direction of the future MATIC price trend is undetermined. Whether the price breaks out or gets rejected from the $1.25-$1.33 area will likely determine if the trend is bullish or bearish. A close above this area could accelerate the increase toward $1.93 while a rejection could lead to a fall toward $0.90.
For BeInCrypto’s latest crypto market analysis, click here.
Disclaimer
In line with the Trust Project guidelines, this price analysis article is for informational purposes only and should not be considered financial or investment advice. BeInCrypto is committed to accurate, unbiased reporting, but market conditions are subject to change without notice. Always conduct your own research and consult with a professional before making any financial decisions. Please note that our Terms and Conditions, Privacy Policy, and Disclaimers have been updated.
