Polkadot (DOT) Eyes $9 Amid Bullish Market Trends

2 mins
Updated by Ryan Boltman
Join our Trading Community on Telegram

In Brief

  • Polkadot's (DOT) price is close to flipping $8 into support, which is crucial in initiating recovery.
  • After preventing two bearish crossovers this month, MACD is now observing rising bullishness.
  • The Open Interest has registered a growth of $63 million in the last three days, reaching $284 million.
  • promo

Polkadot’s (DOT) price is on track to continue its ongoing recovery after noting corrections over the past two months.

This is supported by the investors who have been exhibiting bullishness towards the asset.

Polkadot Traders Pour Money

Polkadot’s price at the time of writing is observing the impact of DOT holders changing their behavior. The evidence of the same can be seen in the Open Interest in the Futures market.

Open interest (OI) refers to the total number of active derivative contracts, such as futures or options, that have not yet been settled. In the case of DOT, this OI has risen by more than $63 million, bringing the total to $284 million from $221 million in merely three days.

Polkadot Open Interest.
Polkadot Open Interest. Source: Coinglass

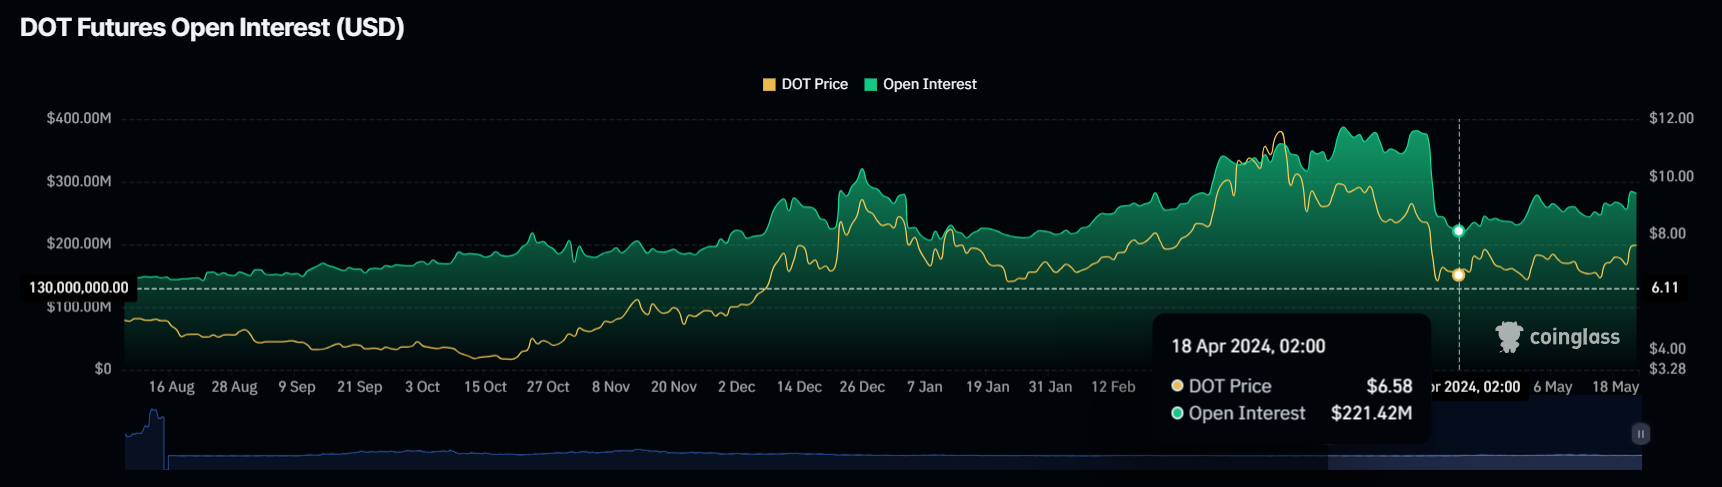
While a rise in OI does not necessarily mean that the move is bullish, the positive funding rate suggests that long contracts dominate over short contracts. 

Additionally, the Moving Average Convergence Divergence (MACD) is also observing a surge in bullishness. MACD is a trend-following momentum indicator that shows the relationship between two moving averages of an asset’s price, helping to identify potential buy and sell signals.

Read More: What Is Polkadot (DOT)?

Polkadot MACD.
Polkadot MACD. Source: TradingView

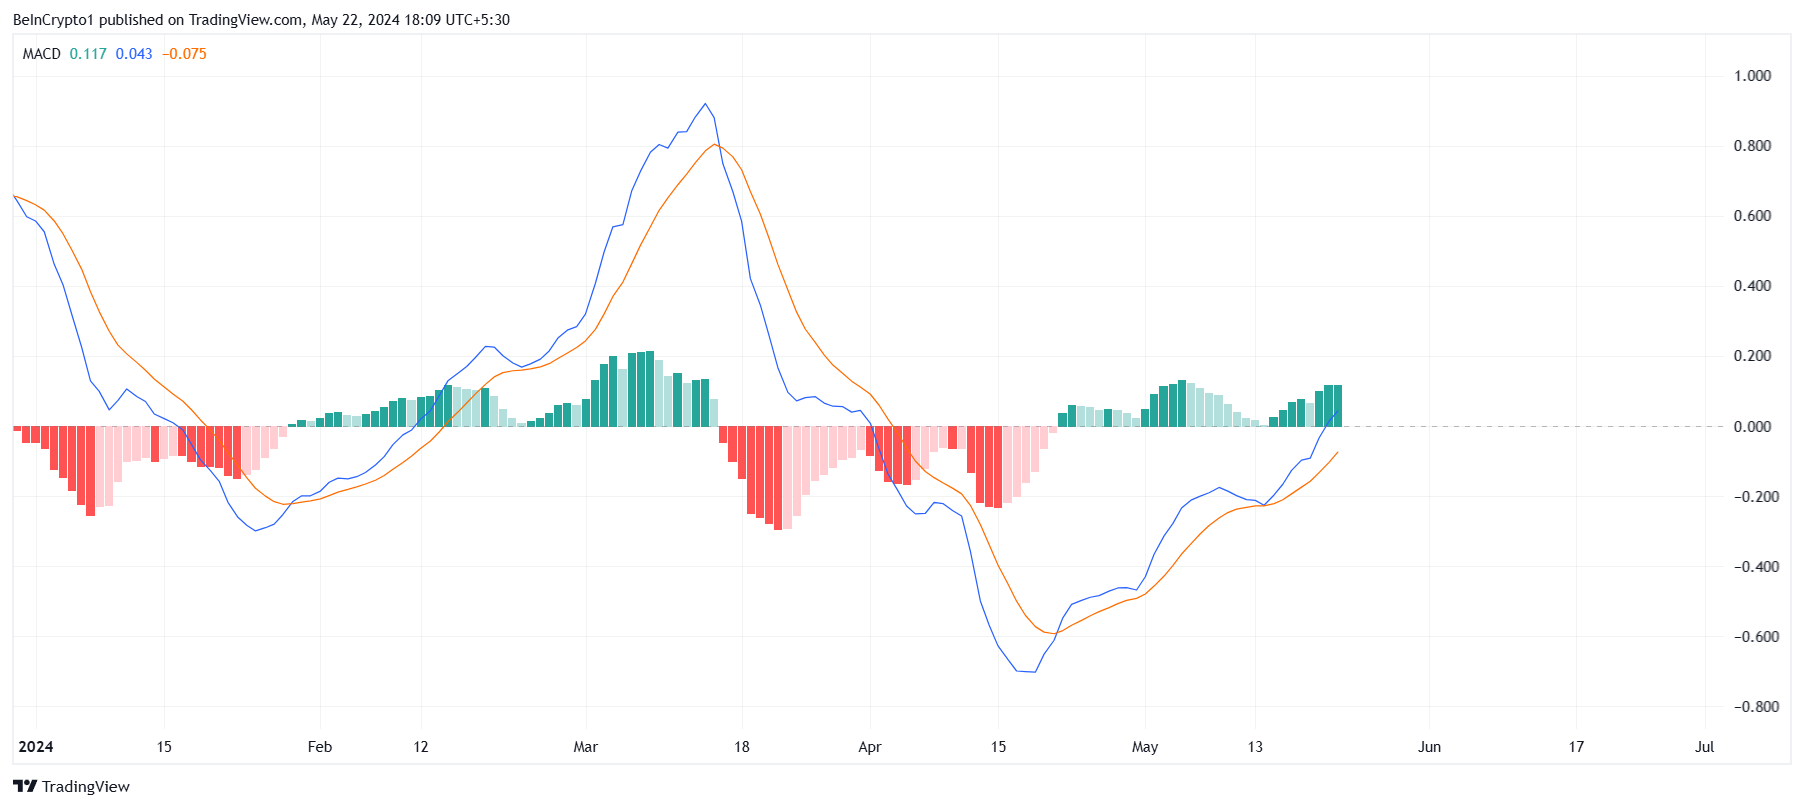
The indicator has avoided a bearish crossover twice this month now, and the green bars on the histogram confirm that bullishness has taken precedence. This could be reflected in Polkadot’s price as well, assisting a rise.

DOT Price Prediction: Another Rise After a Monthly High

Polkadot’s price trading at $7.50 is close to breaching the resistance at $8.0. Flipping this resistance into support can push the price further up, as it previously served as support before a past uptick.

This could result in an uptrend towards $9.0, marking a 22% rally for the cryptocurrency.

Read More: Polkadot (DOT) Price Prediction 2024/2025/2030

Polkadot Price Analysis.
Polkadot Price Analysis. Source: TradingView

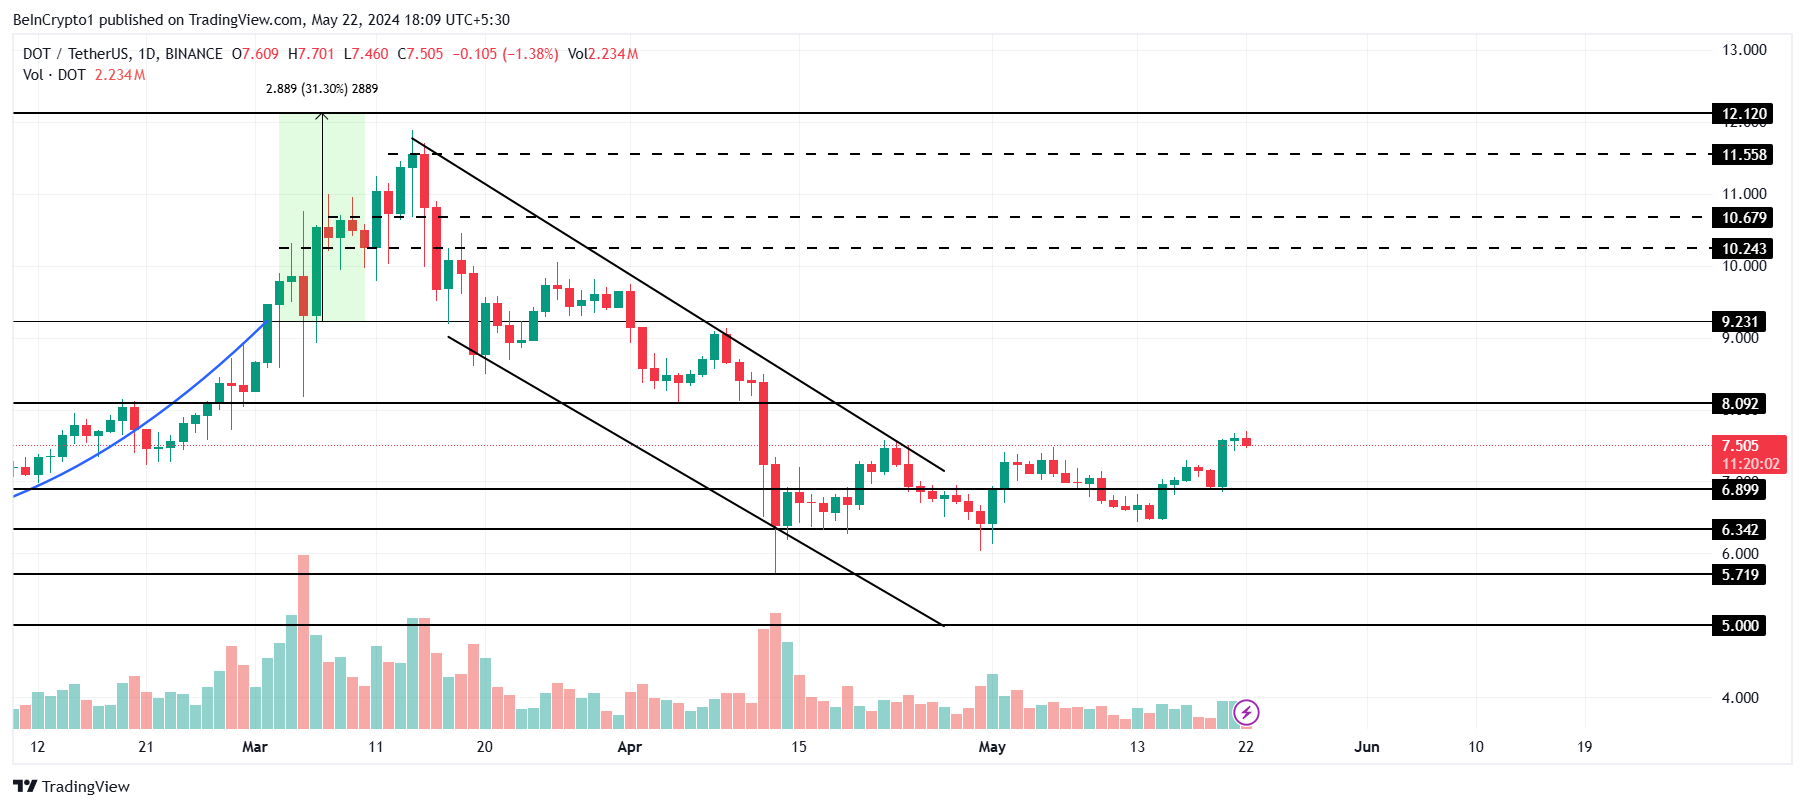
However, if the breach fails, Polkadot’s price could fall back to $6.8, where it might face consolidation. A drop below this would send DOT to $6.3, marking a 14% drawdown, invalidating the bullish thesis.

Top crypto projects in the US | July 2024
Harambe AI Harambe AI Explore
Uphold Uphold Explore
Coinbase Coinbase Explore
Chain GPT Chain GPT Explore
Top crypto projects in the US | July 2024
Harambe AI Harambe AI Explore
Uphold Uphold Explore
Coinbase Coinbase Explore
Chain GPT Chain GPT Explore
Top crypto projects in the US | July 2024

Trusted

Disclaimer

In line with the Trust Project guidelines, this price analysis article is for informational purposes only and should not be considered financial or investment advice. BeInCrypto is committed to accurate, unbiased reporting, but market conditions are subject to change without notice. Always conduct your own research and consult with a professional before making any financial decisions. Please note that our Terms and ConditionsPrivacy Policy, and Disclaimers have been updated.

Frame-2t314.png
Aaryamann Shrivastava
Aaryamann Shrivastava is a technical and on-chain analyst at BeInCrypto, where he specializes in market reports on cryptocurrencies from diverse sectors, including Telegram Apps, liquid staking, Layer 1s, meme coins, artificial intelligence (AI), metaverse, internet of things (IoT), Ethereum ecosystem, and Bitcoin. Previously, he conducted market analysis and technical assessments of various altcoins at FXStreet and AMBCrypto, covering all aspects of the crypto industry, including...
READ FULL BIO
Sponsored
Sponsored