
The Polkadot (DOT) price and the Kusama (KSM) price are trading slightly above crucial horizontal support levels. Whether they bounce or break down could determine the future trend’s direction.
Polkadot (DOT) Price Attempts to Find Support
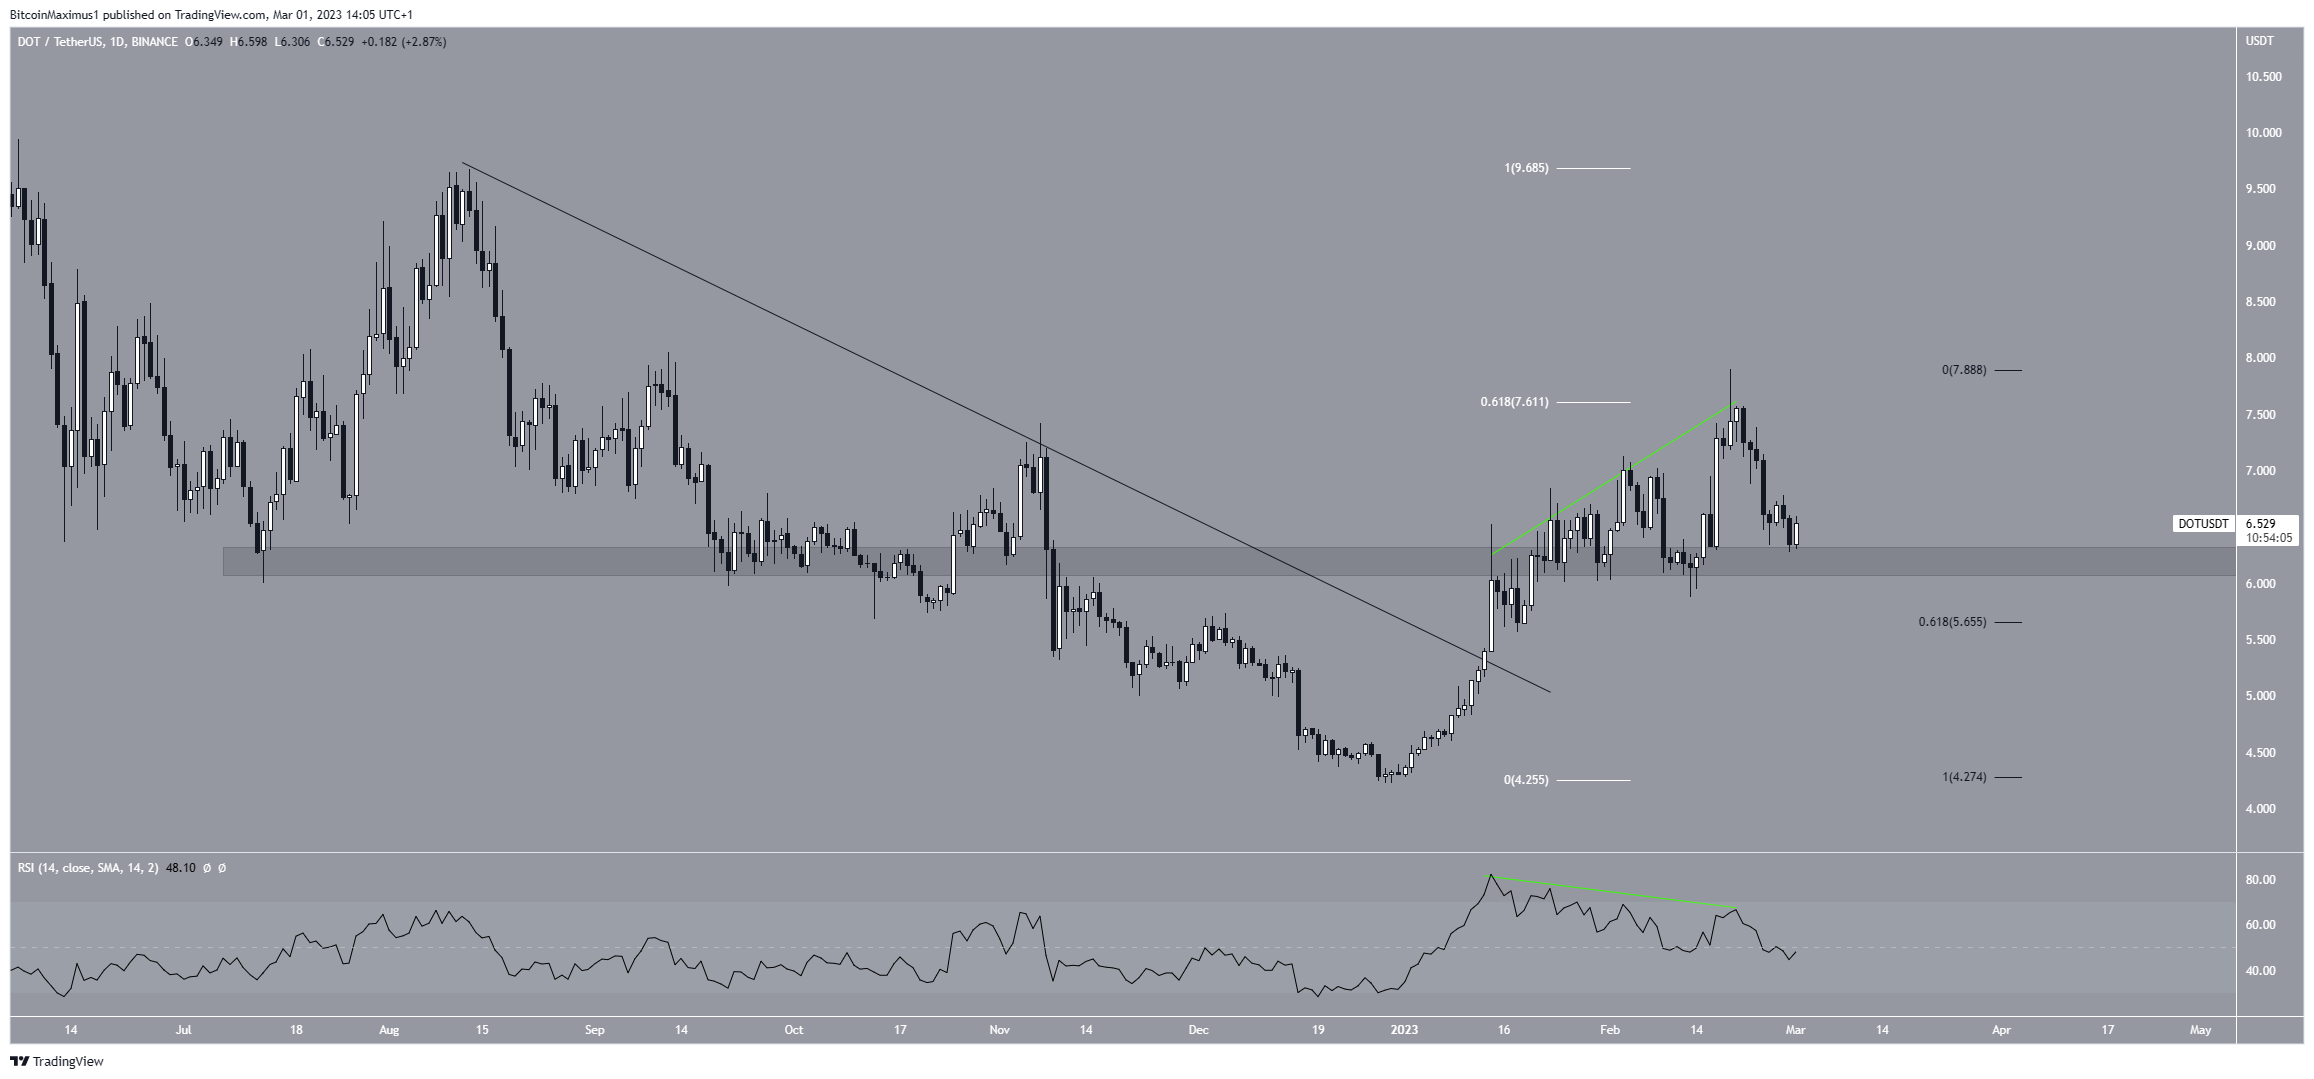
The Polkadot price has decreased below a descending resistance line since Aug. 2022. The downward movement led to a low of $4.22 on Dec. 29.
The price began an upward movement shortly afterward and broke out from the descending resistance line on Jan. 13. Then, it also reclaimed the $6.20 horizontal area.
Before falling, the DOT price reached a yearly high of $7.90 on Feb. 19. The decrease was preceded by bearish divergence in the daily RSI. The price is now trading just above the $6.20 horizontal support area.
Whether the price bounces in this area or breaks down could determine the future trend’s direction. A breakdown could lead to a fall to the 0.618 Fib retracement support level (black) at $5.65, while a bounce could lead to another attempt at breaking out above $7.60.
Kusama (KSM) Price Gets Rejected
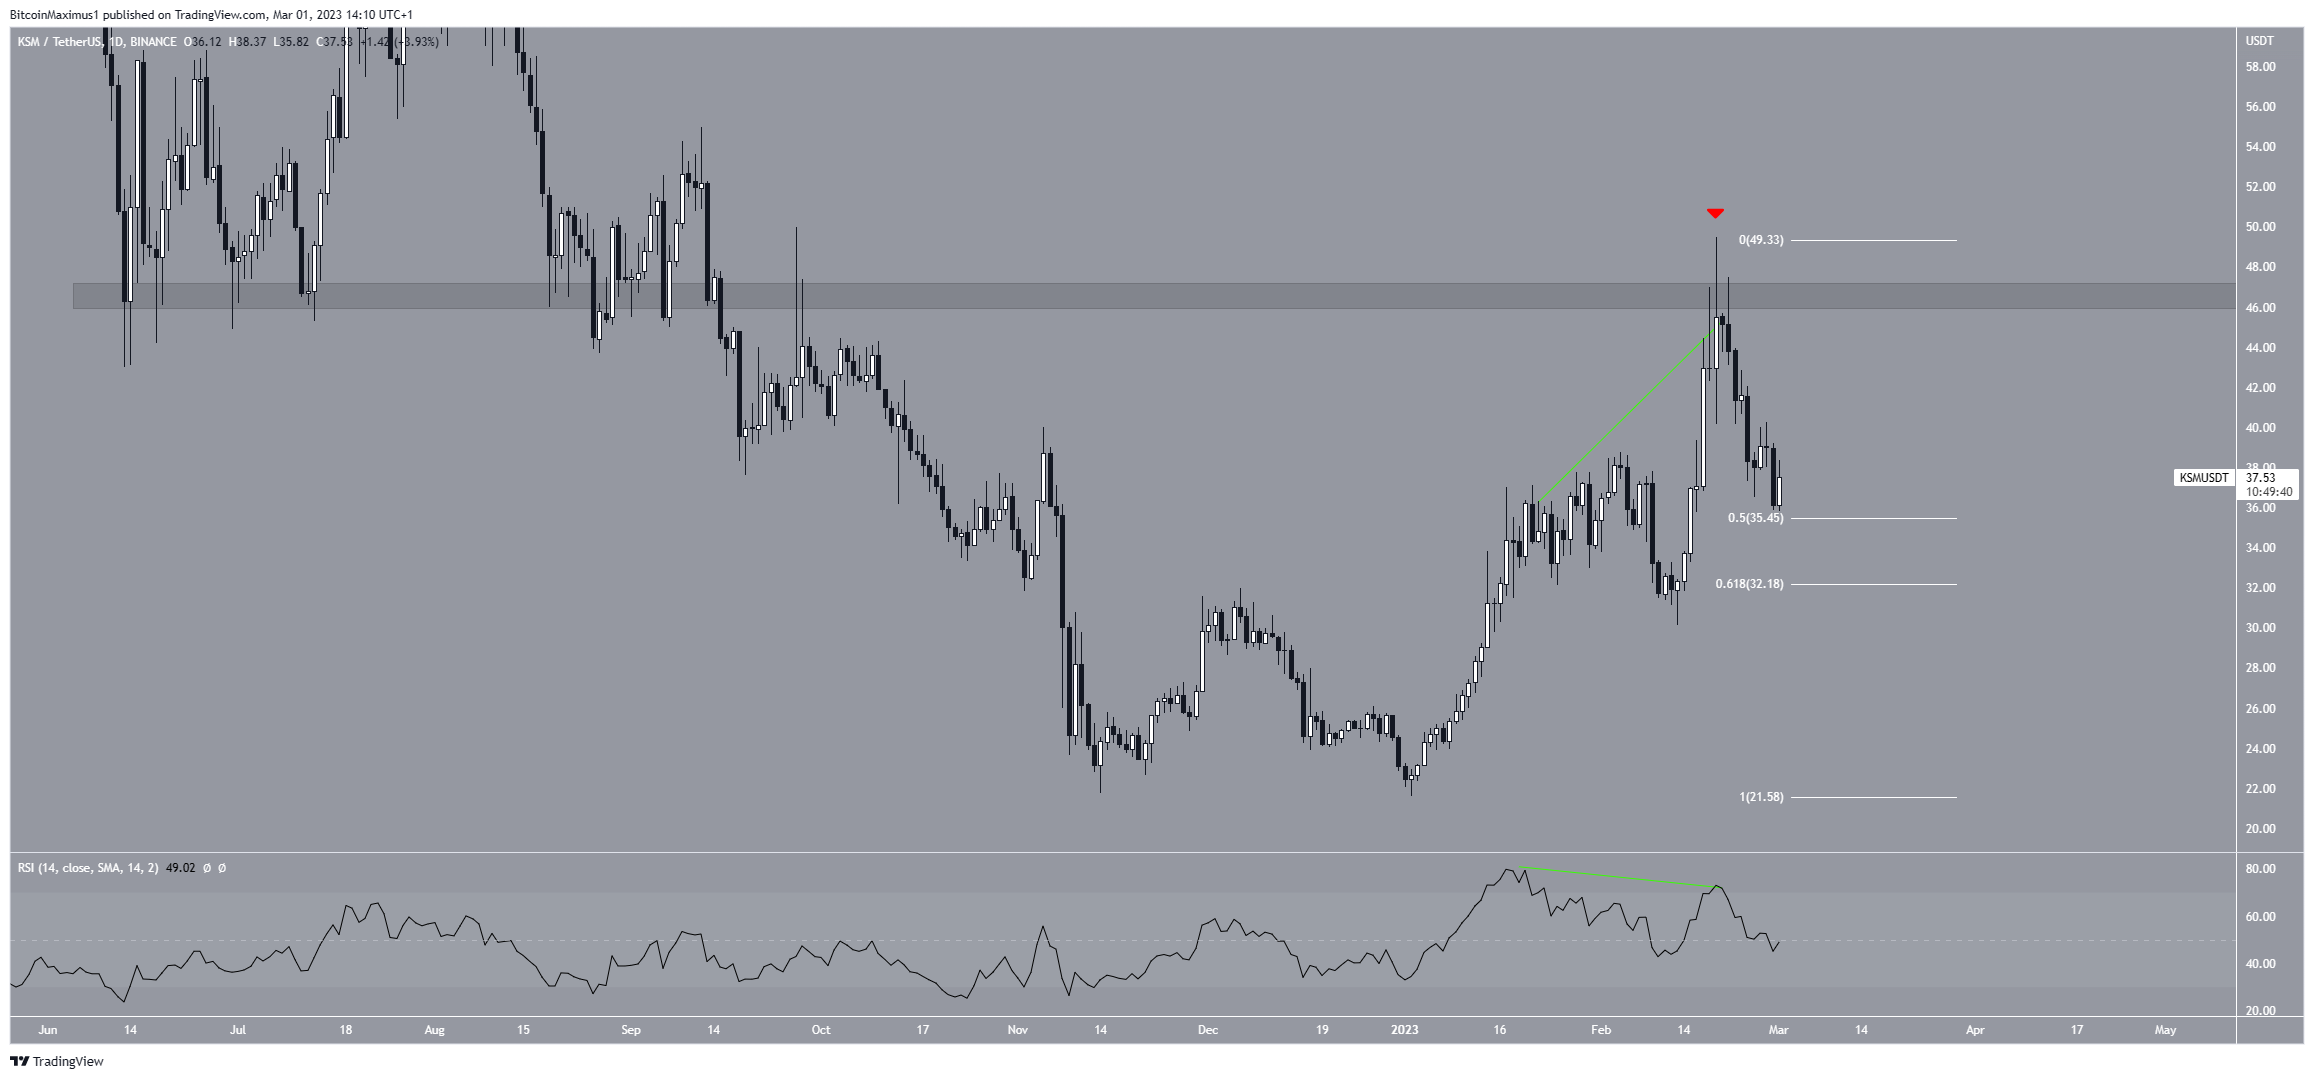
The KSM token price has increased significantly since the beginning of the year. The increase led to a new yearly high of $49.49 on Feb. 19. However, the price failed to break out above the $46.50 resistance area, instead creating a long upper wick (red icon) and falling. The drop was preceded by bearish divergence in the daily RSI (green line).
Currently, the Kusama price is trading just above the 0.5 Fib retracement support level at $35.45.
If it bounces, the price could make another attempt at reaching the $46.50 resistance area. However, a breakdown below $35.45 could trigger a fall to the 0.618 Fib retracement support level at $32.18.
For BeInCrypto’s latest crypto market analysis, click here.
