
Polkadot (DOT) is trading inside an important support area. It is showing bullish signs in the short-term, meaning that it could soon initiate an upward movement.
Polkadot is a well-known cryptocurrency that is currently ranked number 11 based on its market capitalization. It is a platform that allows users to develop their own blockchain, which can be specialized for specific purposes.
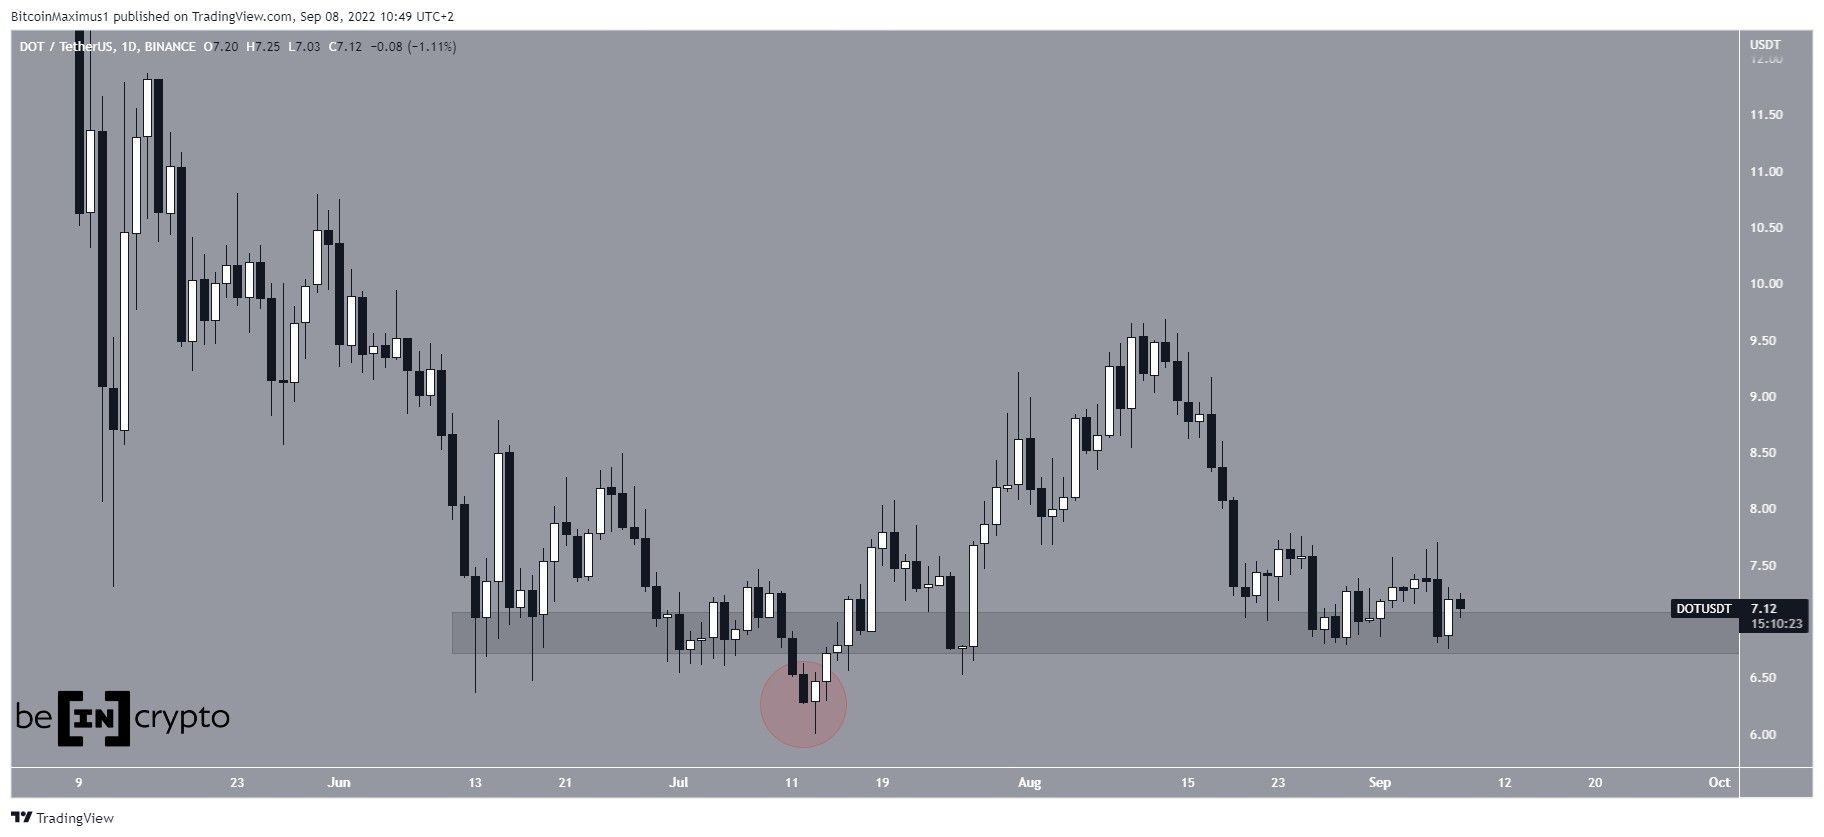
DOT has been trading close to the $6.90 horizontal support area since June 13. During this time, it deviated below the area on July 13 (red circle) before reclaiming it shortly afterward.
Currently, the price is trading inside this support area once more. Whether it breaks down or bounces could determine the direction of the future trend.
Future movement
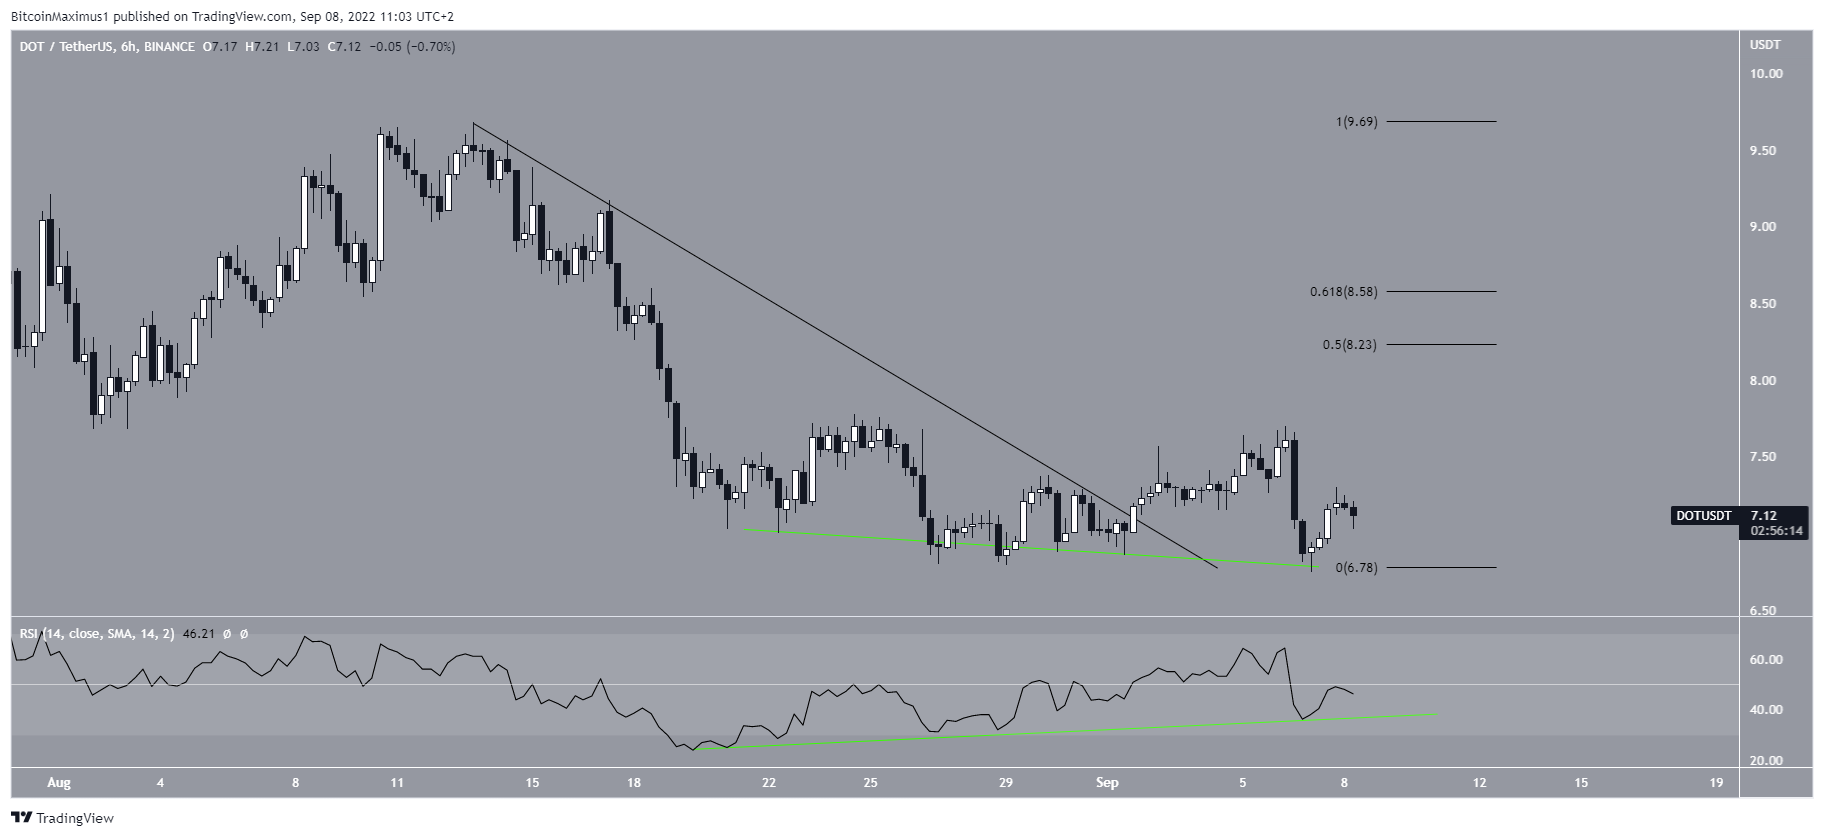
The six-hour chart supports the initiation of an upward movement. There are two main reasons. Firstly, the price has broken out from a short-term descending resistance line, which had been in place since the Aug highs.
Secondly, the six-hour RSI has generated bullish divergence (green line). Such divergences often precede upward movements.
If an increase follows, the closest resistance area would be between $8.25 and $8.60, created by the 0.5-0.618 Fib retracement resistance levels. A potential increase above it would likely take the price above its Aug highs.
Long-term DOT support
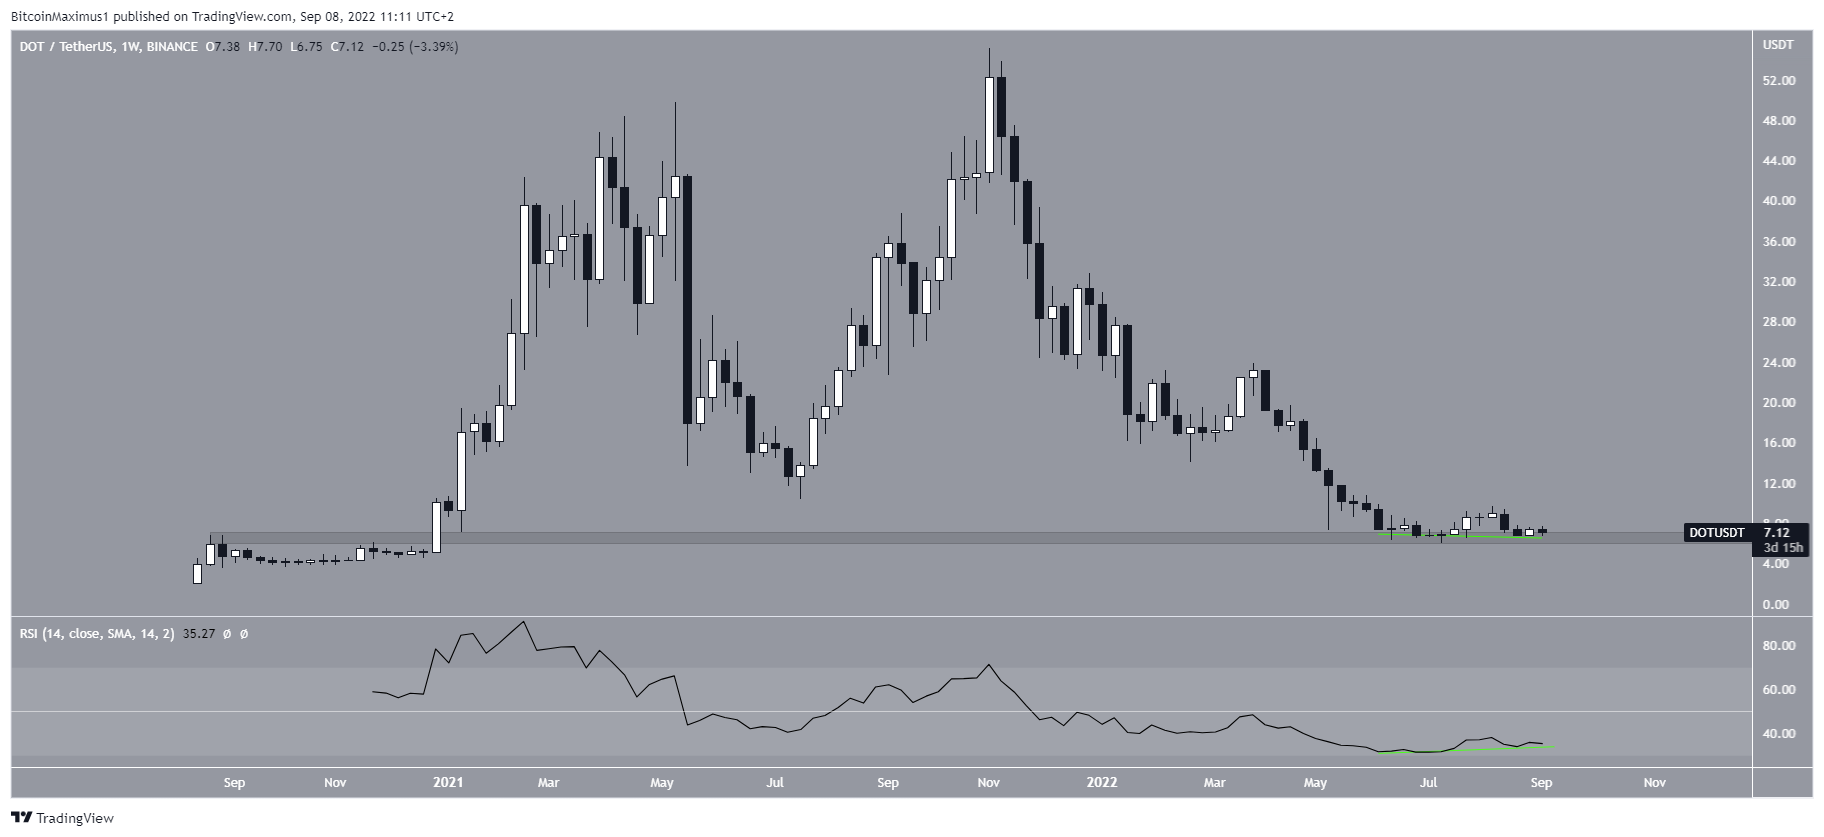
The weekly chart further reiterates the importance of the $6.90 horizontal support area. The area had acted as resistance in Sept 2020 and has now turned to support.
Moreover, a bounce at the current levels would confirm a bullish divergence (green line) in the weekly RSI. Divergences in such high time frames very often precede considerable upward movements.
Cryptocurrency trader @Leb_crypto tweeted a chart of DOT, stating that it is possible that we will see a 100% price increase.
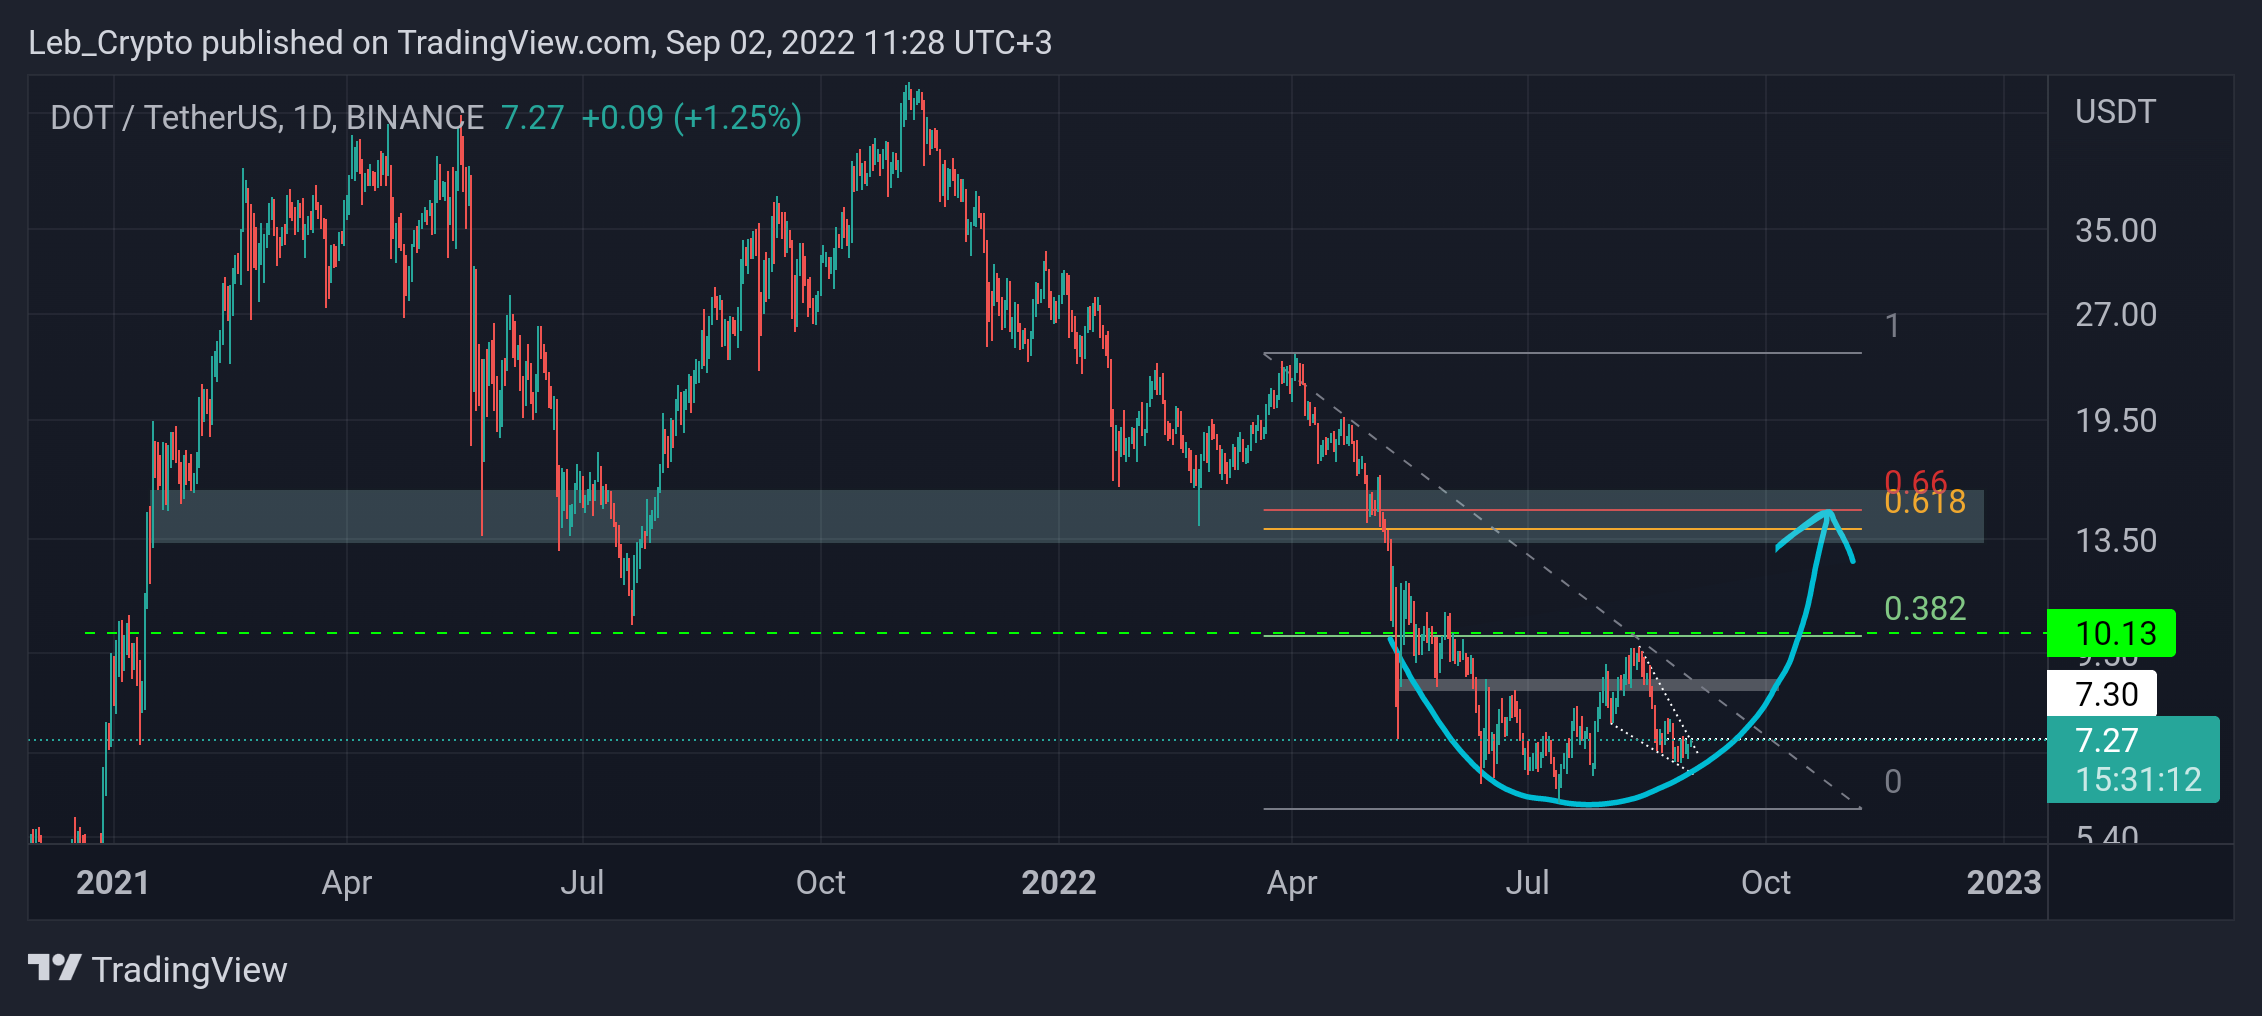
In order for this to occur, DOT has to hold on above the current long-term support level and validate its weekly bullish divergence.
For Be[in]Crypto’s latest Bitcoin (BTC) analysis, click here
