
Bitcoin (BTC) increased significantly on Wednesday and is showing the initial signs of a potential bullish trend reversal.
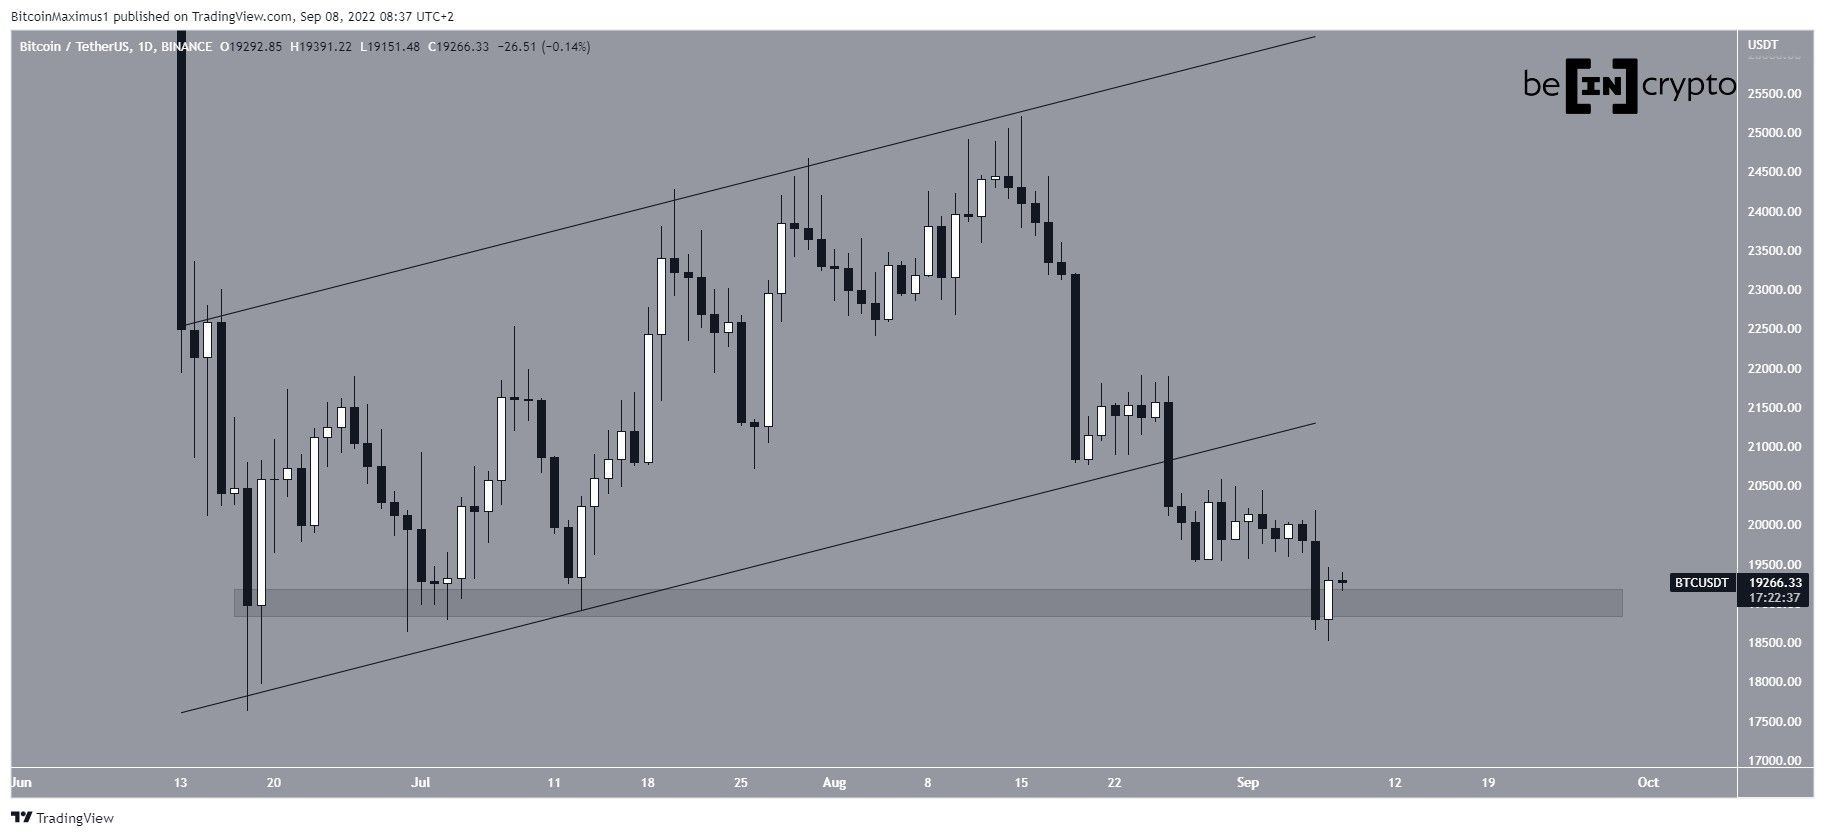
BTC has been falling since reaching a high of $25,211 on Aug 15. On Aug 26, the downward movement caused a breakdown from an ascending parallel channel that had been in place since the June 18 bottom.
After the breakdown, Bitcoin continued to decrease and reached a low of $18,510 on Sept 7. The low was made slightly below the $19,000 support area, which was created by the June lows. However, the price bounced shortly afterward and reclaimed the area in the process.
Potential for bounce
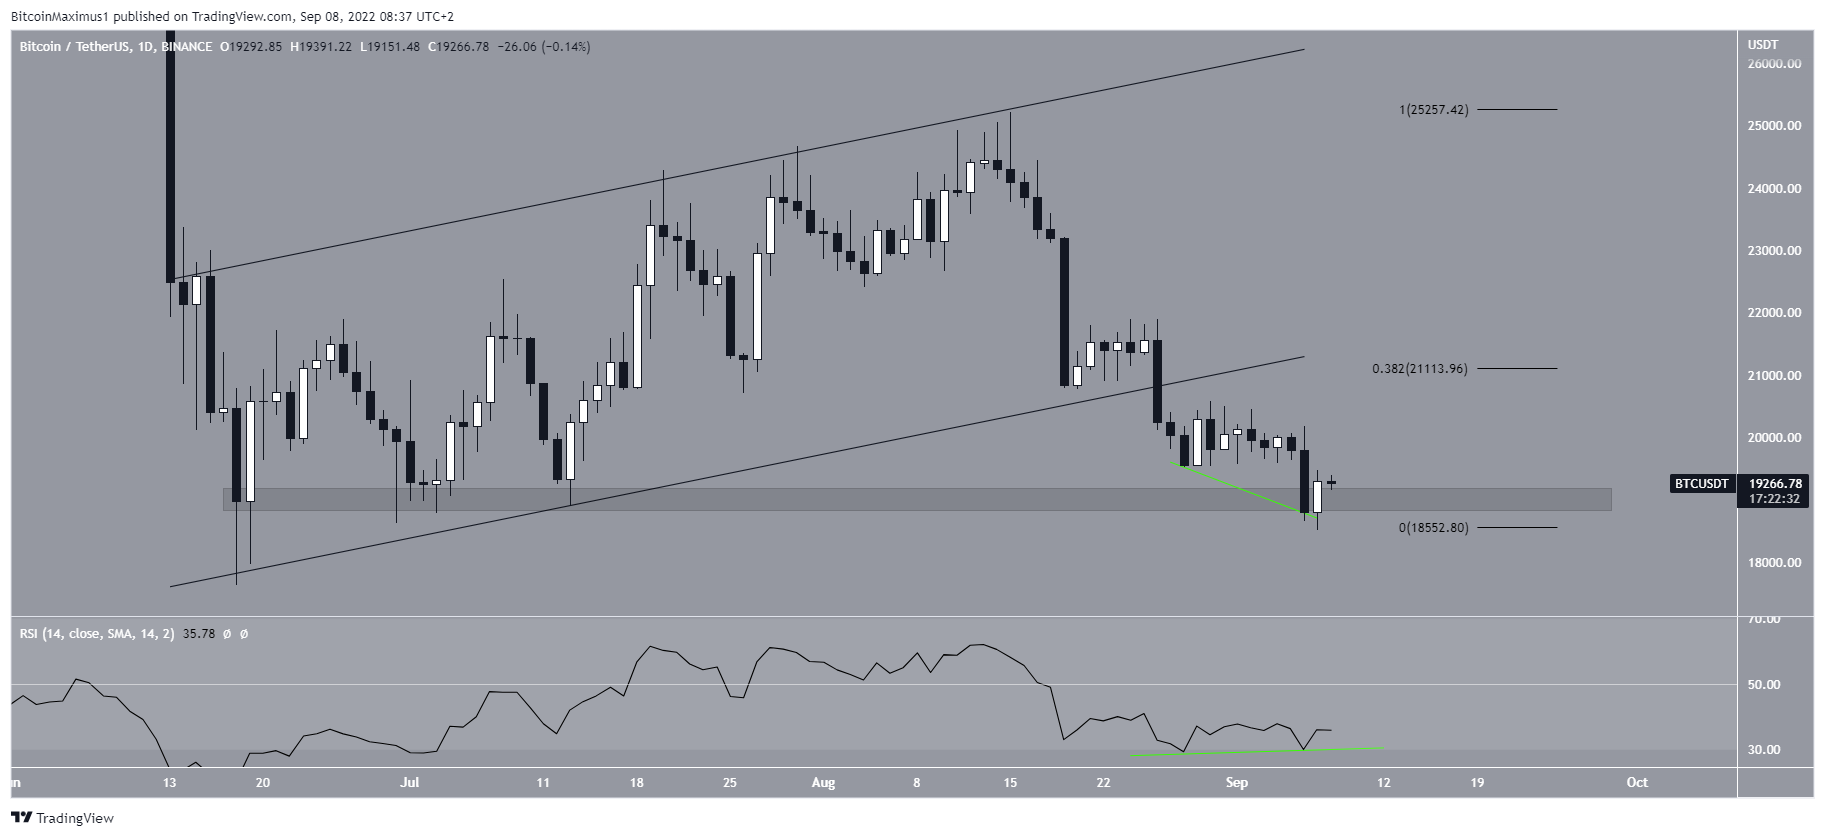
Technical indicator readings support the possibility of a bounce. This is visible in the daily RSI, which has generated a significant amount of bullish divergence. Furthermore, it has bounced prior to reaching oversold territory. Such readings often precede considerable price bounces.
If one occurs, the closest resistance area would be at $21,100. This is the 0.382 Fib retracement resistance level and coincides with the support line of the previous channel.
BTC wave count analysis
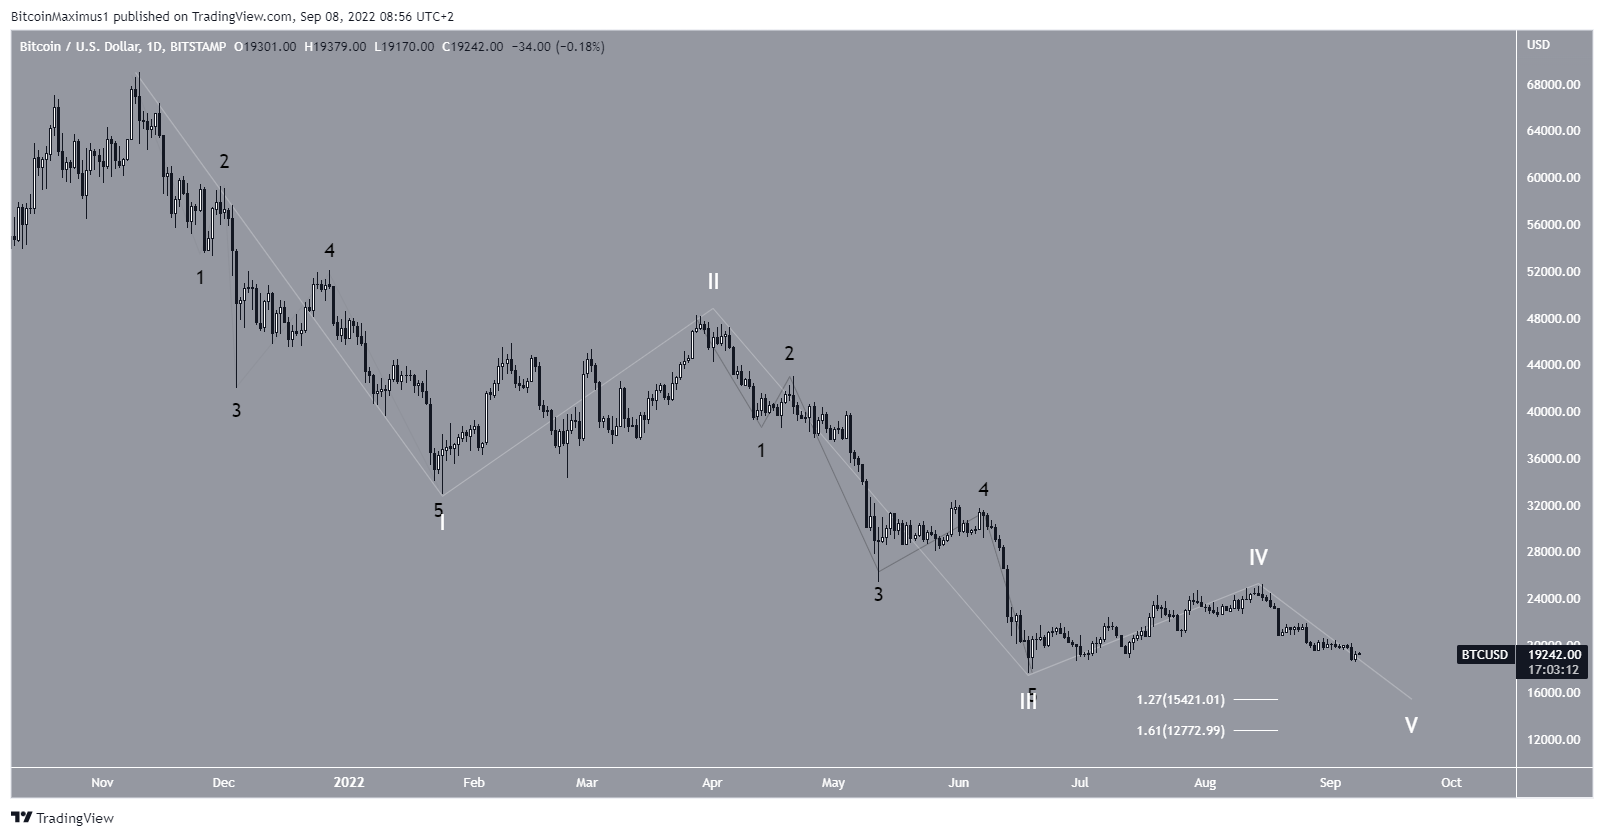
The wave count suggests that BTC is in the fifth and final wave of a downward movement (white) that began with the all-time high price in Nov.
If correct, the downward movement would take Bitcoin below its June lows, potentially falling to $15,420 or $12,770. The targets are found using the 1.27 and 1.61 external Fib retracement levels of wave four (white).
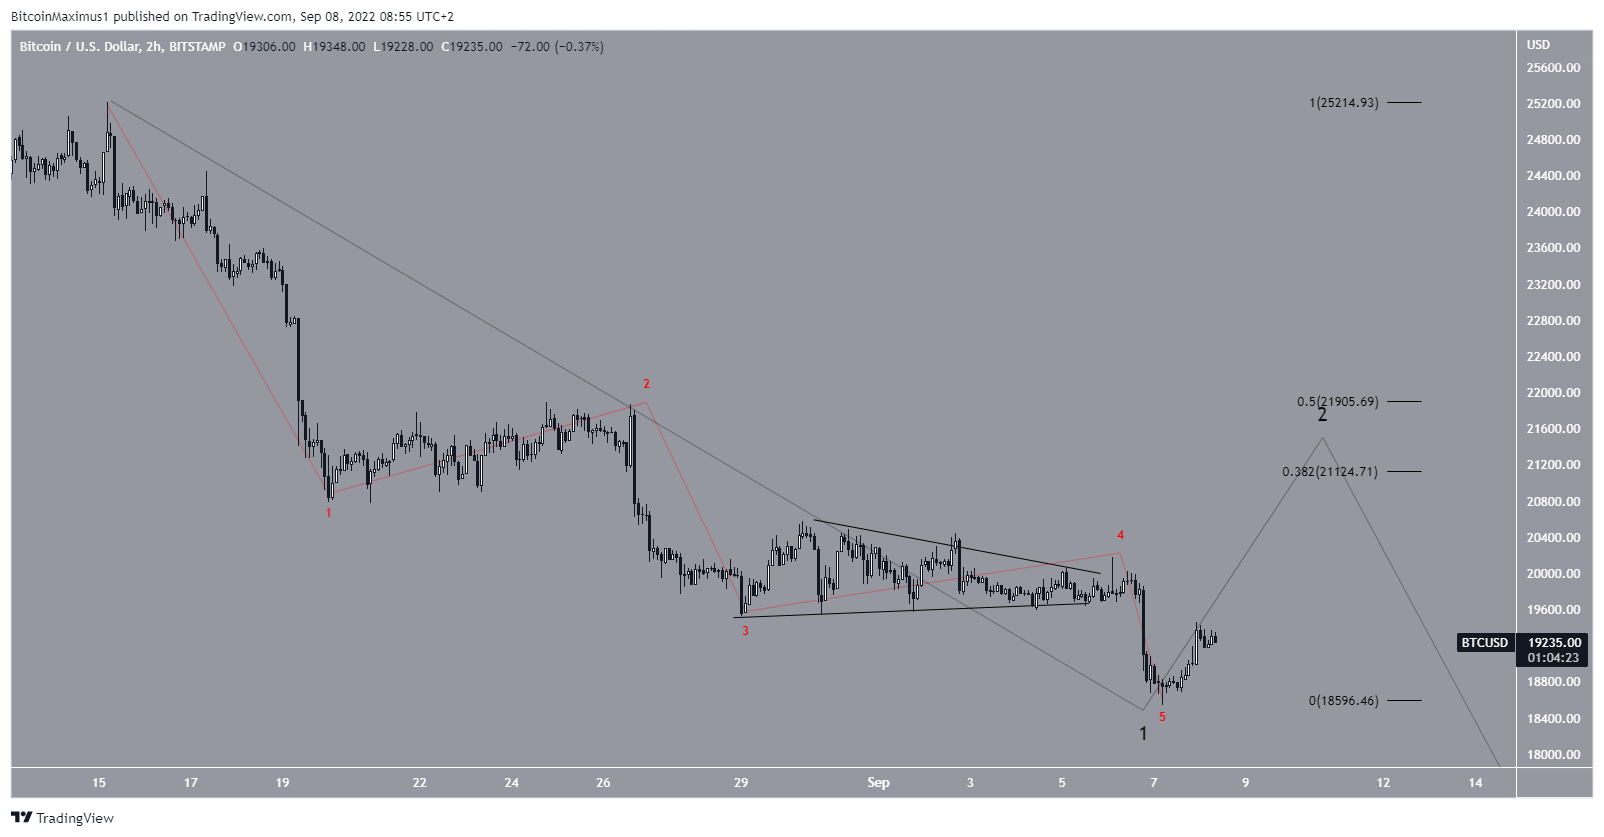
However, the short-term count (red) shows a completed five-wave downward movement. It is not certain if this was the entire fifth wave from the previous image, in which case it was truncated, or if it was just the first portion (black).
In both cases, a significant upward movement is likely, whether that is a bounce towards the $21,200 to $21,900 region or if it is a new bullish trend reversal.
For Be[in]Crypto’s previous Bitcoin (BTC) analysis, click here
