


The Optimism (OP) price is likely nearing the end of its corrective pattern, after which another upward movement is expected.
There was some positive Optimism news last week. The largest non-fungible token (NFT) marketplace on Optimism announced that it would not shut down after all. While the marketplace announced that it would do so last year, it canceled the plans after a prominent player swooped in. While Arbitrum is the current leader with a total value locked (TVL) of $3.38 billion, Optimism isn’t far behind in the Ethereum Layer 2 scaling ecosystem race, coming in at $1.91 billion TVL.
Optimism (OP) Falls After Bearish Pattern
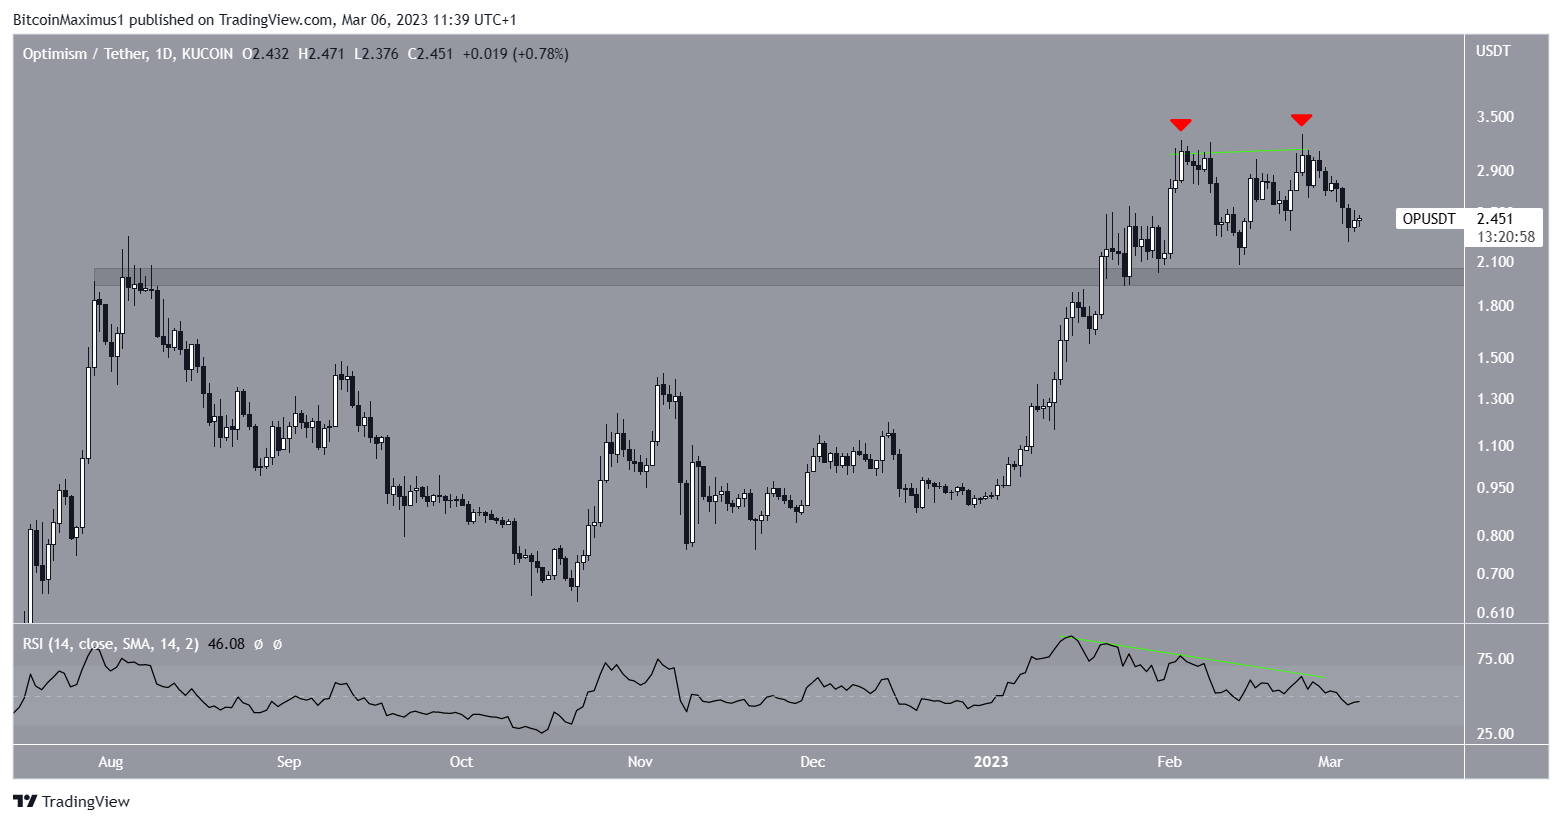
The Optimism (OP) price created a double top pattern in February-March 2023 (red icon). The double top is considered a bearish pattern, meaning that it usually leads to breakdowns. The price has fallen slightly after completing the second top.
The pattern was combined with a significant bearish divergence in the daily RSI, which had developed before the top. This further legitimizes the emergence of a bearish pattern and the possibility of a decrease.
If the OP coin price continues to fall, the closet support area will be at an average price of $2. This is an important long-term area that previously provided resistance.
On the other hand, an increase above the yearly high of $3.29 would mean that the price is done correcting, and a new high near $4.50 is expected.
Optimism (OP) Price Prediction for March: Correction Will Be Over Soon
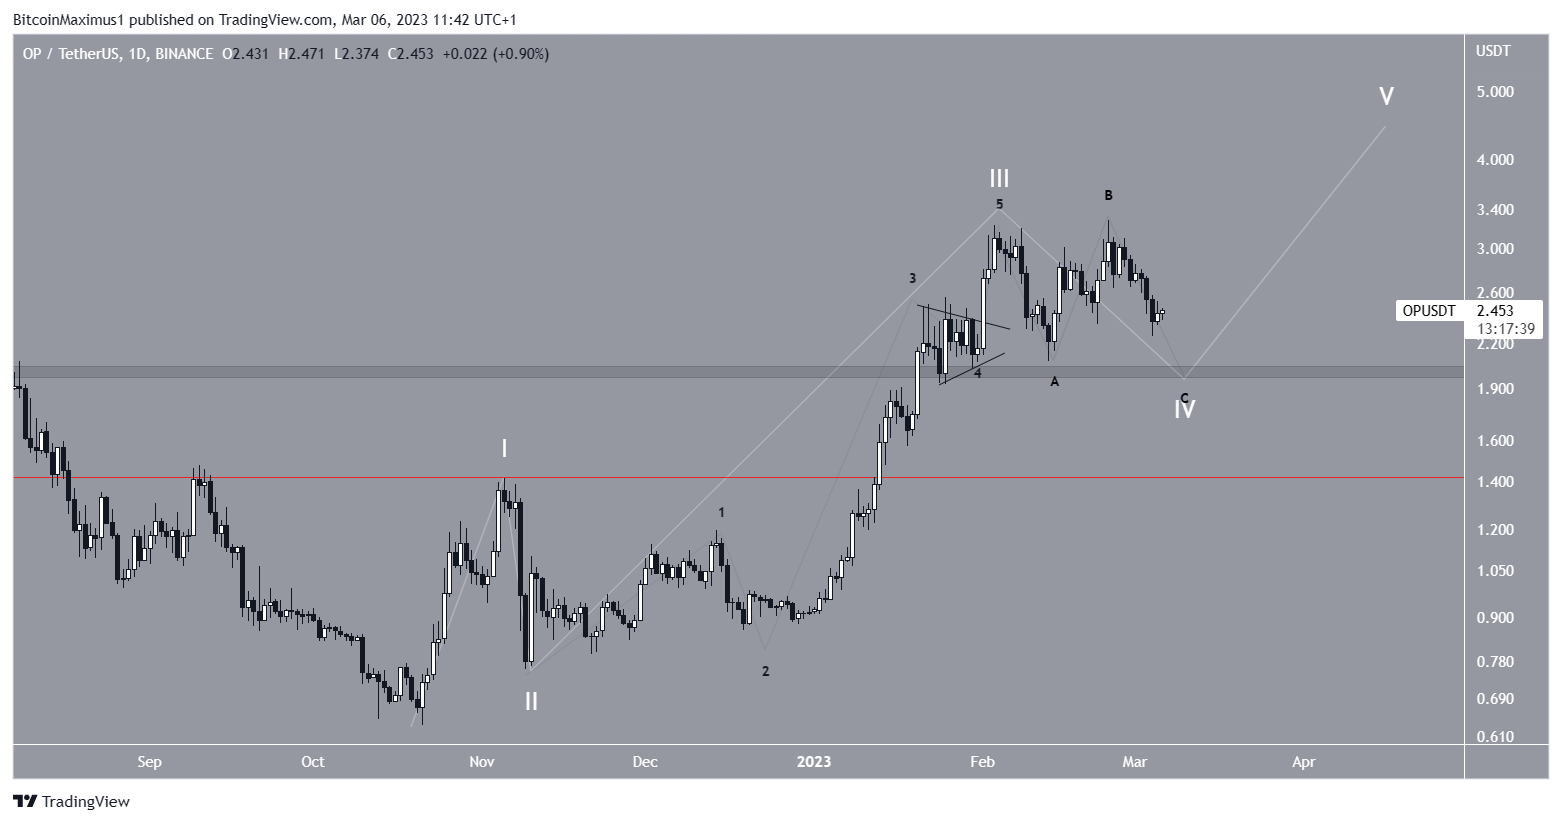
A closer look at the technical analysis from the daily time frame shows that the OP token price is likely in wave four of a five-wave upward movement (white). The sub-wave count is given in black.
If the count is correct, the price will complete its correction inside the $2 support area and resume its increase afterward. This also aligns with the wave count, since the $2 area is in the territory of sub-wave four.
A fall below the wave one high at $1.42 (red line) would invalidate this bullish Optimism price forecast. In that case, the OP price could fall toward $0.60.
To conclude, the most likely Optimism price prediction for March is a fall toward $2 followed by a significant upward movement. A decrease below $1.42 would invalidate this bullish forecast and could lead to lows near $0.60.
For BeInCrypto’s latest crypto market analysis, click here.


