


The Optimism (OP) price has increased considerably over the past 11 days, breaking out from a diagonal resistance line in the process.
While the increase could continue in the short-term, long-term readings, indicate that the move is just a relief rally. Thus, the long-term Optimism price prediction is still considered bearish.
Optimism (OP) Price Recovers After Significant Fall
The OP Price has decreased under a descending resistance line since the end of April. The drop led to a low of $0.89 on June 10. This was a new yearly low. However, the price has recovered since, bouncing by 51%.
More importantly, OP broke out from a descending resistance line that had been in place since April 15. This is a strong sign that the previous correction might have ended.
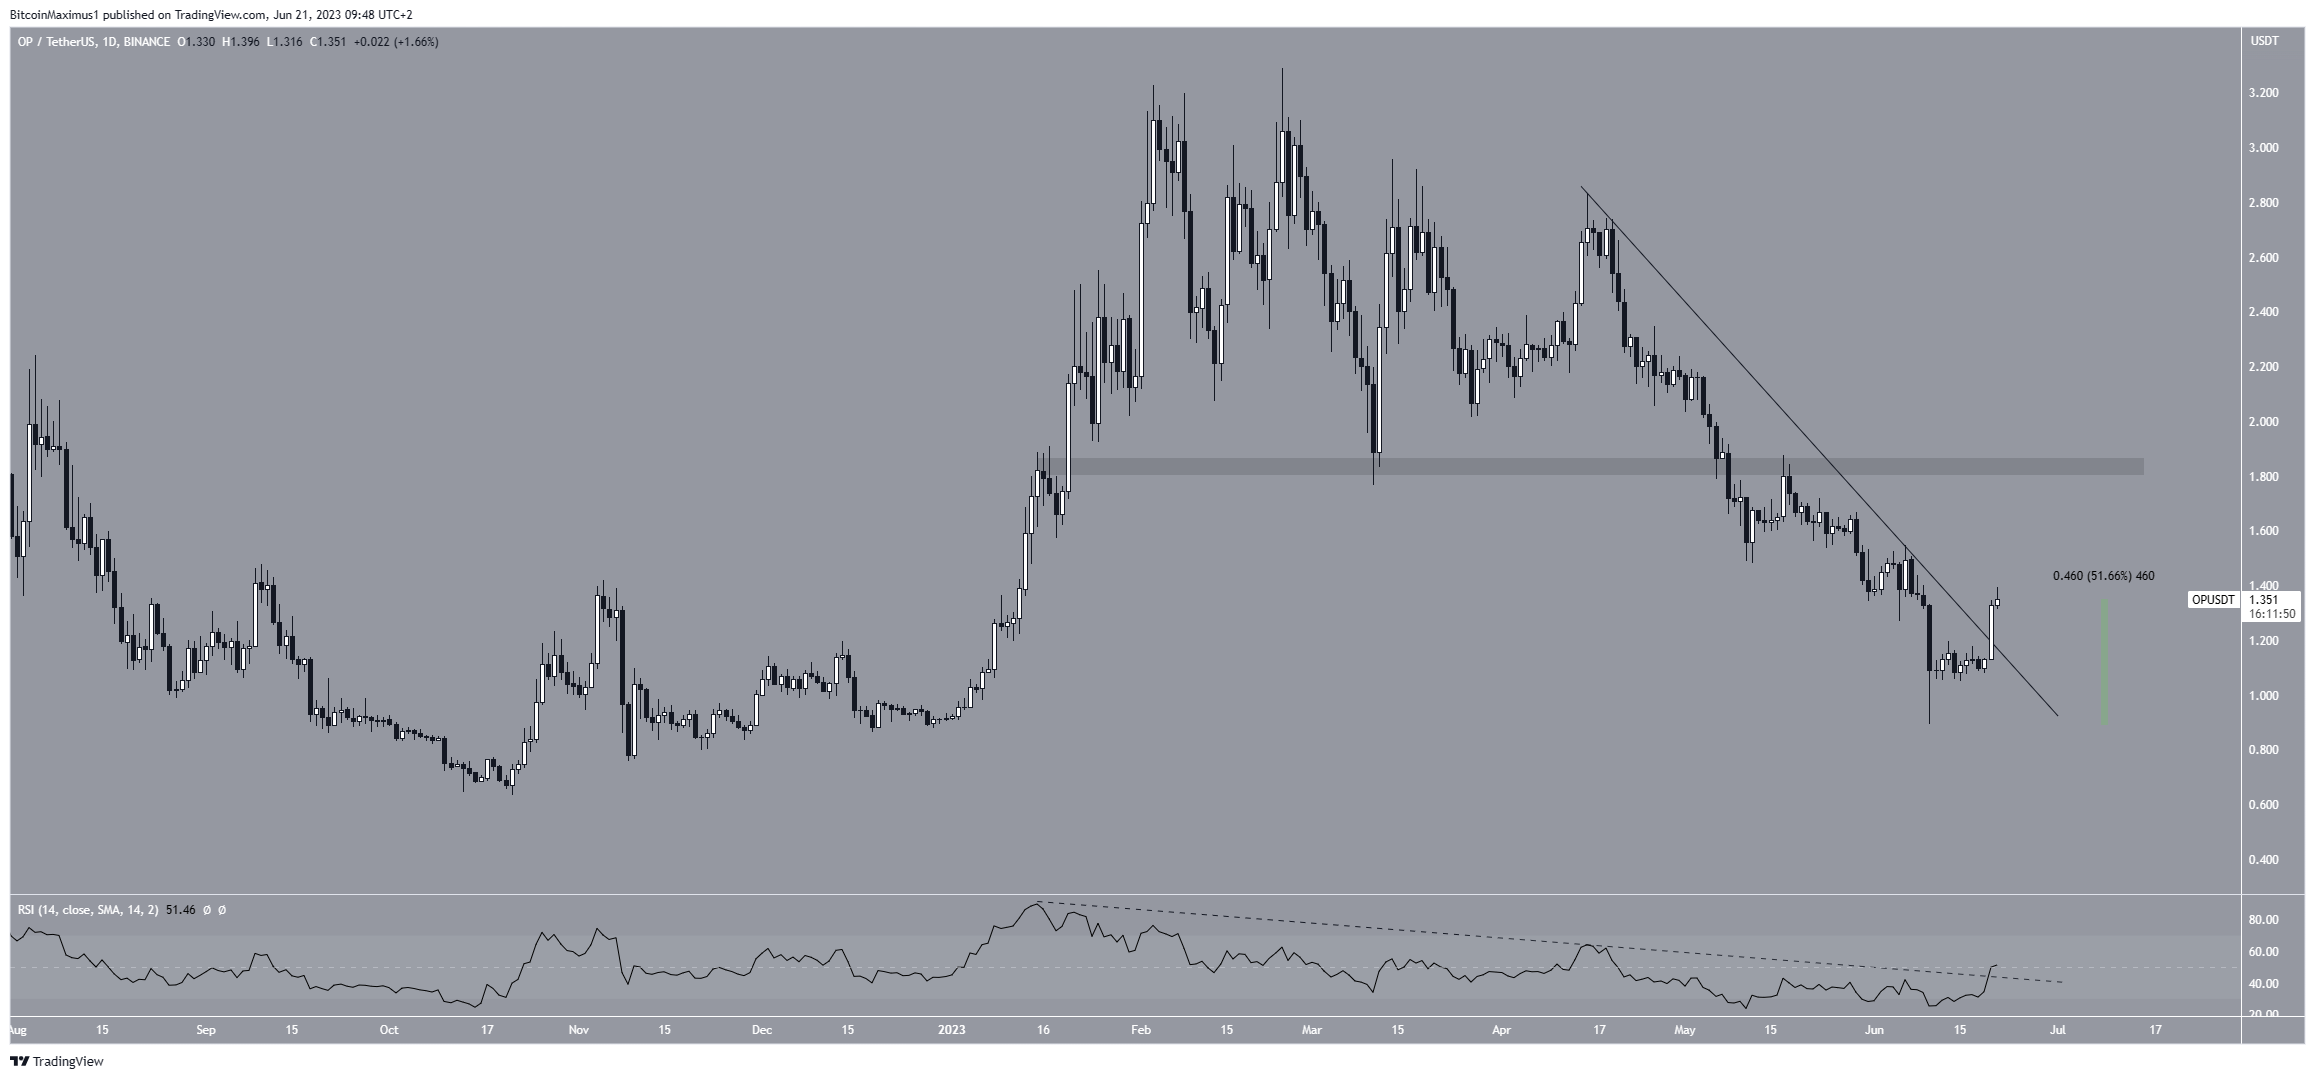
Additionally, the daily RSI legitimizes the ongoing increase. The indicator broke out from its descending resistance line and just moved above 50. As a result, the indicator suggests that the breakout is legitimate and the trend is bullish, at least in the daily time frame.
Optimism (OP) Price Prediction Still Bearish in the Long-Term
While the price action from the daily time frame provides hope for a relief rally, the wave count suggests that the long-term trend is bearish.
The main reason is that the increase between June 2022 and February 2023 is a three-wave structure. As a result, it is likely to be an A-B-C correction. Since the correction faces upward, it is, in turn, likely that the trend is bearish.
If correct, it means that the OP price is in sub-wave four (red) of wave three (white). Thus, after the current bounce is complete, the OP price will decrease again, falling to yet a new yearly low. The first target for the bottom of the movement is $0.30.
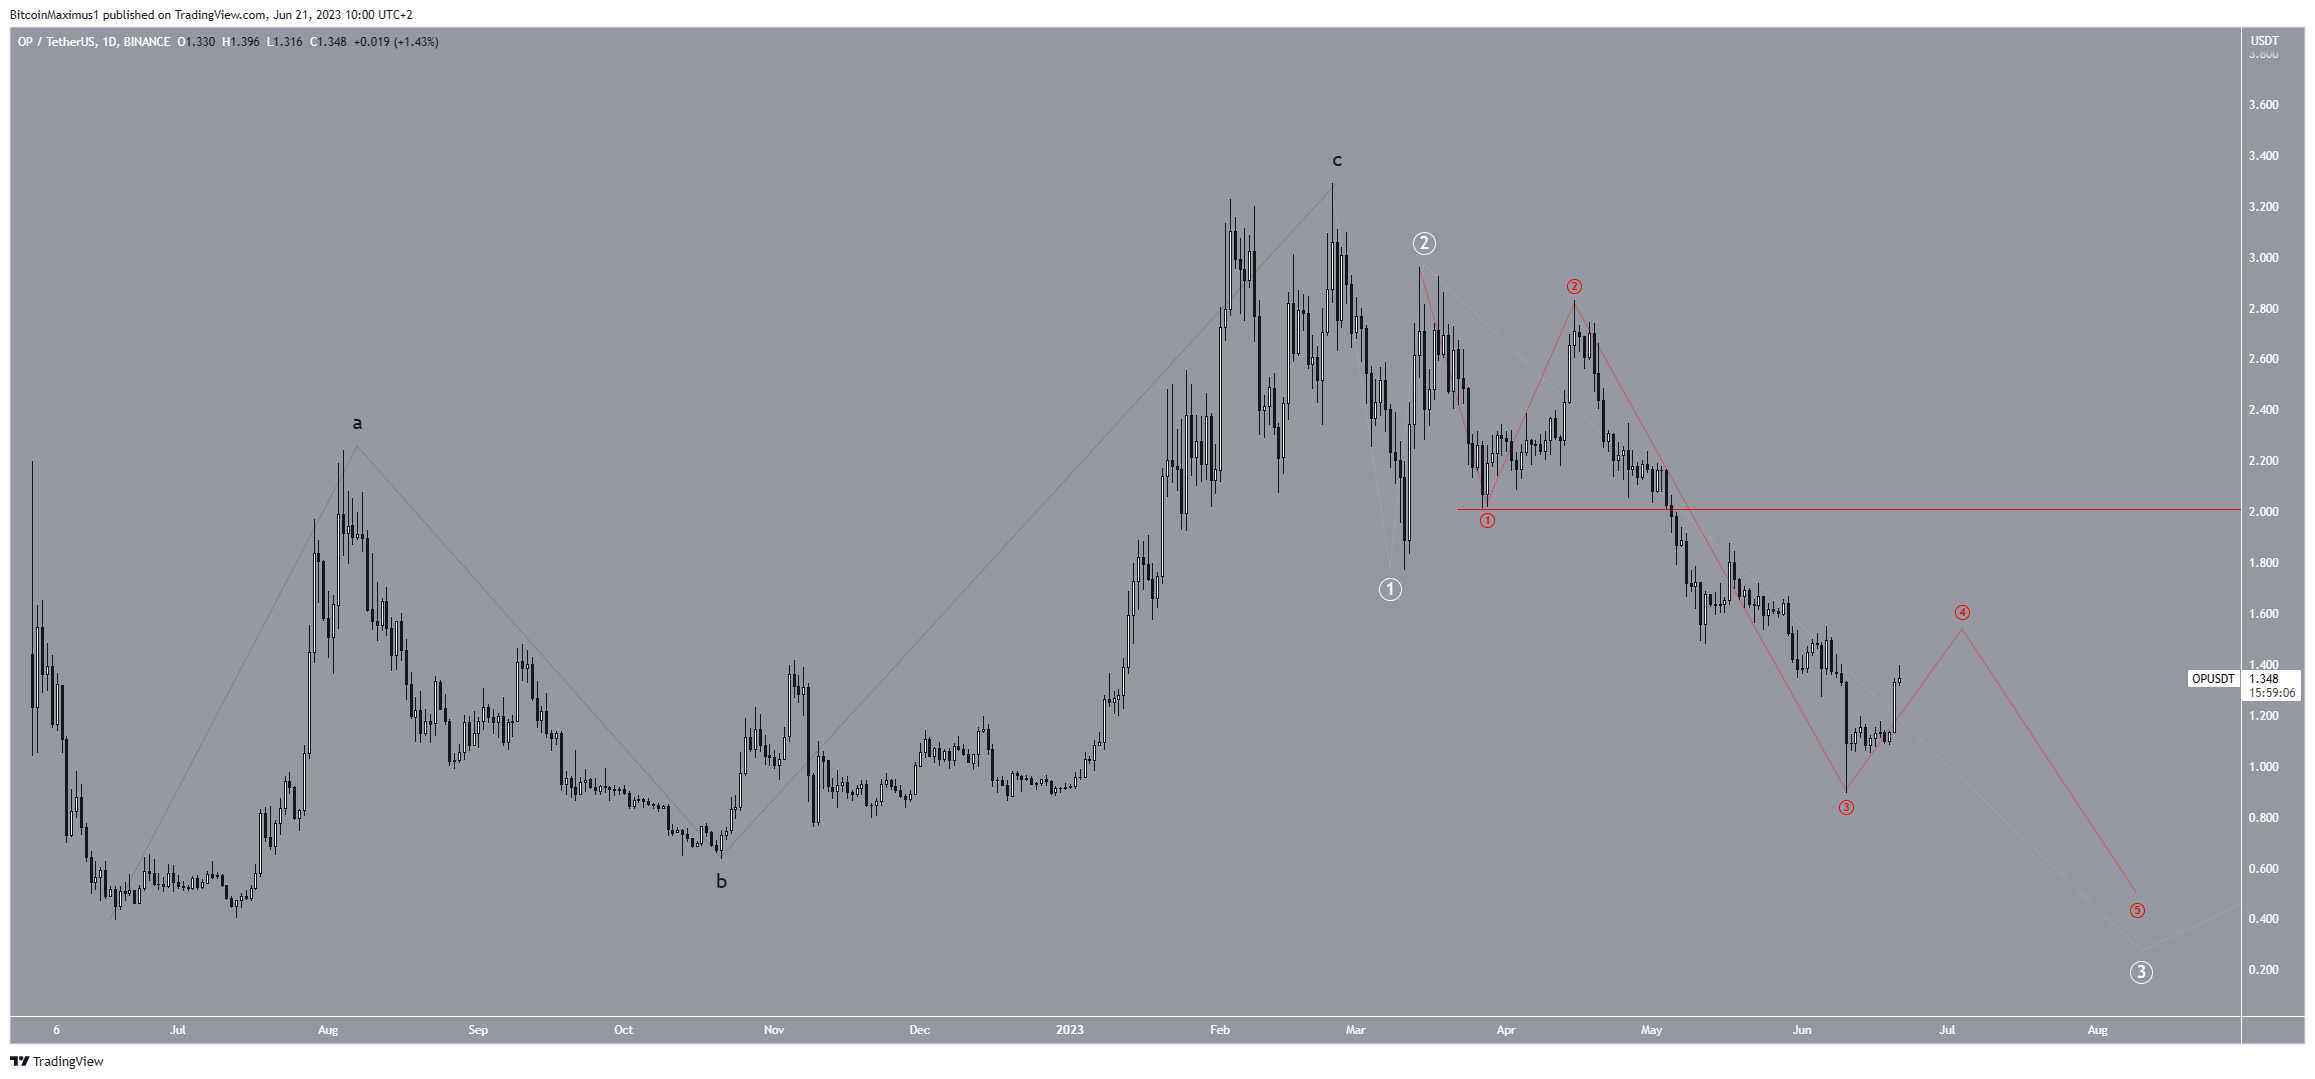
Despite this bearish OP price prediction, an increase above the sub-wave one low (red line) of $2.02 will mean that the trend is still bullish. In that case, the OP price can increase to $3.
More From BeInCrypto: Crypto signals: What Are They and How to Use Them
For BeInCrypto’s latest crypto market analysis, click here.



