


An on-chain metric is flashing bull market signals despite Bitcoin prices being in retreat at the moment.
The RHODL on-chain indicator is at a similar position as it was at the beginning of the last two major Bitcoin bull markets.
Bitcoin Bull Market Signals
Furthermore, the indicator, which was created by Philip Swift in 2020, uses a ratio of Realized Value HODL Waves.
On May 16, Swift said that when he created the indicator, “one thing that struck me was how it showed a new bull run forming.”
The analyst added that this was when the ratio value of younger coins began to increase. This is “where we are right now,” he said before adding, “Don’t panic about small price pullbacks. Zoom out.”
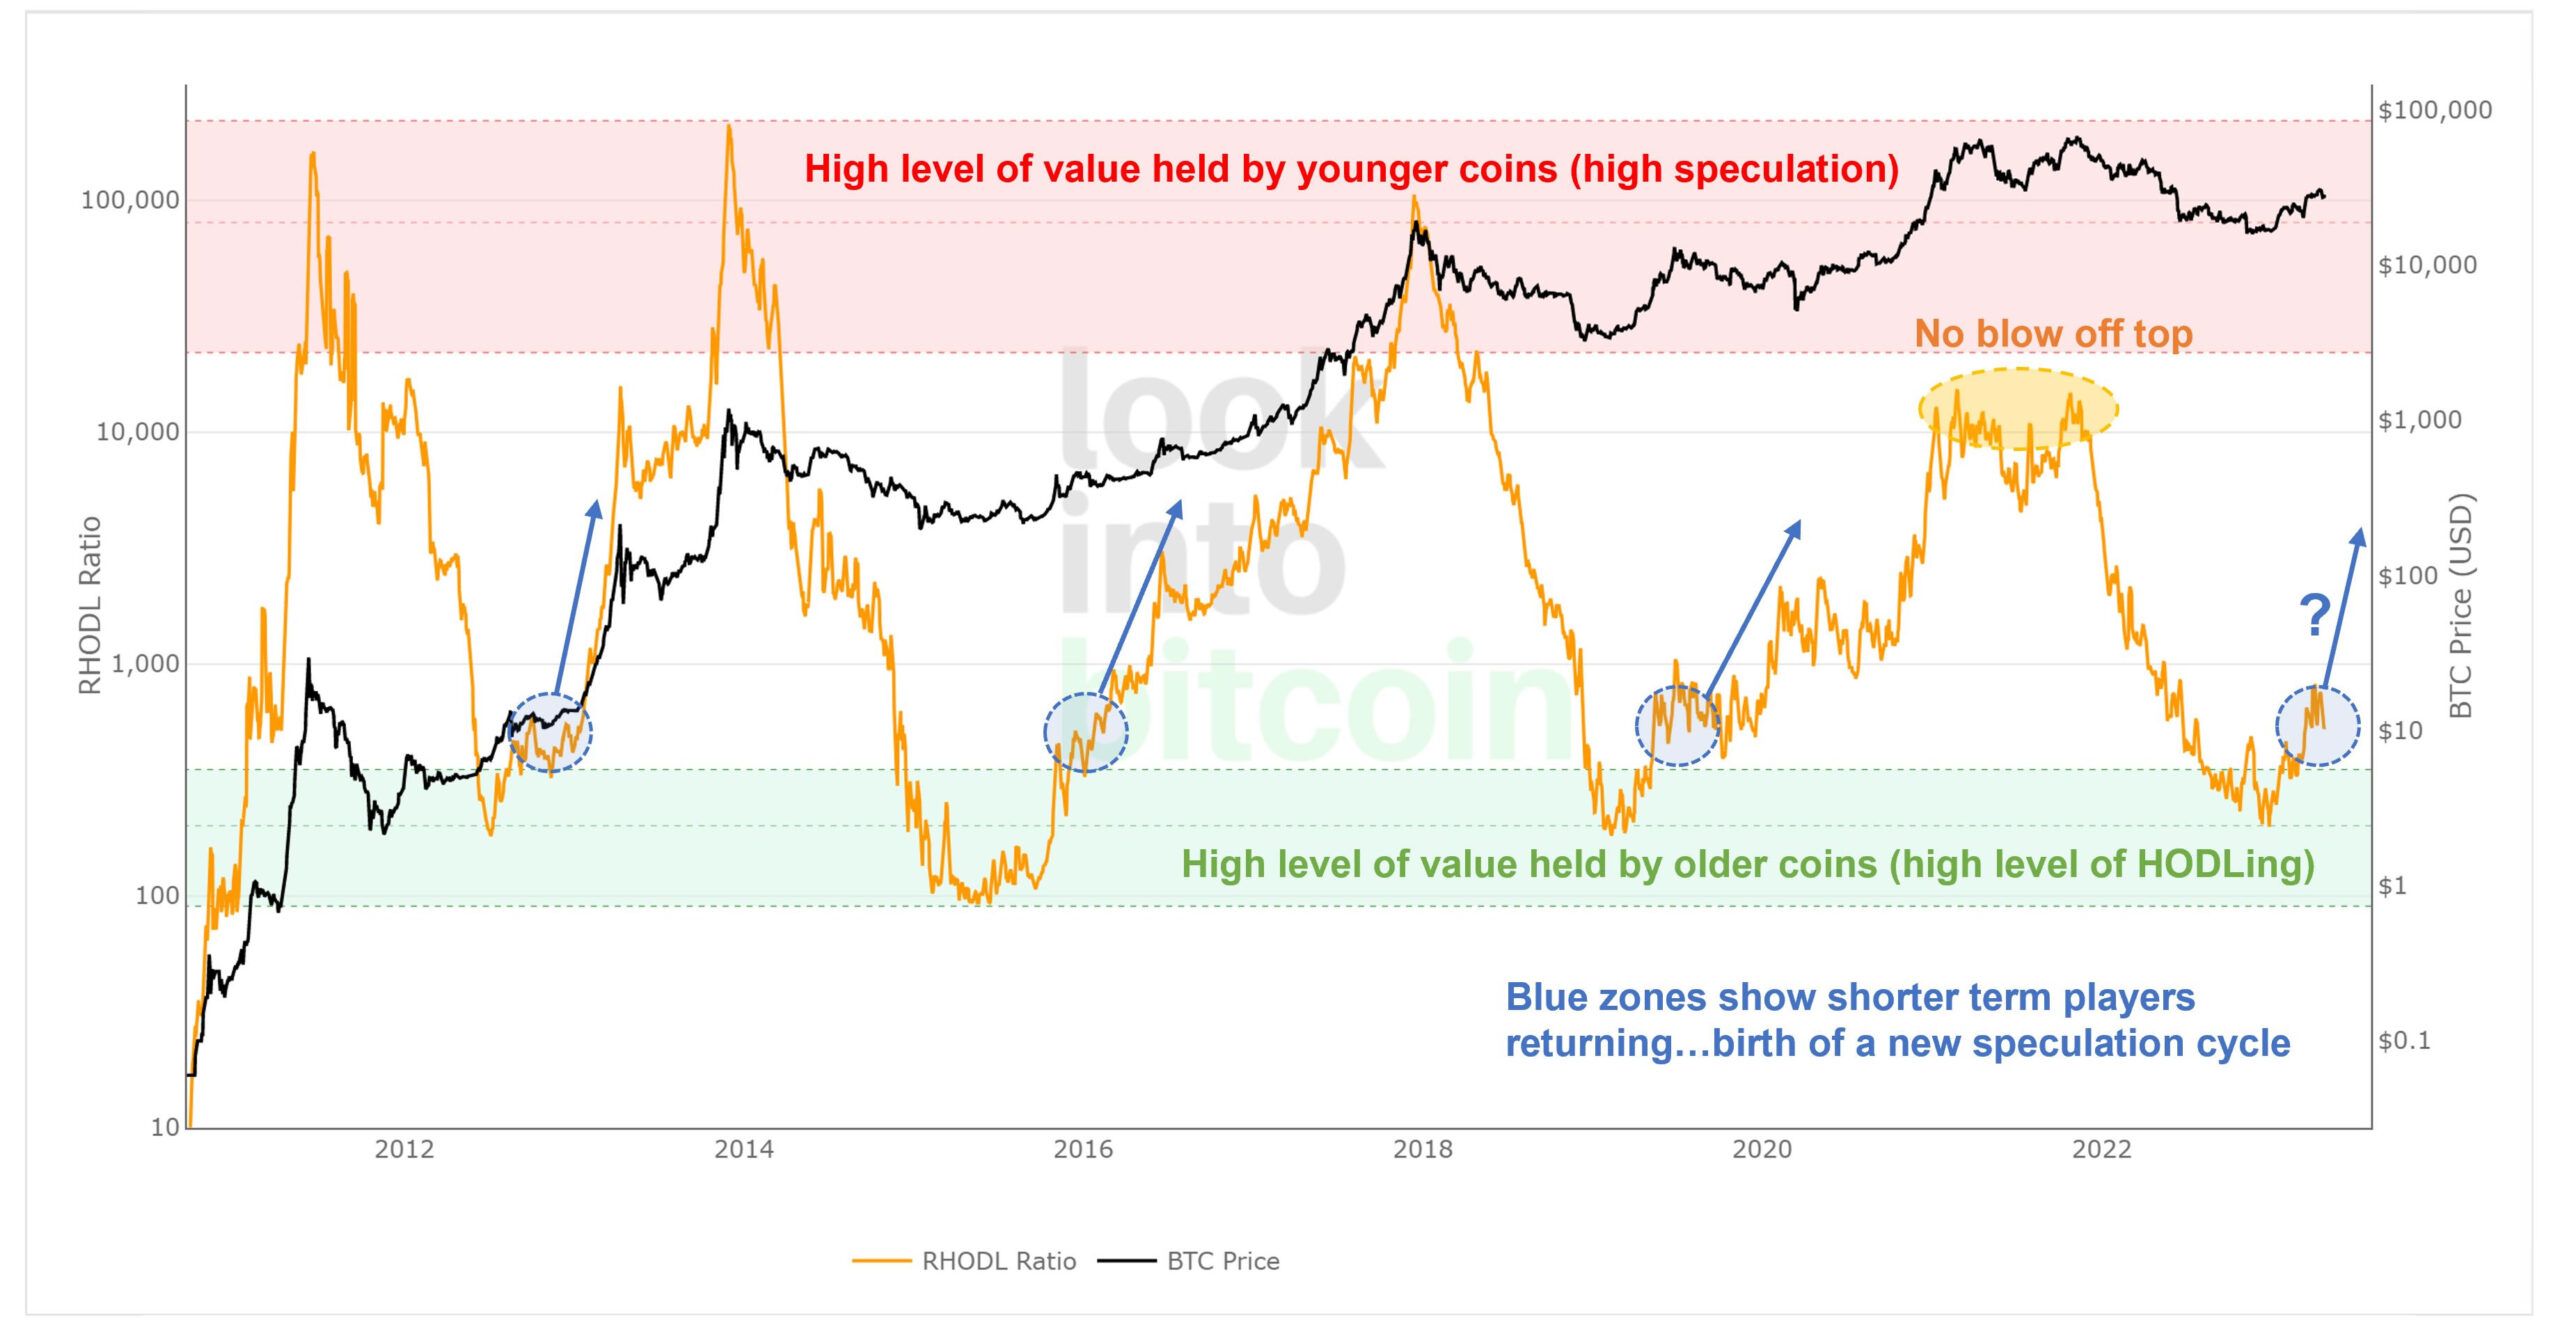
The indicator measures HODL waves at different age bands of UTXOs (unspent transaction outputs). These are weighted by the Realized Value of Bitcoins within each band.
Additionally, the Realized Value is the price of the coins when they were last moved from one wallet to another.
“When the 1-week value is significantly higher than the 1-2 year value it is a signal that the market is becoming overheated,” Swift explained.
In late February, it emerged from the accumulation zone, which could signal the birth of a new speculation zone.
Moreover, Bitcoin has crossed over several long-term on-chain indicators in recent months and remained above them.
It broke above the 200-week moving average in mid-March and is still above it, suggesting long-term trend change. The 200wma is currently at $25,818, according to Woo Charts data.
Furthermore, Bitcoin Realized Price is just $19,914. This is the value of all BTC in circulation at the price they last moved.
However, Bitcoin market sentiment is currently neutral as the crypto correction continues. The BTC fear and greed index has fallen back to 50 as the bulls and the bears battle for supremacy. It reached a local high of 69 last month as BTC topped $30,000 for the first time in almost a year.
BTC Price Outlook
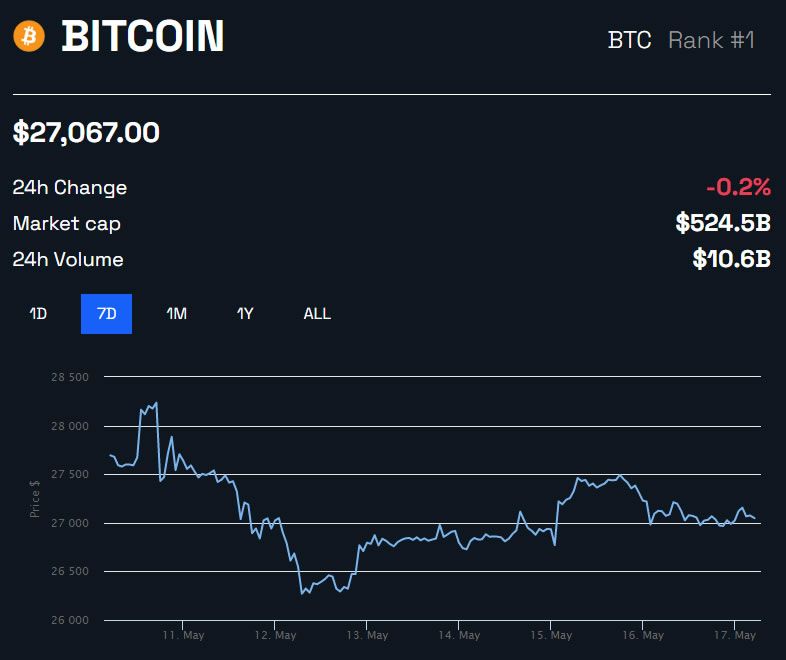
BTC prices are currently consolidating around the $27,000 range. The ‘king of crypto’ hasn’t moved much since the weekend but has lost 5.3% over the past two weeks.
Furthermore, the asset has lost 12% since its 2023 high in mid-April. Analysts have suggested that it could fall back to $24,000 during this correction as the buying pressure appears to have evaporated.


