
The Bitcoin (BTC) price closed September on a bullish note, concluding a nearly 5% increase for the month.
The beginning of October brought a significant price increase, which is still ongoing.
Bitcoin Price Increase Concludes Bullish Week
The technical analysis of the weekly timeframe shows that the BTC price has increased since the week beginning of September 11. The increase confirmed the $25,300 horizontal area as support.
The increase further accelerated last week, leading to the creation of a bullish engulfing candlestick.
This is a type of candlestick in which the entire previous period’s losses are erased. It is considered a positive sign for the future trend.
Check out the Best Crypto Sign-Up Bonuses in 2023
However, despite the bounce, Bitcoin still has not negated the losses of the August 17 (red icon) decrease, which created a bearish engulfing candlestick.
The candlestick began at $29,200, slightly below the $30,500 horizontal resistance area.
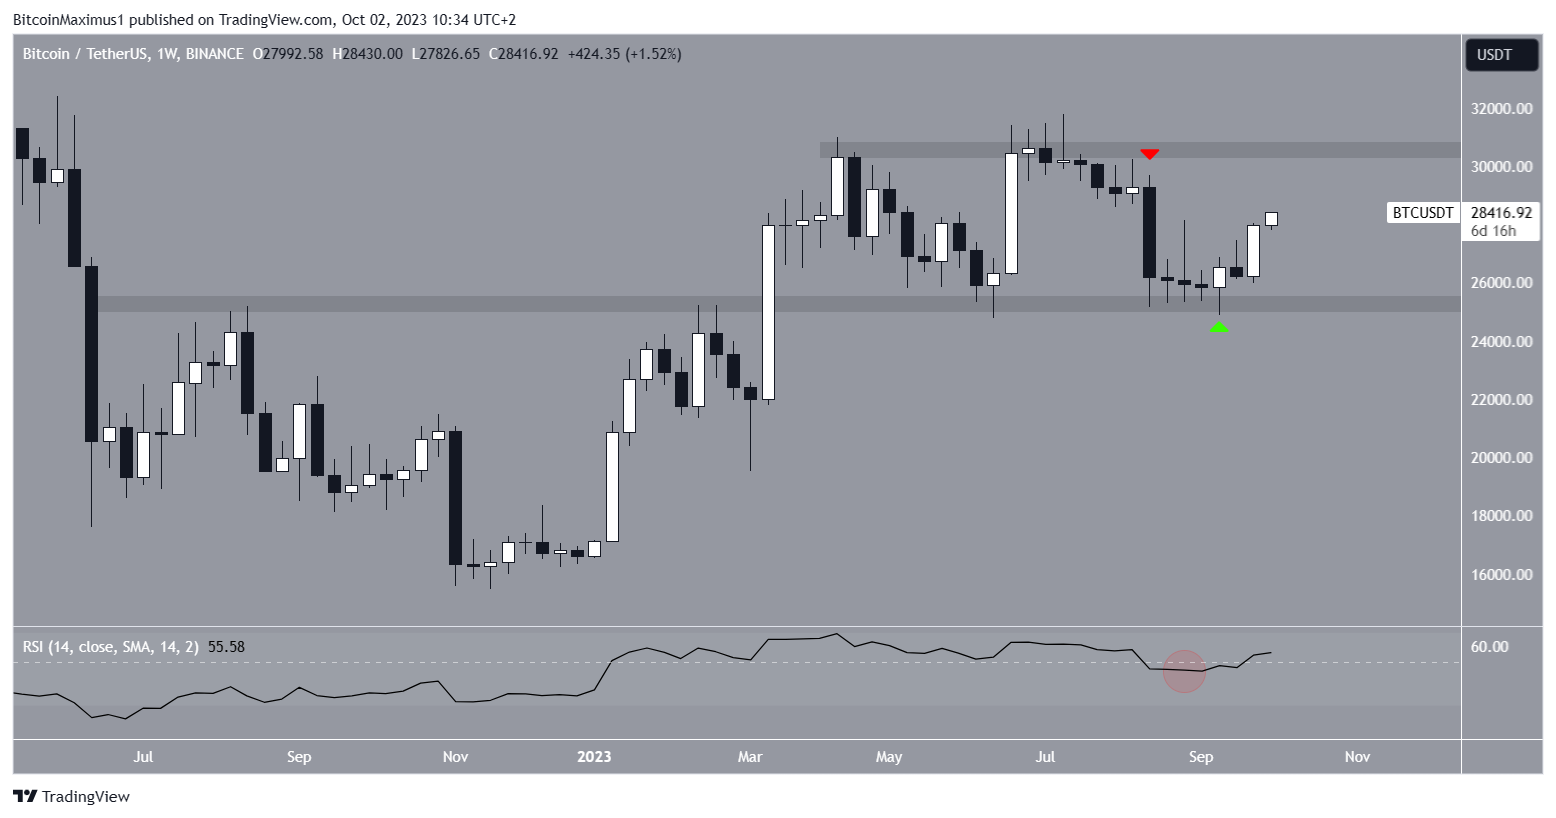
The weekly RSI is bullish. The RSI is a popular metric among traders for gauging momentum and informing their buy or sell decisions on assets.
A reading over 50, especially in an uptrend, is considered bullish, while a reading under 50 is considered bearish.
The indicator is above 50 and increasing, both signs of a bullish trend. The ongoing increase suggests that the previous drop below 50 (red circle) is only a deviation, another sign associated with bullish trends.
BTC Price Prediction: Clears Resistance Trendline and Regains Footing
The technical analysis for the daily timeframe also provides a bullish reading. The Bitcoin price broke out from a descending resistance trendline, suggesting the previous correction is complete.
BTC is trading inside the 0.5 and 0.618 Fib retracement resistance region at $28,350 to $29,150.
Whether it clears it or gets rejected will be key in determining the future trend.
Like the weekly timeframe, the daily RSI supports the ongoing increase since the indicator is above 50 and moving upwards.
If the price closes above the 0.618 Fib retracement level, it can increase by another 10% to the yearly high near $31,450.
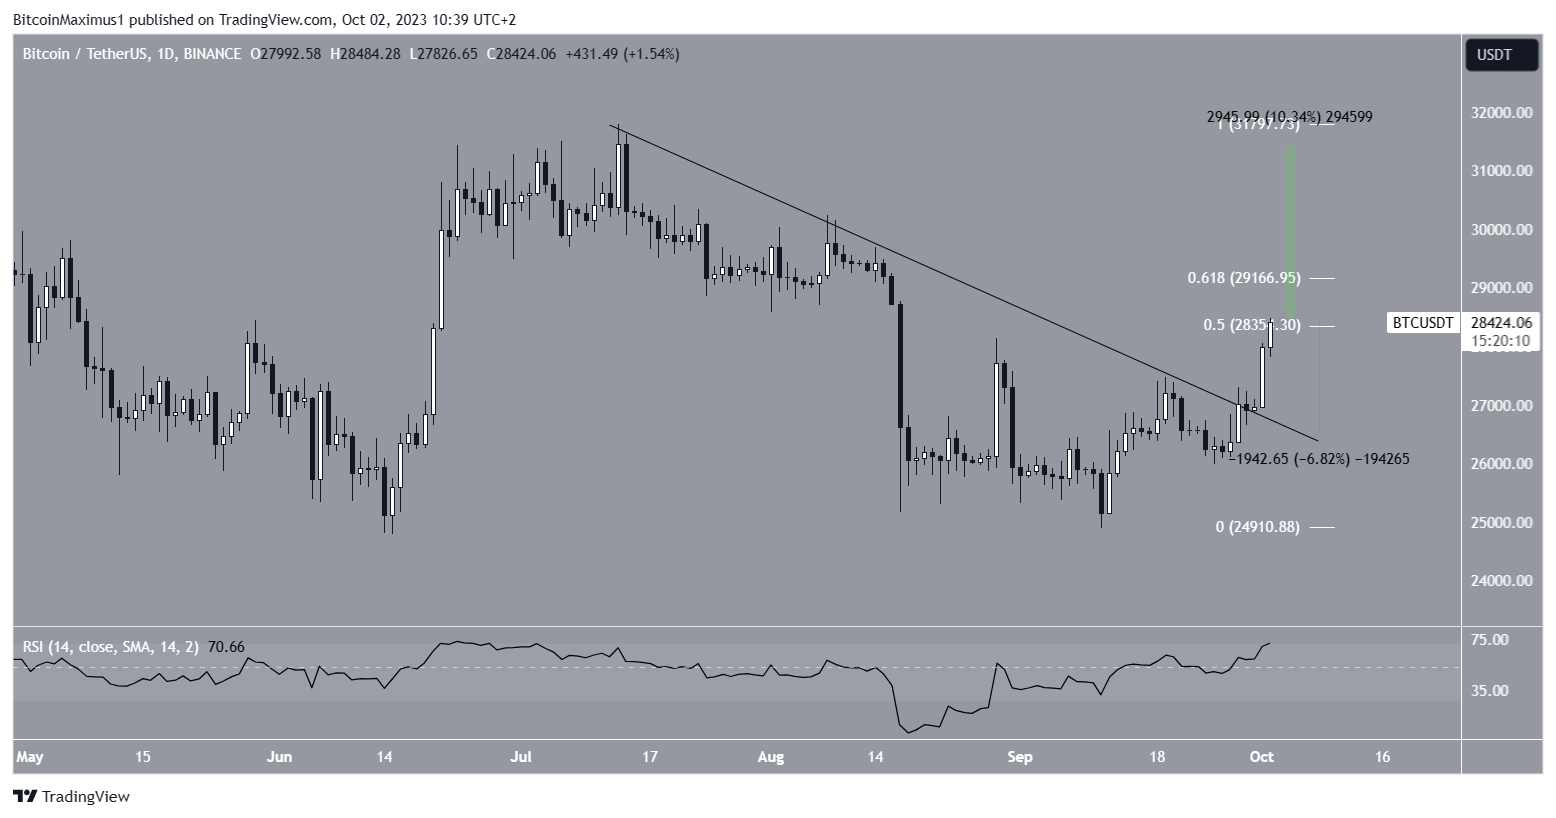
Despite this bullish Bitcoin price prediction, a rejection from the 0.5-0 and 618 area will likely lead to a 7% fall.
This would take the Bitcoin price to the descending resistance line at $26,500, a fall of 7% from the current level.
