


The NEO price has broken out from a long- and short-term descending resistance trendline.
The price is currently attempting to break out from the $13.30 horizontal resistance area.
NEO Reaches Long-Term Resistance
The NEO price has increased since the beginning of the year, when it bounced at the $6.10 horizontal support area. The price broke out from a descending resistance trendline in January.
The NEO price did not break out from the $13.30 area initially, rather, it was rejected by it. Then, NEO created a higher low in October (white).
After beginning another upward movement two weeks ago, the altcoin is making another attempt at breaking out above the $13.30 resistance.
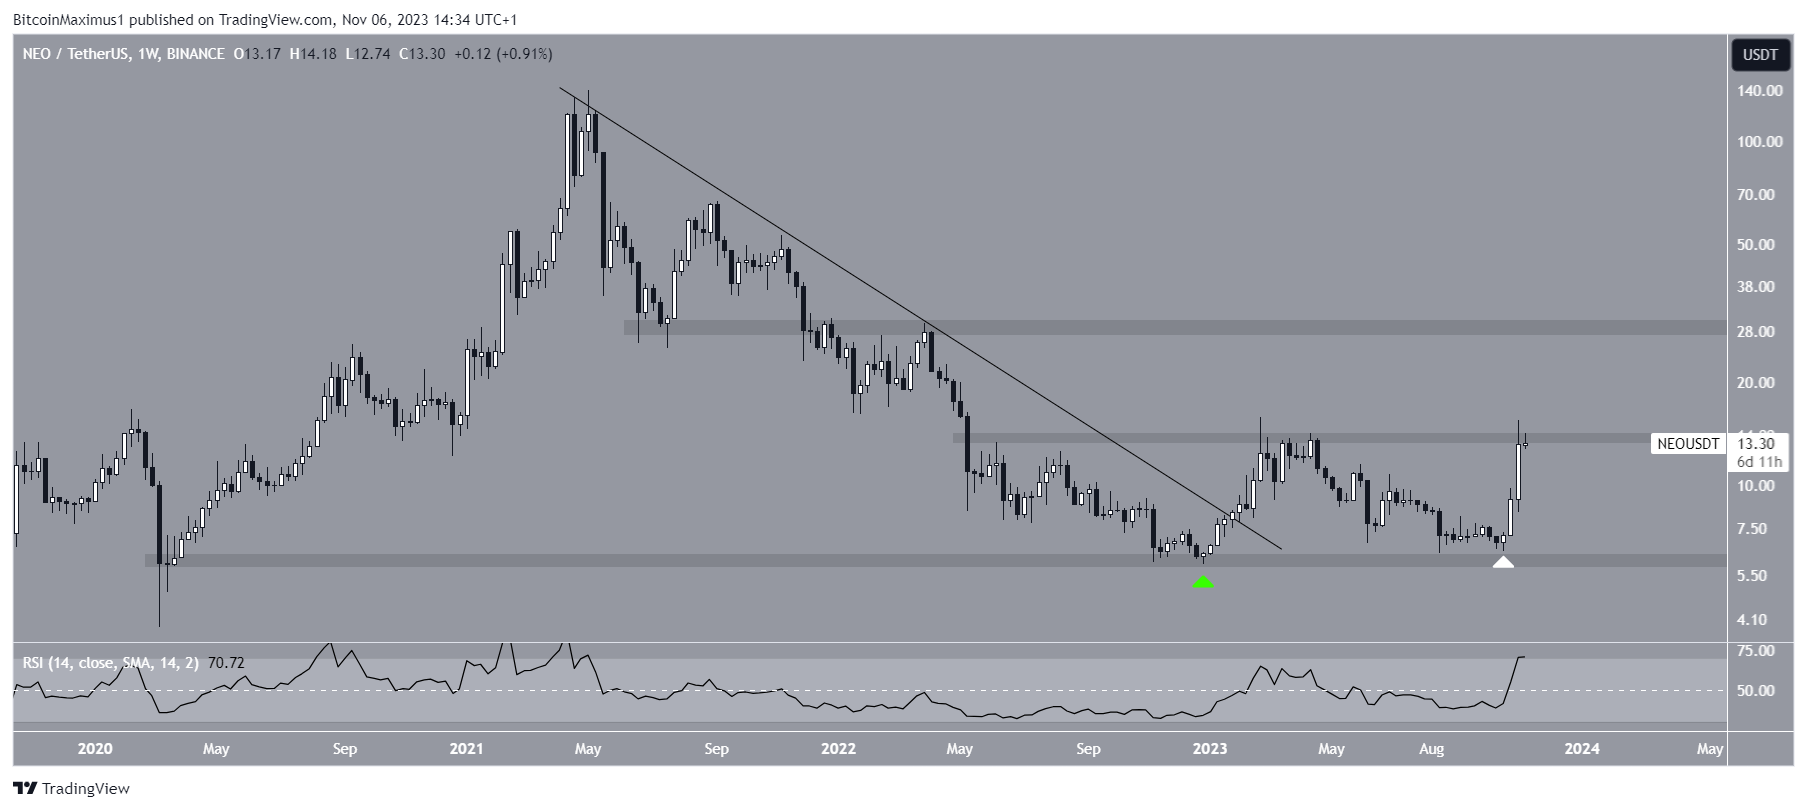
The weekly Relative Strength Index (RSI) is bullish. With the RSI as a momentum indicator, traders can determine whether a market is overbought or oversold and decide whether to accumulate or sell an asset.
Bulls have an advantage if the RSI reading is above 50 and the trend is upward, but if the reading is below 50, the opposite is true. The indicator is above 50 and increasing, both signs of a bullish trend.
Read More: 9 Best Crypto Demo Accounts For Trading
NEO Price Prediction: How Long Will Increase Continue?
The daily timeframe technical analysis provides a mixed outlook. The reasons for this come from both the Elliott Wave count and the RSI.
Technical analysts employ the Elliott Wave theory as a means to identify recurring long-term price patterns and investor psychology, which helps them determine the direction of a trend.
There are two possibilities for the future count. If the increase is an A-B-C correction (white), the price will reach a local top near $17 before falling.
If the increase is a new bullish impulse (white), the price will reach the $23.40 resistance area before retracing slightly and resuming its ascent.
While the daily RSI is increasing, it is also in overbought territory. This is a sign often associated with local tops. So, both counts still remain possible.
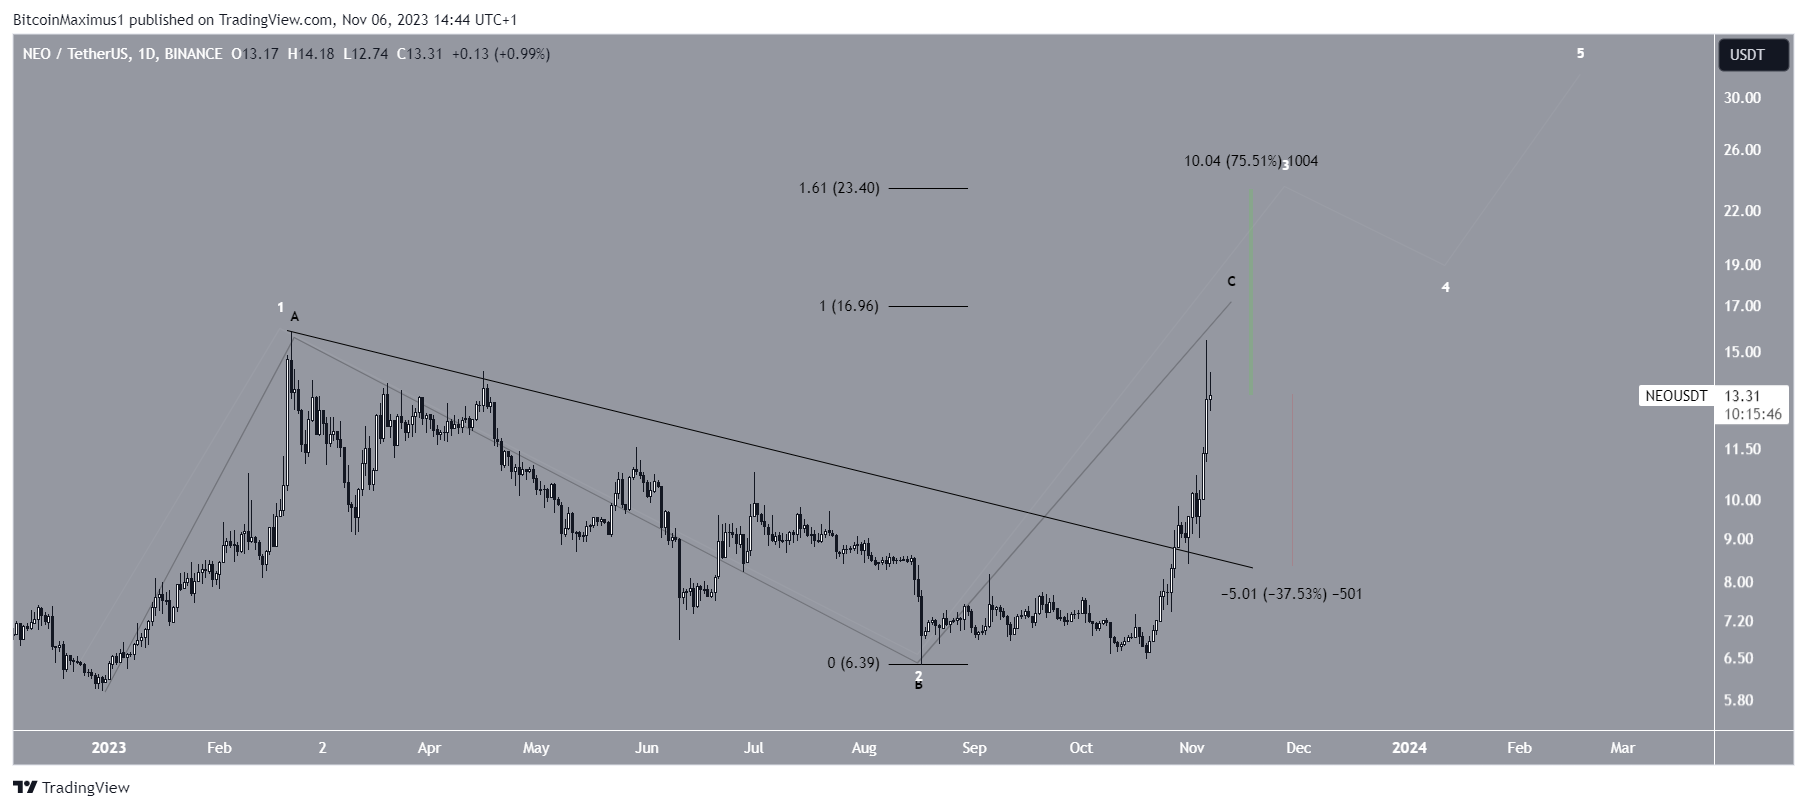
To conclude, the reaction to the $17 resistance area will be crucial in determining the future NEO trend.
A breakout above it can lead to a 75% increase to the next resistance at $23.40, while a rejection can cause a 37.50% drop to the descending resistance trendline.
For BeInCrypto’s latest crypto market analysis, click here


